
 ?Mathematical formulae have been encoded as MathML and are displayed in this HTML version using MathJax in order to improve their display. Uncheck the box to turn MathJax off. This feature requires Javascript. Click on a formula to zoom.
ABSTRACT
Shoppers typically want to spend an amount of time at a destination that is proportional to the travel time required to arrive there; thus, the travel time can be considered the cost of their trip. This is likely to be the case across regions with different urban structures and cultures. The purpose of this study was therefore to analyze the shopping behaviors contained in travel survey data from three metropolitan areas in Japan to identify common patterns and indicators based on travel time and stay time, thereby obtaining an understanding to inform future trade area analyses. Both the travel time and stay time associated with shopping behavior were found to be log-normally distributed regardless of metropolitan area, and four shopping behavior patterns common among the metropolitan areas were identified. The “stay coefficient” was then defined to express the elasticity of stay time according to travel time, and its values were similar according to shopping behavior pattern regardless of metropolitan area. The stay coefficient proposed in this study can therefore be applied to identify shopping behavior patterns in any urban area based on the relationship between travel time and stay time, realizing a novel approach to the analysis of and marketing for trade areas when planning the construction or renovation of commercial facilities. This approach can help inform the decisions of urban policy makers, marketing advisors, and commercial facility operators, and should be of interest to researchers and practitioners working with geospatial, shopping, and other human behavioral characteristics.
1. Introduction
Travel survey data contain of hundreds of thousands of data points for a single metropolitan area. Processing such a large quantity of data requires a great deal of time, and the same analysis approach is rarely applied across multiple metropolitan areas. The purpose of this study was therefore to address the need for an expedient, widely applicable method for analyzing shopping behavior using travel survey data from multiple metropolitan areas in Japan. The results reveal new characteristics of shopping behavior by quantitatively analyzing the relationship between the travel time to a destination and the time spent there. Thus, the objective of this study was to obtain an understanding of shopping travel behavior that can not only be used throughout metropolitan areas in Japan, but also around the world.
At present, visitor stay time in existing commercial facilities can be quantified relatively easily using shopper surveys conducted by facility managers, records of entry and exit times, or camera-based behavior analyses. Facility managers can also calculate the expected visitor stay time when developing a facility based on its size, type, and provided service. If it were possible to derive the travel time from a visitor’s home to a given facility based on this calculated stay time, area marketing or trade area analyses of that facility could also be performed during development by incorporating the stay time into the existing spatial interaction model. As a result, the primary focus of this study was to derive the relationship between travel time and stay time for urban shopping behavior. This relationship can be applied to inform a better understanding of shopping behavior characteristics and replace the use of existing complex models that can only be understood by specialized researchers, thereby enabling community-level regional and store planning; this should be of interest to behavioral researchers, urban policy makers, marketing advisors, and commercial property operators alike. Ultimately, the analysis of shopping behavior patterns conducted in this study using a “big data” set comprising travel survey responses contributes to research in the field of location intelligence by providing useful, accessible insights supporting the trade area analysis process typically undertaken when planning a commercial facility.
The remainder of this paper is organized as follows. First, the relevant research is reviewed in Section 2. Then, Section 3 introduces the methodology applied in this study and Section 4 presents the results, followed by a discussion in Section 5. Finally, the conclusions are presented in Section 6.
2. Literature review
Shopping behavior has been widely studied in various countries. This literature review specifically addresses the findings of studies related to travel time and stay time, which constitute the subject of the present study. Schwanen (Citation2004) analyzed the determinants of shopping time using data from the Dutch national travel survey and found that more time tended to be spent on single shopping trips in urban environments than in suburban or rural environments. Studying shopping malls in Mumbai, Meena, Patil, and Mondal (Citation2019) stated that travel time played an important role in transportation choice behavior. Lundevaller (Citation2009) used Swedish travel survey data to analyze how travel costs affect the frequency of recreation and shopping, finding that the impact of changes in travel costs can be measured using elasticity estimates. Yamada and Hayashida (Citation2020) analyzed the relationship between stay time and travel time for shopping behavior in Japan using data from the 2000 Keihanshin metropolitan area travel survey (corresponding to the Kinki metropolitan area in this study). In a study using field data describing shopping routes and purchases at a large supermarket in the eastern United States, Hui, Bradlow, and Fader (Citation2009) found that consumers were more likely to shop and buy when they spent more time in the store. Similarly, in a study of shopping malls in China, Li et al. (Citation2021) stated that increased shopping duration led to an increase in the amount of money spent by customers.
Previous studies employing travel surveys of urban populations in Japan include comparisons and analyses of travel surveys from different countries, various travel and shopping behavior models, and assorted commercial facility trade area aspects. Sakai (Citation2007) reviewed the implementation and utilization of travel surveys in France, Germany, the United States, the United Kingdom, and Japan. Shimazaki et al. (Citation2009) analyzed travel survey data for the Tokyo metropolitan area in Japan and found that the correlation between population data, time of day, and the number of stores effectively explained store locations. Kagawa (Citation1972) analyzed the trade areas of department stores and supermarkets in Hiroshima City, Japan based on their floor space. Furthermore, Suzuki et al. (Citation2012) analyzed the characteristics of pedestrians who remained in the city for a long time and observed that people who went to the city without a purpose tended to stay longer and take breaks or eat and drink more often. In addition, a study by Okada, Yoshida, and Kashihara (Citation1970) investigated the length of stay (or service time) and obtained its probability distribution for various facilities such as libraries, shopping centers, zoos, amusement parks, museums, and exhibition halls. A number of literature reviews (De Pascale, Meleddu, and Abbate Citation2021; Jing et al. Citation2018; Lau Citation1995; McCarthy et al. Citation2017; Oh et al. Citation2018; Rasouli and Timmermans Citation2014; Wang and Zhou Citation2017; Zhang et al. Citation2012) have been published summarizing various travel survey studies to inform urban planning and transportation policies. Travel surveys from various regions have also been analyzed to derive different travel and transportation demand models (Nielsen, Mulalic, and Christiansen Citation2016; Omer et al. Citation2010; Salon and Aligula Citation2012; Toole-Holt, Polzin, and Pendyala Citation2005; Verma et al. Citation2018) and explore health correlations (Merom et al. Citation2010; Shirgaokar et al. Citation2020; Taniguchi, Sasaki, and Sasaki Citation2018; Wesolowski et al. Citation2014). More recently, travel behavior has been studied through activity-based models (Garrett Citation2014; Hafezi, Millward, and Liu Citation2018), which use travel survey data to model travel behavior and identify clusters of activity patterns according to personal attributes (Millward, Hafezi, and Daisy Citation2019; Daisy, Liu, and Millward Citation2020; Daisy, Millward, and Liu Citation2020; Hafezi et al. Citation2021).
However, few studies in the literature reviewed by the author have focused on the correlation between the travel time to a destination and the stay time at that destination; only a case study by Yamada and Hayashida (Citation2020) analyzed this correlation in a single metropolitan area. However, as it is unclear whether their analysis would yield similar results in other metropolitan areas, this correlation should be analyzed in multiple metropolitan areas.
3. Methodology
3.1. Study area
Today, Japanese cities are confronting issues associated with population decline, regional revitalization, and the realization of environmentally friendly compact cities. Japan’s population grew quickly after World War II until a period of rapid economic growth beginning in the early 1970s, when the population flowed into urban areas. The total population of Japan peaked at 128.08 million in 2008, and then began to decline. According to the Ministry of Land, Infrastructure, Transport and Tourism (Citation2021a), Japanese cities are currently striving to realize environmentally friendly compact forms to prepare for impending population decline. Indeed, supermarkets and stores in regional cities are already finding it difficult to maintain their operations owing to declining consumer demand associated with depopulation. However, while residential populations and commercial sales are declining in urban centers, large-scale commercial facilities are expanding on former factory sites and in suburban areas.
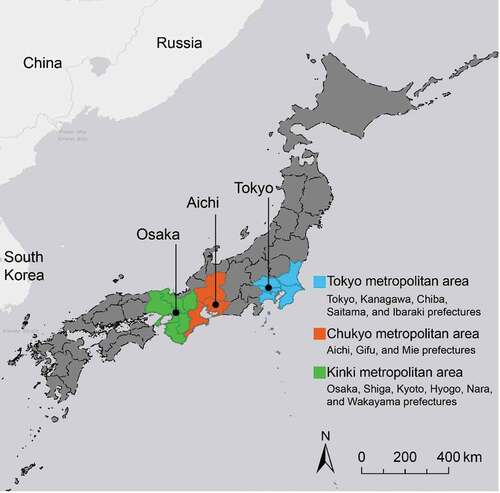
The analysis of shopping behavior in this study was conducted in the three major Japanese metropolitan areas shown in . The Tokyo metropolitan area comprises the capital city of Japan, Tokyo, and four neighboring prefectures. The Chukyo metropolitan area comprises four neighboring prefectures, including Aichi Prefecture, which has the second largest economy (in terms of gross domestic product) after Tokyo and Osaka Prefecture. The Kinki metropolitan area comprises five neighboring prefectures, including Osaka Prefecture.
3.2. Survey data
Since the first full-scale person trip survey (hereafter referred to as the “PT survey”) was conducted in the Hiroshima metropolitan area in 1967, PT surveys have been conducted every ten years in metropolitan areas throughout Japan – typically by the Transportation Planning Council of each metropolitan area. The PT survey is synonymous with the travel survey (Bricka Citation2021), which informs an understanding of “who is traveling, for what purpose, from where to where, at what time of the day, and by what means of transportation,” and is used to elucidate the current status of urban transportation, forecast future transportation demand, and create urban transportation master plans (Ministry of Land, Infrastructure, Transport and Tourism Citation2021b). Invitations to participate in PT surveys are distributed to households in Japan by mail, and respondents are asked to complete a paper survey form. Respondents provide their sex, age, occupation, and place of residence, and for a specified 24-hour period on a specified day, they indicate their address of departure, time of departure, address of arrival, time of arrival, purpose of travel, and mode of transportation.
summarizes the PT survey data used in this analysis, which consisted of weekday data from the 2008 Tokyo, 2011 Chukyo, and 2010 Kinki metropolitan area PT surveys. The “number of total person trips” in is the total number of person trips undertaken in a single day: 587,434 for the Tokyo metropolitan area, 200,916 for the Chukyo metropolitan area, and 808,794 for the Kinki metropolitan area. Since these PT surveys examined travel behavior over the full course of a single day, the survey data include stopover shopping behavior such as a route from home to work, from work to a shopping location, and from a shopping location to home. In order to analyze only the shopping behaviors consisting of pure travel time to and stay time at the destination and exclude other travel purposes, this study targeted behaviors following a direct route from home to a shopping destination and from a shopping destination to home. If stopover shopping behavior was included in the study data, the primary purpose of the travel behavior, such as going to work, would be mixed in with secondary shopping behavior, making it difficult to analyze the latter alone. Furthermore, as PT surveys do not capture travel priorities, the primary purpose of travel behavior can only be determined for direct trips, such as those from home to a shopping destination as considered in this study.
Table 1. Summary of survey data.
To focus on these target data, a program written in Microsoft Excel using Visual Basic for Applications extracted all person trips for which the starting coordinate was home and the purpose of travel was shopping, and the purpose of travel was returning home after staying at the shopping destination for more than one minute. After this data extraction, the target data set included 61,337, 11498, and 11,773 person trips in the Tokyo, Chukyo, and Kinki metropolitan areas, respectively. The travel times, travel distances, and time spent at the destinations were calculated from the survey data, and the corresponding age, gender, occupation, means of transportation, and departure time were extracted. Note that as the type and size of the establishments where the shopping behavior took place were not included in the survey data, the considered shopping destinations included all types of commercial establishments from small retail stores to large shopping malls. Therefore, the widest possible picture of shopping behavior was obtained in this study by considering all survey responses listing the purpose of travel as “shopping” in the analysis.
3.3. Analysis methods
In this study, shopping behavior was analyzed according to metropolitan area, pattern, and stay coefficient.
Shopping behavior according to metropolitan area
The shopping behavior in each metropolitan area was classified based on aggregate data. A chi-square test was conducted on the extracted data describing person attributes and shopping behavior and the results were analyzed for significant differences between metropolitan areas. Furthermore, the overall trend of the extracted data was ascertained based on the aggregate graphs. Next, the distributions of travel time, length of stay, and ratio of stay time to travel time were obtained and subjected to the Kruskal – Wallis test to determine whether significant differences were found among their relationships.
(2) Shopping behavior patterns
A cluster analysis was used to analyze shopping behavior patterns in each metropolitan area by classifying objects into groups characterized by similar values within a set of variables (Vandeginste et al. Citation1998). The cluster analysis conducted in this study used a nonhierarchical k-means method to classify patterns for each metropolitan area using departure time, travel time, and stay time as variables. After evaluating the use of three to five typological clusters, four clusters were applied to explain the shopping behavior patterns in each metropolitan area as this resulted in a significance of p < 0.05 for all variables.
(3) Stay coefficient
If either travel time or stay time can be derived from the other, a facility manager can establish the travel time (visitor’s sphere) by assuming or investigating the user’s stay time at the location where the shopping activity takes place. Conversely, if the travel time is estimated or surveyed at the location where the shopping activity takes place, the visitor stay time at that location can be determined. Thus, the relationship between travel time and stay time was analyzed using a regression analysis to obtain the stay coefficient.
Figure 1. Analysis target areas.
4. Results
4.1. Shopping behavior according to metropolitan area
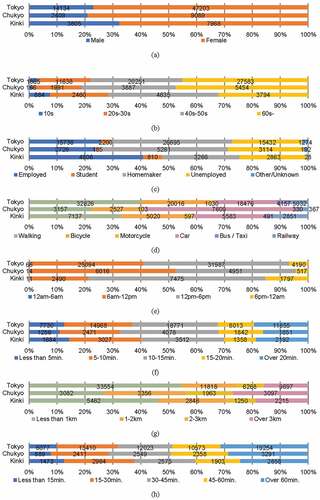
The extracted shopping behavior data are summarized in . When subjected to the chi-square test, these summary distributions all exhibited p < 0.001, indicating that significant differences in shopping behavior existed among the three metropolitan areas. However, several overall trends were common to all metropolitan areas: sex was dominated by “female” shoppers (), there were many “40s–50s” and “60s or older” shoppers (), and the proportions of “Employed,” “Homemaker,” and “Unemployed” were consistently high (). These results reflect the fact that the survey data captured weekday shopping activity consisting of round trips from home, as well as differences in the employment rates of males, females, and different age groups. The means of transportation reflects the forms of transit used along each travel route and includes multiple responses (); the distributions of transportation forms differed according to metropolitan area, possibly reflecting the fact that the Tokyo metropolitan area has a higher population density and more public transportation options than the other areas. The departure times were mostly during the daytime (), and approximately 70% of travel times were less than 15 min in all metropolitan areas (). The travel distance in the Chukyo metropolitan area tended to be shorter than those in the other areas (). Finally, each stay time range accounted for 10% to 30% of the overall distribution ().
Figure 2. Aggregations of extracted shopping behaviors when undertaking shopping trips according to metropolitan area in terms of: (a) Sex, (b) Age, (c) Occupation, (d) Means of transportation (multiple responses allowed), (e) Departure time, (f) travel time (one-way average), (g) Travel distance (one-way average and straight-line distance calculated by coordinate), and (h) Stay time.
Next, the distributions of travel time, stay time, and the ratio of stay time to travel time were obtained to determine the relationship between travel time and stay time, with the results shown in . A large percentage of travel times were in the range of 5–10 min (), and most respondents stayed for 20–30 min (); the stay time to travel time ratios were mostly in the 1–2 and 2–3 ranges (); and all three figures exhibit a similarly shaped log-normal distribution of data. The Kruskal – Wallis test was conducted on the data in to compare the medians of three or more groups that do not follow a normal distribution; no significant difference was found among the metropolitan areas (p > 0.05). shows the distributions of travel and stay times; note that as the travel time or stay time increases, the other tends to increase as well.
Figure 3. Aspects of undertaken shopping trips according to metropolitan area: (a) Distribution of travel time, (b) Distribution of stay time, and (c) Distribution of stay time/travel time ratio.
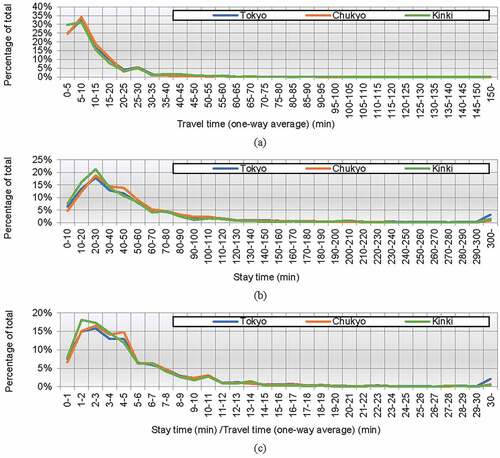
Figure 4. Distributions of travel and stay times on a natural log scale in the (a) Tokyo, (b) Chukyo, and (c) Kinki metropolitan areas. Note that transparency is assigned to each point according to data concentration, with darker points indicating a larger quantity of data.
4.2. Shopping behavior patterns
Shopping behavior patterns were defined using the departure time, travel time, and stay time as variables. Data for the “unknown/other” occupation were excluded from this analysis. All independent variables showed p < 0.001 ( and ). Four clusters were created using a nonhierarchical cluster analysis: “Early departure and home surrounding type,” “Early departure and long trip type,” “Early departure and long stay type,” and “Late departure and home surrounding type.” The naming of these clusters is the same as that applied by Yamada and Hayashida (Citation2020), who analyzed shopping behaviors in a single metropolitan area. The “Early departure and home surrounding type” is characterized by an early departure time, short travel time, and short stay at the destination; the “Early departure and long trip type” is characterized by an early departure time and long travel time to the destination; the “Early departure and long stay type” is characterized by an early departure time, long travel time, and long stay at the destination; and the “Late departure and home surrounding type” is characterized by a late departure time, short travel time, and short stay at the destination. The Tokyo metropolitan area and the Chukyo metropolitan area had many trips in the “Early departure and home surrounding type” and “Late departure and home surrounding type” clusters, but the Kinki metropolitan area had the largest number of trips in the “Late departure and home surrounding type” cluster ().
Figure 5. Shopping behavior pattern clusters in the (a) Tokyo, (b) Chukyo, and (c) Kinki metropolitan areas.
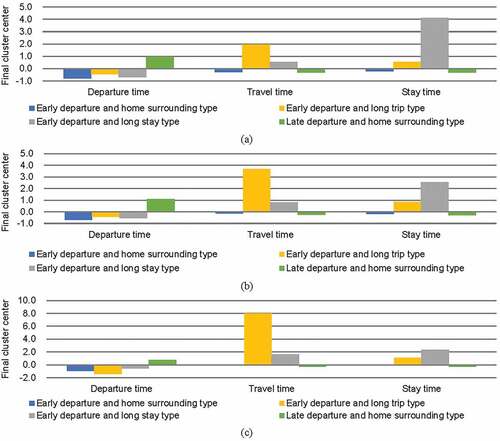
Table 2. Number and percentage of cases in each cluster.
4.3. Stay coefficient
The relationship between the independent and dependent variables was analyzed by a multiple regression analysis using sex, age, occupation, means of transportation, departure time from home, and travel time from home to the destination as independent variables and stay time at the destination as the dependent variable. The travel distance was excluded from the list of independent variables because it can be directly correlated with travel time. Because there is no clear linear relationship between the independent variables and the dependent variable, both travel time and stay time were transformed into logarithms. This logarithmic transformation yielded the rate of change (elasticity) of the stay time in relation to the travel time. Next, sex, age, occupation, means of transportation, and departure time were transformed into dummy variables in the regression analysis. As shown in , all results were above R2 = 0.9, indicating that the obtained correlation had a high degree of accuracy. Urban shopping behavior is thus proposed to have a “stay coefficient” determined by the relationship between the logarithms of travel time and stay time, expressed as a nonstandard regression coefficient (B) given by
Table 3. Relationship between travel time and stay time.
In the case of the three Japanese metropolitan areas analyzed in this study, the average value of B was approximately 1.5 (). Thus, a 1% increase in travel time will result in an approximately 1.5% increase in stay time. For example, when travel time increases from 100 minutes to 101 minutes (+1%), the stay time increases from 150 minutes to 151.5 minutes (+1.5%). This positive relationship between travel time and stay time means that visitors can be attracted from distant areas by facilities warranting a long stay time. However, it is assumed that the value of B will vary depending on the unique social and cultural attributes of a city or nation. Furthermore, because this study focused on the travel time and stay time to analyze their relationship, the resulting model does not account for the type of shopping facility or the type of shopping activity at that facility; reflecting this information in the model would be difficult at this time because it is not collected by the PT survey.
Next, the strengths of the relationships between the independent variables and stay time were determined and expressed in terms of the standard regression coefficient β (). In all metropolitan areas, the β value for travel time was the highest, indicating that changes in travel time had the greatest impact on changes in stay time. The β values for departure time were also consistently high. shows the relationship between travel time and stay time for each shopping behavior pattern. In all metropolitan areas, the B values for the “Early departure and home surrounding type” and “Late departure and home surrounding type” were between 1.4 and 1.5. shows that these two shopping behavior patterns accounted for the majority of trips and thus heavily contributed to the overall stay coefficient. On the other hand, the “Early departure and long trip type” describes people who shop even if it takes a long time to get to their destination, whether because there are no places to shop nearby or because some highly attractive destinations sell items that are not available at nearby stores; hence, the B values for this trip type were all considerably less than 1.5. Notably, the “Early departure and long stay type” exhibited a relatively wide range of B values from 1.4 to 2.0.
Table 4. Relationship between all variables and stay time.
Table 5. Relationship between travel time and stay time according to shopping behavior pattern.
5. Discussion
In this study, the relationship between travel time from home to a shopping destination and the stay time at that shopping destination was analyzed to quantify shopping behavior in three different Japanese metropolitan areas. As a result, the “stay coefficient” was derived to serve as a common index enabling comparison among different cities assuming that the basic characteristic of increasing stay time with increasing travel time is consistent across metropolitan areas. Once the stay coefficient is determined for a particular city, the manager of a commercial facility can calculate the average travel time from a visitor’s home to the facility based on the anticipated stay time, allowing them to determine that facility’s trade area. In addition, local governments and commercial facility advisors can use this information to help businesses ensure that they are planning their facilities appropriately. However, note that the stay coefficient is thought to vary depending on area residents’ perception of travel time as a cost and stay time as a reward rather than on factors such as the road network, public transportation system, or automobile usage. In other words, the value of the stay coefficient will vary depending on the culture and social structure, regional characteristics of shopping behavior, and time spent shopping in a day.
The relevance and usefulness of the stay coefficient can be discussed in relation to existing representative models of shopping behavior. There are two well-known spatial interaction models: Reilly’s (Citation1931) gravity model and Huff’s (Citation1963) potential model. In Reilly’s model, the attraction of a shopping area is proportional to the population of the city and inversely proportional to the square of the travel distance to the shopping area. Huff’s model relies upon the total floor space of the shopping area to serve as an indicator of its attractiveness. Previous studies have suggested that variables related to the attractiveness of a shopping area include not only “travel time” and “total sales floor space,” but also “employees” (Satani et al. Citation1998), “competition and agglomeration” (Li and Liu Citation2012), “brand attraction” (De Beule, Poel, and Weghe Citation2014), and “service” and “facility” quality indexes (Lin et al. Citation2016). Note that the travel time considered in this study corresponds to the travel distance considered in previous studies, and the stay time considered in this study corresponds to the facility attractiveness considered in previous studies. Thus, if the distance to a shopping facility is large, more travel time is required, and if the total floor space (attractiveness) of a shopping area is large, it is assumed that the customers will stay longer. In addition, if the stay time at a shopping destination is considered as a personal choice behavior, it can be incorporated into the explanatory variables of the discrete choice model utility function. The findings of this study indicate that these explanatory variables can be obtained using only the stay time rather than relying on surveys to collect private home addresses and travel times to the facility. Note also that because the stay coefficient is constant within a city, the trade area will change depending only on the amount of time visitors spend at a facility. For example, if a facility is changed to encourage visitors to stay longer without otherwise changing its floor area, the number of visitors from more distant areas will increase. This characteristic has not been discussed in previous studies.
However, there are inherent limitations to the descriptive abilities of analyses conducted using the stay coefficient, namely that the stay coefficient cannot differentiate between a change in the number visitors coming from a distance and a change in the overall number of visitors, which are distinct phenomena. For example, consider the case in which a supermarket is changed to a car dealership while the facility area remains constant. If the stay time is longer at the car dealership than at the supermarket, it will attract users from farther away than the supermarket (as indicated by an increased stay coefficient), but the overall number of users may decrease. The results of this study indicate only that commercial facilities can expect to attract customers from farther away by enhancing their contents and increasing their scale to lengthen visitor stay time; as Hui, Bradlow, and Fader (Citation2009) and Li et al. (Citation2021) have stated, increasing the stay time can be expected to increase the amount of money spent at a facility.
Furthermore, recent studies have investigated how the rapid progress of online shopping has affected shopping behavior in brick-and-mortar stores (Saphores and Xu Citation2021; Shi et al. Citation2019), and it remains necessary to observe the resulting changes in physical shopping behavior. As the data considered in this study were collected from 2008 to 2011, some differences may exist when considering current shopping behavior in the context of the development of online shopping. In addition, the COVID-19 pandemic has affected a number of shopping-related behaviors and attitudes, resulting in increased online shopping (Shaw, Eschenbrenner, and Baier Citation2022), shifting transportation choices (Javadinasr et al. Citation2022), and changes in spatial preferences and usage habits among shopping mall users (Büyükşahin Citation2022); the transformations of these shopping behaviors should be closely monitored even after the threat posed by COVID-19 has passed. Critically, recent research into online shopping has found that “e-shopping has a substitution effect on the frequency of shopping trips” (Shi et al. Citation2019; Le, Carrel, and Shah Citation2022). Comparisons of online versus brick-and-mortar shopping behavior have concluded that: online consumers tend to purchase higher-priced products and products that can be easily chosen on the web as they require less handling or close inspection (Crocco, Eboli, and Mazzulla Citation2013); “while COVID-19 had a significant impact on improving the attractiveness of online shopping, people still prefer to go back to stores for buying the items that need to be touched or visually evaluated” (Adibfar et al. Citation2022); and “people who order groceries online are a small percentage of the population” (Dominici et al. Citation2021; Saphores and Xu Citation2021).
Thus, products that are easily purchased through online shopping are now considered to be less likely to be purchased in physical stores. As a result, the consumer intention when visiting a physical store is to purchase products that cannot be easily selected online and need to be looked at closely; i.e. the shopping intention may be changing to focus on purchases that require a longer stay time in the physical store. In light of the results of the present study, this will lead to longer travel times, i.e. an expansion of the trade area. In addition, even with the development of online shopping, groceries tend to be purchased in physical stores; thus, store operators can expect to attract customers who live close to their stores if they sell groceries and can expect to attract customers from further away if they provide facilities that allow customers to stay longer (e.g. clothes shops, theaters, cafes, restaurants, etc.). However, if online grocery shopping with same-day delivery becomes widespread in the future, it may replace this physical shopping behavior as well (Xi, Cao, and Zhen Citation2020).
Prospects for future research employing the stay coefficient proposed in this study include:
Analysis of the impact of online shopping behavior on the stay coefficient. Because all of the survey data considered in this study described shopping behavior in physical stores, it is likely that a similar survey conducted today would include less data describing shopping behaviors for products that are now likely to be purchased online. How current and future shopping behaviors will affect the stay coefficient proposed in this study should therefore be clarified in future research. Although this study did not undertake a comparison of online and physical store shopping behaviors, its findings remain valuable for the development of physical stores. Indeed, in the context of modern shopping behavior, the perspective adopted in this study can enable businesses to maintain and attract customers to brick-and-mortar stores even as online shopping becomes more prevalent. In addition, efforts to incorporate online shopping into shopping behavior models are under active development (Suel and Polak Citation2018); thus, shopping behavior models that simultaneously consider both physical and online stores are likely imminent. In the future, the results of this study should therefore be connected to the studies in this discussion to better inform commercial facility planning.
Analysis across many different metropolitan areas. As travel surveys have been conducted in metropolitan areas beyond Japan, future stay coefficient analyses are planned using the proposed approach in other metropolitan areas. Furthermore, since the stay coefficient is likely to vary depending on personal preferences, the type of shopping facilities in an urban area, and cultural characteristics, it remains necessary to further analyze the relationship between travel time and stay time in more detail by accounting for these factors.
Based on the results of this study, the following policy recommendations are provided for local governments and other policy makers to support retail development:
Improve public transportation and provide adequate parking capacity in the vicinity of shopping facilities. If the stay time at the store cannot be changed, improving access from the visitor’s home to the store will reduce travel time and attract visitors from further away.
Develop commercial facility communities within the same district. Even if the visitor stay time at a single store is short, the presence of multiple stores nearby will increase the stay time within the district, thereby attracting customers from further away. Thus, the relationship between the stay time and travel time is not only useful for specific shopping facilities, but also for the development of entire districts as shopping destinations.
6. Conclusions
This study evaluated shopping behaviors using travel survey data from three metropolitan areas in Japan to identify common indicators and obtain knowledge that can be applied in other cities. First, data were extracted that described round-trip behavior between home and shopping locations in the three metropolitan areas. Then, significant differences in shopping behaviors among the metropolitan areas were confirmed, though the travel time and stay time were both log-normally distributed in all three. Next, four shopping behavior patterns common among the considered metropolitan areas were identified. The “stay coefficient,” which reflects the relationship between the travel time and stay time, was then defined. The value of this coefficient was similar in all three considered metropolitan areas: an overall increase of 1% in travel time to a shopping destination increased the time spent at that shopping destination by approximately 1.5%. Next, the stay coefficient trend was investigated in further detail by analyzing each identified shopping behavior pattern. Based on these characteristics, a useful method for describing actual shopping behavior in cities and analyzing the trade area during commercial facility planning was obtained. This study therefore helps inform the analysis approaches of urban policy makers in local governments, commercial store operators in marketing, and other researchers and practitioners interested in geospatial and shopping behaviors or general human behavioral characteristics.
Acknowledgements
This research was the result of the joint research with the Center for Spatial Information Science (CSIS) of the University of Tokyo (project number 690) and used the following data: People Flow 2008 Tokyo Metropolitan Area (spatially reallocated), People Flow 2011 Nagoya Metropolitan Area (spatially reallocated), and People Flow 2010 Kinki Metropolitan Area (spatially reallocated).
Disclosure statement
No potential conflict of interest was reported by the author(s).
Data availability statement
The data that support the findings of this study are available from the CSIS of the University of Tokyo, but restrictions apply to the availability of these data, which were used under license for the current study and are not publicly available. Data are however available from the author upon reasonable request and with permission of CSIS.
Additional information
Funding
Notes on contributors
Takashi Yamada
Takashi Yamada received the PhD degree from Keio University, Japan. His research interests are human behavior modeling, simulation, and space design analysis in buildings and urban spaces.
References
- Adibfar, A., S. Gulhare, S. Srinivasan, and A. Costin. 2022. “Analysis and Modeling of Changes in Online Shopping Behavior Due to COVID-19 Pandemic: A Florida Case Study.” Transport Policy 126: 162–176. doi:10.1016/j.tranpol.2022.07.003.
- Bricka, S. G. 2021. “Travel Surveys.” International Encyclopedia of Transportation 587–589. doi:10.1016/B978-0-08-102671-7.10387-2.
- Büyükşahin, S. 2022. “Effects of COVID-19 Pandemic on Spatial Preferences and Usage Habits of Users in Shopping Malls and Its Relation with Circulation Layout.” Ain Shams Engineering Journal 101838. doi:10.1016/j.asej.2022.101838.
- Crocco, F., L. Eboli, and G. Mazzulla. 2013. “Individual Attitudes and Shopping Mode Characteristics Affecting the Use of E-Shopping and Related Travel.” Transport and Telecommunication 14 (1): 45–56. doi:10.2478/ttj-2013-0006.
- Daisy, N. S., L. Liu, and H. Millward. 2020. “Trip Chaining Propensity and Tour Mode Choice of Out-Of-Home Workers: Evidence from a Mid-Sized Canadian City.” Transportation 47 (2): 763–792. doi:10.1007/s11116-018-9915-2.
- Daisy, N. S., H. Millward, and L. Liu. 2020. “Modeling Activity-Travel Behavior of Non-Workers Grouped by Their Daily Activity Patterns.” Mapping the Travel Behavior Genome 339–370. doi:10.1016/B978-0-12-817340-4.00018-8.
- De Beule, M., D. V. Poel, and N. V. Weghe. 2014. “An Extended Huff-Model for Robustly Benchmarking and Predicting Retail Network Performance.” Applied Geography 46: 80–89. doi:10.1016/j.apgeog.2013.09.026.
- De Pascale, A., M. Meleddu, and T. Abbate. 2021. “Exploring the Propensity to Travel of People with Disabilities: A Literature Review.” SSRN Electronic Journal 3832082. doi:10.2139/ssrn.3832082.
- Dominici, A., F. Boncinelli, F. Gerini, and E. Marone. 2021. “Determinants of Online Food Purchasing: The Impact of Socio-Demographic and Situational Factors.” Journal of Retailing and Consumer Services 60: 102473. doi:10.1016/j.jretconser.2021.102473.
- Garrett, M.2014. Encyclopedia of Transportation: Social Science and Policy. Los Angeles, CA: SAGE Publications. doi:10.4135/9781483346526.
- Hafezi, M. H., N. S. Daisy, H. Millward, and L. Liu. 2021. “Ensemble Learning Activity Scheduler for Activity Based Travel Demand Models.” Transportation Research Part C: Emerging Technologies 123: 102972. doi:10.1016/j.trc.2021.102972.
- Hafezi, M. H., H. Millward, and L. Liu. 2018. “Activity-Based Travel Demand Modeling: Progress and Possibilities.” In International Conference on Transportation and Development 2018, 138–147. Pittsburgh, PA: American Society of Civil Engineers, July 15–18. doi:10.1061/9780784481561.014.
- Huff, D. L. 1963. “A Probabilistic Analysis of Shopping Center Trade Areas.” Land Economics 39 (1): 81–90. doi:10.2307/3144521.
- Hui, S. K., E. T. Bradlow, and P. S. Fader. 2009. “Testing Behavioral Hypotheses Using an Integrated Model of Grocery Store Shopping Path and Purchase Behavior.” The Journal of Consumer Research 36 (3): 478–493. doi:10.1086/599046.
- Javadinasr, M., T. Maggasy, M. Mohammadi, K. Mohammadain, E. Rahimi, D. Salon, M. W. Conway, R. Pendyala, and S. Derrible. 2022. “The Long-Term Effects of COVID-19 on Travel Behavior in the United States: A Panel Study on Work from Home, Mode Choice, Online Shopping, and Air Travel.” Transportation Research Part F, Traffic Psychology and Behaviour 90: 466–484. doi:10.1016/j.trf.2022.09.019.
- Jing, P., M. Zhao, M. He, and L. Chen. 2018. “Travel Mode and Travel Route Choice Behavior Based on Random Regret Minimization: A Systematic Review.” Sustainability 10 (4): 1185. doi:10.3390/su10041185.
- Kagawa, K. 1972. “Location and Trading Areas of Department Stores and Supermarkets in the City of Hiroshima.” Geographical Sciences 17: 1–12. doi:10.20630/chirikagaku.17.0_1.
- Lau, S. W. 1995. Truck Travel Surveys: A Review of the Literature and State-Of-The-Art. California: Metropolitan Transportation Commission. doi:10.21949/1404642.
- Le, H. T. K., A. L. Carrel, and H. Shah. 2022. “Impacts of Online Shopping on Travel Demand: A Systematic Review.” Transport Reviews 42 (3): 273–295. doi:10.1080/01441647.2021.1961917.
- Li, X., W. D. Dahana, Q. Ye, L. Peng, and J. Zhou. 2021. “How Does Shopping Duration Evolve and Influence Buying Behavior? The Role of Marketing and Shopping Environment.” Journal of Retailing and Consumer Services 62: 102607. doi:10.1016/j.jretconser.2021.102607.
- Li, Y., and L. Liu. 2012. “Assessing the Impact of Retail Location on Store Performance: A Comparison of Wal-Mart and Kmart Stores in Cincinnati.” Applied Geography 32 (2): 591–600. doi:10.1016/j.apgeog.2011.07.006.
- Lin, T., J. Xia, T. P. Robinson, D. Olaru, B. Smith, J. Taplin, and B. Cao. 2016. “Enhanced Huff Model for Estimating Park and Ride (PnR) Catchment Areas in Perth, WA.” Journal of Transport Geography 54: 336–348. doi:10.1016/j.jtrangeo.2016.06.011.
- Lundevaller, E. H. 2009. “The Effect of Travel Cost on Frequencies of Shopping and Recreational Trips in Sweden.” Journal of Transport Geography 17 (3): 208–215. doi:10.1016/j.jtrangeo.2008.05.002.
- McCarthy, L., A. Delbosc, G. Currie, and A. Molloy. 2017. “Factors Influencing Travel Mode Choice Among Families with Young Children (Aged 0–4): A Review of the Literature.” Transport Reviews 37 (6): 767–781. doi:10.1080/01441647.2017.1354942.
- Meena, S., G. R. Patil, and A. Mondal. 2019. “Understanding Mode Choice Decisions for Shopping Mall Trips in Metro Cities of Developing Countries.” Transportation Research Part F, Traffic Psychology and Behaviour 64: 133–146. doi:10.1016/j.trf.2019.05.002.
- Merom, D., H. P. Ploeg, G. Corpuz, and A. E. Bauman. 2010. “Public Health Perspectives on Household Travel Surveys.” American Journal of Preventive Medicine 39 (2): 113–121. doi:10.1016/j.amepre.2010.04.007.
- Millward, H., M. H. Hafezi, and N. S. Daisy. 2019. “Activity Travel of Population Segments Grouped by Daily Time-Use: GPS Tracking in Halifax, Canada.” Travel Behaviour and Society 16: 161–170. doi:10.1016/j.tbs.2019.05.005.
- Ministry of Land, Infrastructure, Transport and Tourism. 2021a. “Promotion of Urban Renovation and Compact Cities.” Accessed October 15 2022. https://www.mlit.go.jp/en/toshi/index.html
- Ministry of Land, Infrastructure, Transport and Tourism. 2021b. “Urban Transport Surveys and Urban Planning Surveys: Person Trip Surveys.” Accessed October 15 2022. https://www.mlit.go.jp/toshi/tosiko/toshi_tosiko_tk_000031.html
- Nielsen, T. A. S., I. Mulalic, and H. Christiansen. 2016. “Drivers of Cycling Mode-Share: Analysis of Danes Travel Behavior 1996–2013.” Transportation Research Procedia 14: 2284–2288. doi:10.1016/j.trpro.2016.05.244.
- Oh, S., Y. Byon, K. Jang, and H. Yeo. 2018. “Short-Term Travel-Time Prediction on Highway: A Review on Model-Based Approach.” KSCE Journal of Civil Engineering 22 (1): 298–310. doi:10.1007/s12205-017-0535-8.
- Okada, K., K. Yoshida, and S. Kashihara. 1970. “Time Study on Users of Urban Facilities (Part 7).” Transactions of the Architectural Institute of Japan 170: 71–77. doi:10.3130/aijsaxx.170.0_71.
- Omer, M., H. Kim, K. Sasaki, and K. Nishii. 2010. “A Tour-Based Travel Demand Model Using Person Trip Data and Its Application to Advanced Policies.” KSCE Journal of Civil Engineering 14 (2): 221–230. doi:10.1007/s12205-010-0221-6.
- Rasouli, S., and H. Timmermans. 2014. “Activity-Based Models of Travel Demand: Promises, Progress and Prospects.” International Journal of Urban Sciences 18 (1): 31–60. doi:10.1080/12265934.2013.835118.
- Reilly, W. J. 1931. The Law of Retail Gravitation. New York: Knickerbocker Press.
- Sakai, K. 2007. “Household Travel Surveys and Utilization of Travel Behavior Data in Abroad.” Journal of the City Planning Institute of Japan 42 (3): 559–564. doi:10.11361/journalcpij.42.3.559.
- Salon, D., and E. M. Aligula. 2012. “Urban Travel in Nairobi, Kenya: Analysis, Insights, and Opportunities.” Journal of Transport Geography 22: 65–76. doi:10.1016/j.jtrangeo.2011.11.019.
- Saphores, J., and L. Xu. 2021. “E-Shopping Changes and the State of E-Grocery Shopping in the US - Evidence from National Travel and Time Use Surveys.” Research in Transportation Economics 87: 100864. doi:10.1016/j.retrec.2020.100864.
- Satani, N., A. Uchida, A. Deguchi, A. Ohgai, S. Sato, and S. Hagishima. 1998. “Commercial Facility Location Model Using Multiple Regression Analysis.” Computers, Environment and Urban Systems 22 (3): 219–240. doi:10.1016/S0198-9715(98)00048-9.
- Schwanen, T. 2004. “The Determinants of Shopping Duration on Workdays in the Netherlands.” Journal of Transport Geography 12 (1): 35–48. doi:10.1016/S0966-6923(03)00023-1.
- Shaw, N., B. Eschenbrenner, and D. Baier. 2022. “Online Shopping Continuance After COVID-19: A Comparison of Canada, Germany and the United States.” Journal of Retailing and Consumer Services 69: 103100. doi:10.1016/j.jretconser.2022.103100.
- Shimazaki, Y., Y. Sekimoto, R. Shibasaki, and Y. Akiyama. 2009. “A Study on the Correlation Between the Number of Stores and the Time Slot Population Based on Person Flow: The Comparative Analysis Between the Time and Space Interpolated Person Trip Survey Data and the Census Data.” Journal of the City Planning Institute of Japan 44 (3): 781–786. doi:10.11361/journalcpij.44.3.781.
- Shirgaokar, M., B. Dobbs, L. Anderson, and E. Hussey. 2020. “Do Rural Older Adults Take Fewer Trips Than Their Urban Counterparts for Lack of a Ride?” Journal of Transport Geography 87: 102819. doi:10.1016/j.jtrangeo.2020.102819.
- Shi, K., J. D. Vos, Y. Yang, and F. Witlox. 2019. “Does E-Shopping Replace Shopping Trips? Empirical Evidence from Chengdu, China.” Transportation Research Part A: Policy and Practice 122: 21–33. doi:10.1016/j.tra.2019.01.027.
- Suel, E., and J. W. Polak. 2018. “Incorporating Online Shopping into Travel Demand Modelling: Challenges, Progress, and Opportunities.” Transport Reviews 38 (5): 576–601. doi:10.1080/01441647.2017.1381864.
- Suzuki, Y., K. Kimura, S. Hino, and T. Minamide. 2012. “Analysis on Walkers Behavior in Down Town and Consciousness to Resting Space.” Journal of Japan Society of Civil Engineers, Series D3 (Infrastructure Planning and Management) 68 (5): I_417–I_426. doi:10.2208/jscejipm.68.I_417.
- Taniguchi, A., H. Sasaki, and A. Sasaki. 2018. “Relationship Between Travel Behavior and Body Mass Index – Analysis on Japanese Nationwide Person Trip Survey in 2015.” Journal of Transport & Health 9: S51–S52. doi:10.1016/j.jth.2018.05.037.
- Toole-Holt, L., S. E. Polzin, and , and R. M. Pendyala. 2005. “Two Minutes per Person per Day Each Year: Exploration of Growth in Travel Time Expenditures.” Transportation Research Record 1 1917 (1): 45–53. doi:10.1177/0361198105191700106.
- Vandeginste, B. G. M., D. L. Massart, L. M. C. Buydens, S. D. Jong, P. J. Lewi, and J. Smeyers-Verbeke. 1998. “Cluster Analysis.” Data Handling in Science and Technology 20: 57–86. doi:10.1016/S0922-3487(98)80040-3.
- Verma, A., M. Verma, T. M. Rahul, S. Khurana, and A. Rai. 2018. “Acceptable Trip Distance for Walking in Mass Religious Gatherings—A Case Study of World’s Largest Human Gathering Kumbh Mela in Ujjain, India.” Sustainable Cities and Society 41: 505–512. doi:10.1016/j.scs.2018.06.010.
- Wang, D., and M. Zhou. 2017. “The Built Environment and Travel Behavior in Urban China: A Literature Review.” Transportation Research Part D: Transport and Environment 52: 574–585. doi:10.1016/j.trd.2016.10.031.
- Wesolowski, A., G. Stresman, N. Eagle, J. Stevenson, C. Owaga, E. Marube, T. Bousema, C. Drakeley, J. Cox, and C. O. Buckee. 2014. “Quantifying Travel Behavior for Infectious Disease Research: A Comparison of Data from Surveys and Mobile Phones.” Scientific Reports 4 (1): 5678. doi:10.1038/srep05678.
- Xi, G., X. Cao, and F. Zhen. 2020. “The Impacts of Same Day Delivery Online Shopping on Local Store Shopping in Nanjing, China.” Transportation Research Part A: Policy and Practice 136: 35–47. doi:10.1016/j.tra.2020.03.030.
- Yamada, T., and T. Hayashida. 2020. “Analysis of Shopping Behavior Characteristics in the Keihanshin Metropolitan Area in Japan Based on a Person Trip Survey.” Geo-Spatial Information Science 23 (4): 305–315. doi:10.1080/10095020.2020.1845984.
- Zhang, L., F. Southworth, C. Xiong, and A. Sonnenberg. 2012. “Methodological Options and Data Sources for the Development of Long-Distance Passenger Travel Demand Models: A Comprehensive Review.” Transport Reviews 32 (4): 399–433. doi:10.1080/01441647.2012.688174.