
 ?Mathematical formulae have been encoded as MathML and are displayed in this HTML version using MathJax in order to improve their display. Uncheck the box to turn MathJax off. This feature requires Javascript. Click on a formula to zoom.
ABSTRACT
Human mobility survey data usually suffer from a lack of resources for validation. Epidemiological survey records, which are released to the public as a containment measure by local authorities, provide place visitation details validated by the authority. This study collected and analyzed the epidemiological survey reports published by local governments in the Chinese mainland, between January 2020 and November 2021. To reveal the mobility patterns during the COVID-19 pandemic across the urban-rural gradient in China’s mainland, we derived key mobility indicators from the epidemiological survey data from rural to megacities. We then applied exploratory factor analysis to identify latent factors that affected people’s mobility. We found that the pandemic poses varying impacts across the urban-rural gradient in the Chinese mainland, and the mobility patterns of middle and small cities are more influenced. Our results also showed that the pandemic did not enlarge gender gap in people’s mobility, as gender was not a significant driving factor for explaining people’s quantity of out-of-home activities as well as extent of life space, while age group and city levels were significant. Overall, we argue that the epidemiological survey data are valuable data sources for daily mobility modeling, especially for relevant studies to understand human mobility patterns during the pandemic.
1. Introduction
Human mobility is about human beings’ movement, as individuals or groups, with multiple resolutions in space and time ranging from daily activities to migration (Barbosa et al. Citation2018). Daily mobility, in general, refers to an individual’s daily out-of-home activities in space and has been used as a proxy in health-related studies before the COVID-19 pandemic (Fillekes et al. Citation2019a). Since the outbreak of the pandemic, understanding daily mobility has been even more critical due to the contagious nature of the disease because mobility has been associated with epidemic spread (Sallah et al. Citation2017). More importantly, the implementation of control measures on daily mobility, such as inter-city travel restriction and social distancing, has been proved effective in containing the spread of the virus (Kraemer et al. Citation2020; Lai et al. Citation2020). Human daily mobility also impacts the place visitation and thus the market share of local businesses (Liang et al. Citation2020). During the pandemic, an empirical study has observed that human beings’ daily trips to different types of places unevenly decrease: trips to grocery stores retain more but trips to shopping and leisure lose more (Li et al. Citation2021). Therefore, understanding daily mobility patterns during the pandemic might also contribute to the restoration of local business in the post-pandemic world.
Studies on pre-pandemic daily mobility have shown that daily mobility patterns are complex and are influenced by gender (Zhao and Yu Citation2020), socioeconomic status (Barbosa et al. Citation2021), geographical regions (Shelton, Poorthuis, and Zook Citation2015), countries (Xu et al. Citation2018), etc. Regarding post-pandemic daily mobility, people may have different resilience and take different responses to the socioeconomic impact of the pandemic (Borkowski, Jażdżewska-Gutta, and Szmelter-Jarosz Citation2021). Thus, the impact of the COVID-19 pandemic on human mobility can be heterogeneous in different people across geographic areas and demographic groups. Such impact also depends on the development of the pandemic. Kim and Kwan (Citation2021) reported that the mobility of people in the US experienced a V-shape profile with a sharp decline in the first wave but grew back to pre-pandemic levels during the second wave. Due to restricted control measures for containing COVID-19, the Chinese mainland has avoided further large infection waves since the initial break. Nevertheless, the pandemic may have caused implicit influences to reshape an individual’s daily mobility into a new normal. Therefore, it is worth looking into the current status of individuals’ daily mobility patterns during the pandemic.
However, it is challenging to obtain a snapshot of human daily mobility, especially during the pandemic due to various hygiene measures and domestic or international travel restrictions. To obtain accurate daily trajectories for modeling individuals’ daily mobility, a variety of data sources are widely used, including travel diary surveys (Kwan Citation1999), trajectories from GPS-embedded devices, Call Detail Records (CDRs, Schneider et al. Citation2013) and their combinations (Ta et al. Citation2016). However, no data source is perfect. Travel diary survey has self-report errors regarding the spatial and temporal information (Palmer et al. Citation2013; Fillekes et al. Citation2019b). GPS-based surveys have no direct information about the places visited by the people and typically are limited on a small scale (Wahl et al. Citation2013; Brusilovskiy, Klein, and Salzer Citation2016). A CDRs data set can also have thousands of individuals for an extended period, but they are usually parodic and only take a part of the daily mobility, so indicators with the movement scope aspect may not be derived (Burkhard et al. Citation2017). This situation is similar to trajectories derived from social media data such as geotagged tweets (Osorio-Arjona and García-Palomares Citation2019) and Google Location History (Ruktanonchai et al. Citation2018). During the COVID-19 pandemic, mobile phone data have been used to study population mobility patterns in the city (Romanillos et al. Citation2021), regional (Pan and He Citation2022) or even national (Tokey Citation2021; Christidis, Ciuffo, and Vespe Citation2022; Noi, Rudolph, and Dodge Citation2022) levels. However, mobile phone data also lack detailed spatial information about the place visitation because their spatial resolution is limited by the density of the cellular towers (Willberg et al. Citation2021). For privacy issues, it is usually hard to obtain sociodemographic details of mobile phone users.
The availability of epidemiological survey reports opened up new avenues for studying daily human mobility. For containing the spread of the virus and supporting scientific research, some authorities may publish anonymized human trajectories in which validations on the semantics of the trajectory, such as POI visitation, are conducted, including the Data Science for COVID-19 Competition by the South Korean government (Kim and Lee Citation2020). A typical epidemiological survey report in the Chinese mainland contains the semantic trajectories of an anonymized interviewee up to the past 14 days before being diagonalized as a positive case. Limited demographic information such as age and gender may be available to these interviewees, depending on the local governments. Compared with the traditional travel diary survey, the visitation records in the epidemiological survey are validated by the authorities, which makes it more reliable (Shi et al. Citation2021), even though their spatial-temporal resolution can vary case by case and might not have detailed routes of the movements (Liu et al. Citation2021). The epidemiological survey covers a much larger spatial area and demographic groups than the GPS-based survey. It also has better spatial resolution than CDRs, as the places in the survey are typically Points Of Interest (POIs). Most importantly, due to the time-sensitive nature of understanding the daily mobility during the pandemic in the Chinese mainland, the epidemiological survey is the only publicly accessible secondary source that can potentially cover the whole country and population.
There are 19 commonly used daily mobility indicators for individuals, including number of locations, time on foot, maximum distance from home, etc. These indicators can further be characterized as a combination of six main characteristic aspects: space, time, movement scope, attribute, temporal scale, and statistical property (see details in , Fillekes et al. Citation2019a). Space can be further categorized into counts of spatial events, i.e. number of visited places, spatial extent, and distribution. Time can be further categorized into duration, timing, and temporal distribution. Movement scope consists of stop, move, and the trajectory of the movements. The attribute contains statistics of out-of-home activities, transportation modes, and other semantic attributes such as purpose of trip. Temporal scale is about the degree of aggregation at global, interval, or episodic levels. Statistical property is about if a mobility indicator reflects central tendency, maximum, or variability.
The daily mobility in the Chinese mainland has even more complex patterns influenced by the aforementioned driving factors and even more. People of their working ages have higher daily mobility levels than younger and older adults, as observed in a big city before the pandemic (Yuan, Raubal, and Liu Citation2012). The same study, however, reports no gender gap. The Chinese household registration status, i.e. hukou, is also reported as a factor in daily mobility that local people in urban have higher daily mobility capacity and level than domestic migrants in the same city (Yao and Wang Citation2018). In addition to the gender gap in rural areas, Zhao and Yu (Citation2020) also observe habitant setting as a matter for rural residents that residents in towns have higher daily mobility level than residents in villages. A further study reports that people in rural areas with lower socioeconomic status have a lower daily mobility level (Zhao and Yu Citation2021).
Very few studies have examined the individual daily mobility in the Chinese mainland during the pandemic, even though aggregated daily mobility for the population has been intensively investigated (Tan et al. Citation2021). A qualitative analysis of face-to-face interviews in Kunming, China, shows that older adults have significantly reduced their daily mobility (Liu et al. Citation2021). This paper investigates the daily mobility patterns of people across the Chinese mainland’s urban-rural gradient (from megacities to rural areas) during the pandemic. We employ the epidemiological survey reports published by the Chinese Center for Disease Control and Prevention (CDC) at different administrative levels in the Chinese mainland as the main data source. With this secondary public data source, this study explores the differences in mobility patterns across gender, age group, and the urban and rural gradient using various mobility indicators and latent indicators.
To the best of our knowledge, this is the first study that examines people’s mobility across the urban-rural gradient in China’s mainland during the COVID-19 pandemic. In particular, we use the epidemiological survey data for daily mobility modeling and investigated the situation in the Chinese mainland, where varying demographic (both gender and age) groups’ daily mobility patterns are complicated during the pandemic. We specify three driving factors, namely gender, age, and urban-rural gradient, to explore their influence on daily mobility for Chinese people.
This study tries to answer the two Research Questions (RQ):
RQ1:
What is the minimal comprehensive mobility indicator set to reflect people’s daily mobility?
RQ2:
Whether and to what extent do the mobility patterns of people in the Chinese mainland vary by gender, age, and across the urban-rural gradient?
To answer the proposed research questions, we investigate a novel data source: the time-place-annotated trajectories reported in the epidemiological surveys published by the Chinese mainland’s CDC.
2. Methodology
2.1. Workflow
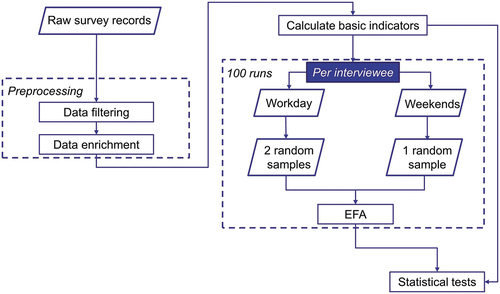
Raw mobility indicators in the workflow of this study, as shown in , are adapted from the following Fillekes et al. (Citation2019a), which suggests a set of basic mobility indicators and uses an Exploratory Factor Analysis (EFA) to find a minimal set of latent mobility indicators synthesized from the basic mobility indicators.
Figure 1. The overall workflow of the study.
2.2. Data collection and preprocessing
To inform all potential close contacts for isolation, China’s local CDCs publish the trajectories of positive cases or selected close contacts to the public. One trajectory record can include the time, place name, and transportation mode of daily trips of an anonymized interviewee. Depending on scenarios, some records can be up to 14 days before the date, when the person is identified as a positive case, although it is not always the case. For urban residents, their homes at the street block level might be included. For rural residents, their homes at the village level might be included. However, these reports are not published on a national platform, and they have no uniform format. Therefore, we had to manually collect the survey reports and extract information from the raw reports. The collected survey reports initially included 614 interviewees spanning from 2020.01.27 to 2021.11.27 over 20 provinces of China. Their spatial distribution is available in .
At the data filtering stage, we aimed to keep interviewees who are local residents of their cities with enough observed dates by removing individuals who are: imported cases from foreign countries, travelers for business trips or inter provinces, interviewees with no home place or fewer than four-day records. In a raw epidemiological survey report, some individuals may have records of staying at medical facilities for the last one to three days, which is a precautious measure for containing the virus spread of people with some symptoms. We removed such records as these activities are not representative of daily behavior.
For data enrichment, place names were geocoded using Baidu Maps Geocoding APIFootnote1 with a manual check. Individuals were further categorized by their age group and habitat settings. We used four age groups: children (0–13 years), young adults (14–26 years), adults (27–59 years), and seniors (>60 years) (Escobar, Cardona, and Hernández-Pulgarín Citation2021). For habitat settings, we firstly categorized the habitat into city and rural. For cities, we reclassified the 5-tier city taxonomy published by the XinYiXianYanJiuSuo (“Research Institute for New Tier One City”) hosted by China’s leading business magazine YicaiFootnote2 into three levels, denoted as Level A, B, C, which is primarily determined by the cities’ demography and economy. Level A cities include Beijing, Dongguan, Guangzhou, etc.; Level B cities include Dalian, Fuzhou, Huizhou, etc.; and Level C cities include Alashan, Dehong, Jilin, etc. A complete list of the categorized cities is available in Appendix Table A1. All non-urban residents were categorized into the rural item in the indicator city level.
After the data filtering and enrichment, there were 272 individuals remaining (), and their spatial distribution is shown in . As we can see, the number of samples is sufficient at the single indicator. However, samples for some indicator combinations such as children in each city level and young adults in Level C cities are underrepresented in the collected data set.
Table 1. Numbers of remaining individuals per city level, age group, and gender.
Table 2. The distribution of the individuals after data filtering.
2.3. Basic mobility indicators
This study selected nine basic mobility indicators () whose calculation can be supported by the epidemiological survey data, adapted from the suggested list in Fillekes et al. (Citation2019a). In addition, we added EntropyOH with the hope of better describing the heterogeneity of place visitation out of home during the pandemic. Since not all interviewees have daily records for a whole week, we randomly sampled two weekday records and one weekend record from an individual’s available records, selected the median value as the representative value of his/her daily mobility indicator, and used this value for future analytics (see more in section 4.4.1), aligning the day selection in the referred study.
Table 3. Description of the computation of the selected basic mobility indicators.
2.4. Analytics
2.4.1. Exploratory factor analysis
Human mobility might be influenced by only a few but complex driven factors whose output might be caught up by various mobility indicators. EFA has been used as a powerful tool for modeling latent factors from observed simple indicators to generate a theory about underneath driven factors. EFA, therefore, was applied to find possible latent factors as a linear combination of the raw indicators that can describe human mobility with rich semantic meaning but fewer indices. The result can be formulated as:
where is the score of the resulted i-th factor,
is the value of the k-th raw indicator, and
is the loading of the k-th raw indicator to the resulting factor. The output of the EFA is expected to answer RQ1.
In particular, we used the minimum residual method as the extraction method with varimax for factor rotation to accomplish the factor analysis using the implementation in psych package in R.
Before the EFA procedure, we also tested if our sample data are suitable for the method by employing Kaiser–Meyer–Olkin (KMO) Measure of Sampling Adequacy and Bartlett’s Test of Sphericity. The tests on the sample resulted in 0.68 for KMO and p < 0.05 for Bartlett’s Test, which suggests that the sample is feasible for the factor analysis. To achieve more robust conclusions, the sampling procedure was repeated 100 times and analytics such as exploratory factor analysis was applied to each sampled set.
2.4.2. Statistical analytics on raw indicators and latent factors
As preliminary tests on normality showed that the values of the raw indicators do not follow a normal distribution, we applied non-parametric tests to explore the difference in the raw indicators regarding the groups by the three driving factors: gender, age, and urban-rural gradient. This was expected as human mobility and socioeconomic indicators typically follow highly skewed distributions. As our observations are not paired, we thus employed the Mann–Whitney U test for two-group comparisons and the Kruskal–Wallis test for multi-group comparisons.
For the latent mobility factors discovered by EFA, we also applied non-parametric comparison tests per demographic and urban-rural gradient groups to check whether these factors differ across social and geographical groups. If we found that not all groups have the same level of mobility factor with the Kruskal–Wallis test, the post hoc Nemenyi test would be applied to pairwise comparisons of the groups to find which pairs actually have the difference. We applied this pipeline to the three essential driving factors and their combinations to explore the cross effects of the demographic and urban-rural gradient factors on the derived latent mobility factors.
3. Results
3.1. Statistical tests of raw indicators per demographic feature and urban-rural gradient
We used statistical tests for an initial understanding of the data. As the Mann–Whitney U test on the comparisons regarding gender shows in , males and females have no obvious difference for most daily mobility indicators. Only indicators related to the overlap of day-by-day activity space, i.e. RevisitedLS and AvgRevisitedLS, are more likely different between males and females.
Table 4. Statistical results (p-value) of the tests on inter-group comparisons of raw indicators per gender, age, and city level.
Age seems as an obvious driver of the diversity of daily mobility. It can be observed that capacity-related indicators, including LengthPerTrip, MaxDist, MeanDist, CHull, and NumLoc, and diversity-related indicator EntropyOH show significant differences across age groups.
The differences also certainly exist in the urban-rural gradient that most mobility indicators achieve significant differences except RevisitedLS and AvgRevisitedLS, in contrast to the results of tests for genders. The test results suggest that residents in different sizes of habitats still have different mobility patterns, most likely caused by the urban-rural gap in transportation infrastructure and socioeconomic status.
In short summary, we observed significant differences in mobility indicators on one or more driving factors. There also might be overlap information provided by the raw mobility indicators, leaving room for further analysis with EFA.
3.2. EFA results
The EFA procedure resulted in three latent factors (). The composition of the latent factors has a very similar pattern as the latent factors in Fillekes et al. (Citation2019a). Therefore, we still used the factor labels in the referred study to summarize the semantics of the discovered factors, namely quantity Out-of-Home (OH) activities, extent of life space, and stability of life space. The factor quantity OH activities in general measures the quantity and diversity of the place visitation. The factor extent of life space is more about the geometry perspective of life space. The factor stability of life space describes how stable the place visitations are. The explored assignments are stable as the raw indicators are almost consistently co-appear in the same group of latent factors in the 100-run repetition ().
Figure 2. EFA summary matrix for the 100 runs of the random day selection. The counts indicate how often each pair of mobility indicators co-appears in a factor. The mobility indicators are organized the same as .
Table 5. Latent factors and their loadings of a randomly selected EFA result for the set of mobility indicators listed in . As the indicator co-appearance in the factors is almost the same for the 100 EFA runs, the selected result does not lose generality.
There are a few notable differences in the latent factor composition from the referred study. Firstly, CHull is assigned to the quantity OH activities factor rather than the extent of life space. Secondly, the Gravelius Compactness of CHull (GravCompact) is assigned to the extent of life space, in the same factor with LengthPerTrip, MaxDist, and MeanDist. In addition, the factor on quantity OH activities contributes more to the overall variance than the extent of life space in this study.
3.3. Statistical test results on EFA outputs
The inter-group comparisons of the mobility latent factors per individual driving factor in show a similar pattern as the observations from the tests on raw mobility indicators. The mobility indicators that now belong to the quantity OH activities factor have no difference for gender but are significantly different across age groups and city levels, which is the same as the pattern of the factor as a comprehensive combination (). Similar observations can be found for the extent of life space factor. The stability of life space factor also has a similar pattern as its member indicators. However, the pattern is the opposite of the other two factors that the stability of life space is significantly different by gender but not by age group and city level. The post hoc one-tail test shows that females have higher stability of life space at a marginal significance (p = 0.054).
Table 6. Results of the statistical tests on inter-group comparisons of EFA latent factors per gender, age, and city level for the randomly selected EFA result.
The post hoc tests show more details about the difference between groups of age and city level to the EFA latent factors. For the quantity OH activities and the extent of life space, age groups 27–59 and 60+ are the two sources that make the inter-group test show a significant difference ().
Figure 3. The result of the post hoc Remenyi test on the EFA latent factors per age group. Items that are significantly different are marked with links, and the significant levels are annotated as *: p < 0.05, **: p < 0.01, ***: p < 0.001.
Participants from Level C cities are significantly different from other city-level groups on quantity OH activities (). This observation is against an intuitive hypothesis that residents in big cities should have higher diversity regarding place visitation as big cities have places with more diverse amenities.
Figure 4. The result of the post hoc Remenyi test on the EFA latent factors per city level. Items that are significantly different are marked with links, and the significant levels are annotated as *: p < 0.05, **: p < 0.01, ***: p < 0.001.
In addition, we observe that residents in Level A cities, Level B cities, and rural areas have no significant difference in terms of the extent of life space. However, people in Level B cities have a relatively lower than the other three. This observation is also against an intuitive guess that residents in larger cities should have a larger extent of life space.
The comparisons between different combinations of the driving factors reveal more detailed differences, as shown in and .
Figure 5. The result of the post hoc Remenyi test on the EFA latent factors among the contributions of gender-age group, gender-city level, and age group-city level. Groups without sufficient samples are not displayed. *: p < 0.05, **: p < 0.01, ***: p < 0.001.
Table 7. Results from inter-group comparison of the EFA for driving factor combinations of gender-age group, gender-city level, and age group-city level.
For the quantity OH activities, age is a strong driving factor when gender – age groups are considered, as a significant inter-group difference can be observed. In particular, the difference is addressed as the gap between females over 60 and males between 27 and 59 (). When gender and urban-rural gradient (city level) are considered, it is observed that the group of males in Level C cities and the group of females in rural areas contribute to the difference in the quantity OH activities (). However, we observe no significant difference between residents of Level C cities and residents of Level A and Level B cities, which suggests such difference is moderated by the relative equality in gender. Residents of Level C who are between 27 and 59 years old have a significant difference from people over 60 who live in Level A, B, and rural areas ().
For the extent of life space, gender is not a concern until age and urban-rural gradient are involved. For the gender – age group combination, it is similar to the quantity OH activities that females over 60 are significantly different from males between 27 and 59 years old (). The difference between Level B and other city levels is contributed by two sources: The first source is the differences between females in Level B cities and males in other three types of urban-rural types as well as females in rural areas (). The second source is the older adults over 60 in Level B cities and adults between 27 and 59 in other areas ().
In short summary, it can be concluded that the significant difference between one city level to others, i.e. Level C for the quantity OH activities and Level B for the extent of life space, is not because of an overall difference that makes every demographic group in such a city level is different from the same demographic group in other cities or rural areas. The difference is mainly because one demographic group is significantly different from another group of people who share totally different demographic settings.
For the stability of life space, even though a general difference is observed between females and males, there, however, is no significant difference observed across the combinations of gender-age or gender-city. This suggests that the gender difference is moderated by the equality among age groups and cities. It may also imply that residents’ daily life in China’s mainland is still stable without much disturbance caused by the pandemic.
4. Discussion
Individuals’ daily mobility is a critical proxy for modeling health, local business, socioeconomic status, and many other associated aspects. These drivers have a compound influence on daily mobility. Therefore, the consequence of the pandemic on individuals’ daily mobility can also be very heterogeneous. However, most studies on mobility during the pandemic still focus on the aggregated mobility of the population.
4.1. Daily mobility modeling
We can answer “RQ1: What is the minimal comprehensive mobility indicator set to reflect people’s daily mobility?” by using the output of the EFA: quantity OH activities, extent of life space, and stability of life space consist of a minimal comprehensive mobility factor set to summarize people’s daily mobility. The three latent factors derived by the EFA have similar components in terms of the raw mobility indicators, thus sharing similar semantic meaning with the result derived from GPS-trajectory-backed mobility indicators in the previous study that we used as the benchmark (Fillekes et al. Citation2019a). This suggests the capacity of generalizing the conceptual framework proposed by Fillekes et al. (Citation2019a) to identify and interpret the latent mobility factors from mobility indicators from a different form of mobility data. At the same time, it also justifies the validity of the mobility indicators derived from the epidemiological survey as a possible source for understanding people’s daily mobility.
The answers to “RQ2: Whether and to what extent do the mobility patterns of people in Chinese mainland vary by gender, age, and across the urban-rural gradient?” are comprehensive. We find that people at working ages (27–59) have higher quantity OH activities and larger extent of life space, but no noticeable gender gap is observed, which is a similar observation as a pre-pandemic study in a big city (Yuan, Raubal, and Liu Citation2012). Our findings, however, extend to more dimensions in mobility and broader geographical regions.
A new finding is that no difference is observed from the perspective of the stability of life space by gender or age, which adds a new understanding of the complex influence of gender and age on daily mobility. This finding contrasts the reported gender gaps observed in daily mobility before and during the pandemic in other parts of the world. It has been noticed that women have reduced daily mobility compared to men in developing countries, as shown in empirical studies from Latin American cities (Olivieri and Fageda Citation2021) and rural areas in China (Zhao and Yu Citation2020). Such a gap still exists in developed countries such as France (Havet, Bayart, and Bonnel Citation2021), Sweden (Frändberg and Vilhelmson Citation2011), and Spain (Miralles-Guasch, Melo, and Marquet Citation2016), even though some cases show the gap is closing over time.
A possible explanation for our moderated gender gap is socioeconomic status, which can also be an influential confounding factor on daily mobility modeling, as discussed in previous studies. Within the same age group for older adults, a better socioeconomic status might mitigate their limited daily mobility level (Boissy et al. Citation2018). Unfortunately, our data source has no explicit information on interviewees’ socioeconomic status. Socioeconomic status is reported not acting as a determinative factor that controversial phenomena are reported. Poor residents are observed traveling shorter distances in their daily life in Brazilian cities (Barbosa et al. Citation2021), Chinese Hong Kong (Tao et al. Citation2020), and some US cities such as Boston (Xu et al. Citation2018). However, poor residents of Singapore cities (Xu et al. Citation2018) and other US cities such as Louisville, Kentucky (Shelton, Poorthuis, and Zook Citation2015) travel longer distances than their richer counterparts. Researchers suggest that the impact of socioeconomic status on daily mobility is also shaped by the layout of local amenities and coverage of the local public transportation system (Barbosa et al. Citation2021). Occupation can be another confounding factor that small business owners and homeworkers can have higher mobility levels than employees (Long and Reuschke Citation2021). Therefore, clarifying whether socioeconomic status is influential to our observation that moderates the gender gap needs further investigation.
It is not surprising to realize that different age groups have different mobility capacities, even within the same gender, as reported in the aforementioned studies on gender gaps. We also observe a similar pattern in our latent factors across some of the gender-age group combinations. It should be aware that besides the general physical conditions, the cognitive status of older adults, such as Alzheimer’s disease and cognitive impairment, can further limit older adults’ daily mobility (Wettstein et al. Citation2014).
Another observation that does not fully agree with previous studies is the influence of urban-rural gradient. In contrast to a monotonic decline from big cities to rural areas as an intuitive hypothesis may have, people with the same demographic profile, i.e. gender and age, have similar mobility capacity in three latent mobility factors. There can be several reasons for this pattern. The development of the pandemic may have a negative impact on people’s decisions for making long-distance trips even within their cities. Virus containment measures such as contact tracking may act as obstacles and reduce people’s willingness to have an extensive life space, even though the measures do not actively suggest people reduce daily out-of-home activities. The rural samples are primarily from provinces in Eastern China, including Jiangsu, Hebei, Henan, and Fujian, where the rural population is dense, and villages are well connected compared to the rural areas in inner-land provinces in the west of China. Therefore, even though the rural residents are observed to have similar mobility patterns as urban residents, it does not necessarily suggest the gap between urban and rural has been demolished all across the country.
4.2. Uncertainties in studying mobility using the epidemiological survey data
Considering the gradual spreading of COVID-19, our samples are included by a procedure similar to snowball sampling (Goodman Citation1961) that is also used in one of the studies on qualitatively examining the influence of COVID-19 on daily mobility (Liu et al. Citation2021). We acknowledge that the sample is not completely randomly sampled from the population, but being included in the epidemiological survey also has some degree of randomness, as being infected by an airborne disease such as the COVID-19 is not fully deterministic. In addition, the “dynamic clearance” virus containment policy in the Chinese mainland determines that when a new case emerges in an area, the local government would quickly take restricted measures, and therefore can potentially affect people’s mobility patterns after the measures were declared. So we have excluded records of individuals under quarantine or in medical facilities. However, some interviewees might decide to go out less after a local COVID-19 wave and change his/her daily mobility behavior, which might introduce some bias. However, given the challenges of collecting people’s mobility during the pandemic, we think the epidemiological survey is still very valuable for us to understand people’s mobility patterns across local and large scales.
There can be other biases in addition to the bias on the geography at the province level, as we briefly mentioned at the end of the previous section. One possible bias source is the survey interviewee’s home location. We excluded samples without a reported home as a preprocessing step because many mobility indicators reply on the home as an anchor point of the life space for calculation. However, reporting an interviewee’s home involves a concern for privacy and evoked a public debate. In the collected data, some local governments decided to include the home address while others did not, which may introduce an extra bias. Time span for data collection is another factor that can introduce bias into the results. Our data span almost 2 years from the initial stage of the development of the pandemic until the pandemic is relatively contained in China’s mainland because of several restricted interferences, including a national-wise lockdown. Therefore, even the same person may have different mobility patterns at different stages of the pandemic in general. Besides the relatively long period, there can be short-term influence from an event, such as the awareness that a burst of new cases is happening. However, these factors are not surveyed and are not modeled in this study.
5. Conclusions and future work
In this study, we collected epidemiological survey records from the Chinese mainland’s rural-urban gradient between January 2020 and November 2021 to examine people’s varying mobility patterns during the pandemic, by gender, age group, and city levels. We further identified key driving factors for explaining the variations in mobility patterns using exploratory factor analysis and also compared our results with previous studies. We found that people’s daily activities are more affected by the pandemic in middle-size and small-size cities as people there have lower mobility capacity in one latent dimension. Contrary to findings from other countries, gender gap was not significant in mobility factors for people in the same age group at the same city level in the Chinese mainland. Further studies may be conducted to investigate if the mobility reduction in these samples is mainly driven by the individuals’ willingness, by the interference from the virus containment measures, or by the different stages of the development of the pandemic in time. With enough representative records, future studies can also separate weekdays and weekends to further examine people’s varying mobility patterns and how the pandemic might have affected the differences. With the rich semantic information about the place visitation in the survey, we can model purposes of travel with validated place visitation sequences. In addition, combining our dataset with existing national-level COVID-19 exposure and timeline information can potentially help us understand more about COVID-19 transmission patterns across urban-rural and demographic gradients (Liu et al. Citation2021). This study demonstrated that epidemiological survey data can be a source for modeling and understanding daily mobility patterns during the pandemic, especially when a survey with probability sampling is not applicable.
Disclosure statement
No potential conflict of interest was reported by the author(s).
Data availability statement
The data that support the findings of this study are available from the corresponding author, upon reasonable request.
Additional information
Funding
Notes on contributors
Feng Zhao
Feng Zhao is an Associate Professor of the Key Laboratory of Geographical Process Analysis & Simulation of Hubei Province in College of Urban and Environmental Sciences, Central China Normal University. Her research interests are vegetation dynamic monitoring and environmental health.
Zixuan Dai
Zixuan Dai is currently studying in College of Urban and Environmental Sciences for her bachelor’s degree in Physical Geography at Central China Normal University. She will pursue her master’s degree in Natural Resources at Wuhan University. Her research interests are human mobility and transportation analysis.
Wenyu Zhang
Wenyu Zhang is currently studying for her bachelor’s degree in Geographical Information Science at College of Urban and Environmental Sciences, Central China Normal University. Her research interests are urban science and smart city.
Yiting Shan
Yiting Shan is currently studying for her bachelor’s degree in Geographical Sciences at College of Urban and Environmental Sciences, Central China Normal University. Her research interests are human mobility.
Cheng Fu
Cheng Fu is a Lecturer of the Department of Geography, University of Zurich. His research interests are place modeling, human mobility, and map generalization.
Notes
References
- Barbosa, H., M. Barthelemy, G. Ghoshal, C. R. James, M. Lenormand, T. Louail, R. Menezes, J. J. Ramasco, F. Simini, and M. Tomasini. 2018. “Human Mobility: Models and Applications.” Physics Reports 734: 1–74. doi:10.1016/j.physrep.2018.01.001.
- Barbosa, H., S. Hazarie, B. Dickinson, A. Bassolas, A. Frank, H. Kautz, A. Sadilek, J. J. Ramasco, and G. Ghoshal. 2021. “Uncovering the Socioeconomic Facets of Human Mobility.” Scientific Reports 11 (1): 1–13. doi:10.1038/s41598-021-87407-4.
- Boissy, P., M. Blamoutier, S. Brière, and C. Duval. 2018. “Quantification of Free-Living Community Mobility in Healthy Older Adults Using Wearable Sensors.” Frontiers in Public Health 6 (August): 1–13. doi:10.3389/fpubh.2018.00216.
- Borkowski, P., M. Jażdżewska-Gutta, and A. Szmelter-Jarosz. 2021. “Lockdowned: Everyday Mobility Changes in Response to COVID-19.” Journal of Transport Geography 90 (May 2020): 102906. doi:10.1016/j.jtrangeo.2020.102906.
- Brusilovskiy, E., L. A. Klein, and M. S. Salzer. 2016. “Using Global Positioning Systems to Study Health-Related Mobility and Participation.” Social Science & Medicine 161: 134–142. doi:10.1016/j.socscimed.2016.06.001.
- Burkhard, O., R. Ahas, E. Saluveer, and R. Weibel. 2017. “Extracting Regular Mobility Patterns from Sparse CDR Data Without a Priori Assumptions Without a Priori Assumptions.” Journal of Location Based Services 9725 (2): 1–20. doi:10.1080/17489725.2017.1333638.
- Christidis, P., B. Ciuffo, and M. Vespe. 2022. “Regional Mobility During the Covid-19 Pandemic: Analysis of Trends and Repercussions Using Mobile Phones Data Across the EU.” Case Studies on Transport Policy 10 (1): 257–268. doi:10.1016/j.cstp.2021.12.007.
- Escobar, D. A., S. Cardona, and G. Hernández-Pulgarín. 2021. “Risky Pedestrian Behaviour and Its Relationship with Road Infrastructure and Age Group: An Observational Analysis.” Safety Science 143 (July): 105418. doi:10.1016/j.ssci.2021.105418.
- Fillekes, M. P., E. Giannouli, E. -K. Kim, W. Zijlstra, and R. Weibel. 2019a. “Towards a Comprehensive Set of GPS-Based Indicators Reflecting the Multidimensional Nature of Daily Mobility for Applications in Health and Aging Research.” International Journal of Health Geographics 18 (1): 1–20. doi:10.1186/s12942-019-0181-0.
- Fillekes, M. P., C. Röcke, M. Katana, and R. Weibel. 2019b. “Self-Reported versus GPS-Derived Indicators of Daily Mobility in a Sample of Healthy Older Adults.” Social Science & Medicine 220 (October 2018): 193–202. doi:10.1016/j.socscimed.2018.11.010.
- Frändberg, L., and B. Vilhelmson. 2011. “More or Less Travel: Personal Mobility Trends in the Swedish Population Focusing Gender and Cohort.” Journal of Transport Geography 19 (6): 1235–1244. doi:10.1016/j.jtrangeo.2011.06.004.
- Goodman, L. 1961. “Snowball Sampling.” The Annals of Mathematical Statistics 32 (1): 148–170. doi:10.1214/aoms/1177705148.
- Havet, N., C. Bayart, and P. Bonnel. 2021. “Why Do Gender Differences in Daily Mobility Behaviours Persist Among Workers?” Transportation Research Part A: Policy and Practice 145 (June 2020): 34–48. doi:10.1016/j.tra.2020.12.016.
- Kim, J., and M. P. Kwan. 2021. “The Impact of the COVID-19 Pandemic on People’s Mobility: A Longitudinal Study of the U.S. from March to September of 2020.” Journal of Transport Geography 93 (March): 103039. doi:10.1016/j.jtrangeo.2021.103039.
- Kim, J., and J. Lee. 2020. “Data Science for COVID-19 (DS4C) [online].” https://github.com/ThisIsIsaac/Data-Science-for-COVID-19
- Kraemer, M. U. G., C. H. Yang, B. Gutierrez, C. H. Wu, B. Klein, D. M. Pigott, L. du Plessis, et al. 2020. “The Effect of Human Mobility and Control Measures on the COVID-19 Epidemic in China.” Science 368 (6490): 493–497. doi:10.1126/science.abb4218.
- Kwan, M. -P. 1999. “Gender, the Home-Work Link, and Space-Time Patterns of Nonemployment Activities.” Economic Geography 75 (4): 370–394. doi:10.2307/144477.
- Lai, S., N. W. Ruktanonchai, L. Zhou, O. Prosper, W. Luo, J. R. Floyd, A. Wesolowski, et al. 2020. “Effect of Non-Pharmaceutical Interventions to Contain COVID-19 in China.” Nature 585 (7825): 410–413. doi:10.1038/s41586-020-2293-x.
- Liang, Y., S. Gao, Y. Cai, N. Z. Foutz, and L. Wu. 2020. “Calibrating the Dynamic Huff Model for Business Analysis Using Location Big Data.” Transactions in GIS 24 (3): 681–703. doi:10.1111/tgis.12624.
- Liu, Q., Y. Liu, C. Zhang, Z. An, and P. Zhao. 2021. “Elderly Mobility During the COVID-19 Pandemic: A Qualitative Exploration in Kunming, China.” Journal of Transport Geography 96 (December 2020): 103176. doi:10.1016/j.jtrangeo.2021.103176.
- Li, A., P. Zhao, H. Haitao, A. Mansourian, and K. W. Axhausen. 2021. “How Did Micro-Mobility Change in Response to COVID-19 Pandemic? A Case Study Based on Spatial-Temporal-Semantic Analytics.” Computers, Environment and Urban Systems 90 (January): 101703. doi:10.1016/j.compenvurbsys.2021.101703.
- Long, J., and D. Reuschke. 2021. “Daily Mobility Patterns of Small Business Owners and Homeworkers in Post-Industrial Cities.” Computers, Environment and Urban Systems 85 (November 2020): 101564. doi:10.1016/j.compenvurbsys.2020.101564.
- Miralles-Guasch, C., M. M. Melo, and O. Marquet. 2016. “A Gender Analysis of Everyday Mobility in Urban and Rural Territories: From Challenges to Sustainability.” Gender, Place & Culture 23 (3): 398–417. doi:10.1080/0966369X.2015.1013448.
- Noi, E., A. Rudolph, and S. Dodge. 2022. “Assessing COVID-Induced Changes in Spatiotemporal Structure of Mobility in the United States in 2020: A Multi-Source Analytical Framework.” International Journal of Geographical Information Science : IJGIS 36 (3): 585–616. doi:10.1080/13658816.2021.2005796.
- Olivieri, C., and X. Fageda. 2021. “Urban Mobility with a Focus on Gender: The Case of a Middle-Income Latin American City.” Journal of Transport Geography 91 (February): 102996. doi:10.1016/j.jtrangeo.2021.102996.
- Osorio-Arjona, J., and J. C. García-Palomares. 2019. “Social Media and Urban Mobility: Using Twitter to Calculate Home-Work Travel Matrices.” Cities 89 (March): 268–280. doi:10.1016/j.cities.2019.03.006.
- Palmer, J. R. B., T. J. Espenshade, F. Bartumeus, C. Y. Chung, N. E. Ozgencil, and K. Li. 2013. “New Approaches to Human Mobility: Using Mobile Phones for Demographic Research.” Demography 50 (3): 1105–1128. doi:10.1007/s13524-012-0175-z.
- Pan, Y., and S. Y. He. 2022. “Analyzing COVID-19’s Impact on the Travel Mobility of Various Social Groups in China’s Greater Bay Area via Mobile Phone Big Data.” Transportation Research Part A: Policy and Practice 159: 263–281. doi:10.1016/j.tra.2022.03.015.
- Romanillos, G., J. C. García-Palomares, B. Moya-Gómez, J. Gutiérrez, J. Torres, M. López, O. G. Cantú-Ros, and R. Herranz. 2021. “The City Turned Off: Urban Dynamics During the COVID-19 Pandemic Based on Mobile Phone Data.” Applied Geography 134: 102524. doi:10.1016/j.apgeog.2021.102524.
- Ruktanonchai, N. W., C. W. Ruktanonchai, J. R. Floyd, and A. J. Tatem. 2018. “Using Google Location History Data to Quantify Fine-Scale Human Mobility.” International Journal of Health Geographics 17 (1): 1–13. doi:10.1186/s12942-018-0150-z.
- Sallah, K., R. Giorgi, L. Bengtsson, X. Lu, E. Wetter, P. Adrien, S. Rebaudet, R. Piarroux, and J. Gaudart. 2017. “Mathematical Models for Predicting Human Mobility in the Context of Infectious Disease Spread: Introducing the Impedance Model.” International Journal of Health Geographics 16 (1): 1–11. doi:10.1186/s12942-017-0115-7.
- Schneider, C. M., C. Rudloff, D. Bauer, and M. C. González. 2013. “Daily Travel Behavior: Lessons from a Week-Long Survey for the Extraction of Human Mobility Motifs Related Information.” In Proceedings of the 2nd ACM SIGKDD International Workshop on Urban Computing - UrbComp ’13, 1. New York, USA: ACM Press.
- Shelton, T., A. Poorthuis, and M. Zook. 2015. “Social Media and the City: Rethinking Urban Socio-Spatial Inequality Using User-Generated Geographic Information.” Landscape and Urban Planning 142: 198–211. doi:10.1016/j.landurbplan.2015.02.020.
- Shi, Y., H. L. Jiang, M. X. Yang, L. J. Dong, Y. Chen, Y. B. Zhou, and Q. W. Jiang. 2021. “The Precision of Epidemiological Investigation of COVID-19 Transmission in Shanghai, China.” Infectious Diseases of Poverty 10 (1): 1–3. doi:10.1186/s40249-021-00849-w.
- Ta, N., M. -P. Kwan, Y. Chai, and Z. Liu. 2016. “Gendered Space-Time Constraints, Activity Participation and Household Structure: A Case Study Using a GPS-Based Activity Survey in Suburban Beijing, China.” Tijdschrift voor economische en sociale geografie 107 (5): 505–521. doi:10.1111/tesg.12167.
- Tan, S., S. Lai, F. Fang, Z. Cao, B. Sai, B. Song, B. Dai, et al. 2021. “Mobility in China, 2020: A Tale of Four Phases.” National Science Review 8 (11). doi:10.1093/nsr/nwab148.
- Tao, R., J. Downs, T. M. Beckie, Y. Chen, and W. McNelley. 2020. “Examining Spatial Accessibility to COVID-19 Testing Sites in Florida.” Annals of GIS 26 (4): 319–327. doi:10.1080/19475683.2020.1833365.
- Tokey, A. I. 2021. “Spatial Association of Mobility and COVID-19 Infection Rate in the USA: A County-Level Study Using Mobile Phone Location Data.” Journal of Transport & Health 22: 101135. doi:10.1016/j.jth.2021.101135.
- Wahl, H. W., M. Wettstein, N. Shoval, F. Oswald, R. Kaspar, M. Issacson, E. Voss, G. Auslander, and J. Heinik. 2013. “Interplay of Cognitive and Motivational Resources for Out-Of-Home Behavior in a Sample of Cognitively Heterogeneous Older Adults: Findings of the SenTra Project.” Journals of Gerontology - Series B Psychological Sciences and Social Sciences 68 (5): 691–702. doi:10.1093/geronb/gbs106.
- Wettstein, M., H. W. Wahl, N. Shoval, G. Auslander, F. Oswald, and J. Heinik. 2014. “Cognitive Status Moderates the Relationship Between Out-Of-Home Behavior (OOHB), Environmental Mastery and Affect.” Archives of Gerontology and Geriatrics 59 (1): 113–121. doi:10.1016/j.archger.2014.03.015.
- Willberg, E., O. Järv, T. Väisänen, and T. Toivonen. 2021. “Escaping from Cities During the COVID-19 Crisis: Using Mobile Phone Data to Trace Mobility in Finland.” ISPRS International Journal of Geo-Information 10 (2): 103.
- Xu, Y., A. Belyi, I. Bojic, and C. Ratti. 2018. “Human Mobility and Socioeconomic Status: Analysis of Singapore and Boston.” Computers, environment and urban systems 72 (March): 51–67.
- Yao, M., and D. Wang. 2018. “Mobility and Travel Behavior in Urban China: The Role of Institutional Factors.” Transport Policy 69 (June): 122–131.
- Yuan, Y., M. Raubal, and Y. Liu. 2012. “Correlating Mobile Phone Usage and Travel Behavior – a Case Study of Harbin, China.” Computers, Environment and Urban Systems 36 (2): 118–130.
- Zhao, P., and Z. Yu. 2020. “Investigating Mobility in Rural Areas of China: Features, Equity, and Factors.” Transport Policy 94 (May): 66–77.
- Zhao, P., and Z. Yu. 2021. “Rural Poverty and Mobility in China: A National-Level Survey.” Journal of Transport Geography 93 (February): 103083.