
 ?Mathematical formulae have been encoded as MathML and are displayed in this HTML version using MathJax in order to improve their display. Uncheck the box to turn MathJax off. This feature requires Javascript. Click on a formula to zoom.
ABSTRACT
The COVID-19 pandemic has completely disrupted and possibly permanently changed the way humans travel. In Puerto Rico, major travel restrictions to the island have persisted at different levels since March 2020, which heavily influenced residents’ travel behaviors. However, it remains unclear about how big the impact is and how inequitable it might be. The goal of this study is to evaluate COVID-19’s impacts on Puerto Rican’s travel behaviors by analyzing travel flows from Puerto Rico to the contiguous US with a modified gravity model. The roles of socioeconomic factors regarding the Puerto Rican travelers and COVID-19 factors regarding the destination US states have been assessed. COVID-19 was a strong deterring factor of travel at the beginning of the pandemic and also in the winter of 2020, but it did not keep Puerto Ricans from traveling during the summer 2020 when most travel restrictions were lifted. We found that the elderly population of Puerto Rico, despite being more vulnerable to COVID-19, were much more likely to travel during the pandemic. We also found that, during the holiday season in 2020, some socioeconomically disadvantaged populations were more likely to be traveling, a direct contradiction to their travel flows the year prior. These findings shed light on about how disproportionately affected populations behavior changed from pre-pandemic to after the pandemic started. With the continuance of the pandemic, this information is extremely valuable for future planning with respect to emergency management, travel regulation, and social benefit.
1. Introduction
The COVID-19 pandemic has changed the way humans travel, possibly creating a permanent shift in travel volume, frequency, and destination. Puerto Rico, specifically, was heavily impacted by COVID-19. Travel restrictions and island-wide lockdowns began in March 2020 and have persisted at various levels through 2022. Because of these and restrictions in the contiguous US, flights to and from the island dropped approximately 60% between 2019 and 2020. However, it remains unclear about how significant the impact is and how inequitable it might be.
The majority of study methods analyzing travel flow based on impacts from COVID-19 used population-based methods (Brinkman and Mangum Citation2020; Pullano et al. Citation2020), finding that hospitalizations (Pullano et al. Citation2020) and a number of positive COVID-19 cases (Brinkman and Mangum Citation2020) were the greatest deterrents of mobility. Several other studies used surveys and/or social media data for their analyses. These studies agree that COVID-19 has slowed down travel in general (Abdullah et al. Citation2020; Rahman et al. Citation2021; Shamshiripour et al. Citation2020). Preferred modes of travel were discovered to have changed from public to private, and from passive (e.g. driving) to active (e.g. biking), due to an increase in perceived exposure risk on public transportation (Abdullah et al. Citation2020; Shamshiripour et al. Citation2020). Urbanization rates played major roles in peoples’ decision to travel in these studies (Rahman et al. Citation2021). Interestingly, Abdullah et al. (Citation2020) found that in the first few months of the pandemic, while travel for work- or study-related activities decreased significantly in favor of remote work, travel for leisure activities such as sports and recreation increased.
There were few studies pertaining specifically to Puerto Rico. Three main traits set Puerto Rico apart from other locations: its geographic isolation, its unique socioeconomic makeup, and its affiliation with the United States (US). Its location in the Caribbean Sea serves as a hindrance in major disasters when resources are required to be flown to the island, as seen with Hurricane Maria in 2017. Flight availability and affordability is also a main bottleneck of human travel during crises like hurricane and pandemic. Puerto Rico also has a high percentage of vulnerable population. According to the US Census Bureau’s V2021 update, Puerto Rico’s percentage of elderly populations (21.3%), persons with a disability (14.9%), and individuals below the poverty level (43.5%) is higher than US averages (16.5%, 8.6%, and 11.4%, respectively). Finally, with its status as a US territory, Puerto Rico has access to US locations without visa requirement, which differs from other Caribbean countries that have similar geographic and demographic characteristics. Studies on COVID-19’s impact on travelers elsewhere, therefore, are not representative of Puerto Rico.
There are two main research questions addressed in this study: R1) how does COVID-19 affect overall travel flow patterns between Puerto Rico and the contiguous US? and R2) which groups of people in Puerto Rico are disproportionally affected in terms of short-term travel? Based on literature review, the hypothesis for R1 is that the number of cases and deaths in an area affects overall travel flows: H1) higher rates of cases and/or deaths at destinations hinder travel flows. For R2, the following three hypotheses arose: H2.1) the travel behaviors of socioeconomically disadvantaged populations are more heavily disrupted by COVID-19, H2.2) greater ground distance to major airports have less overall flow between origins and destinations, and H2.3) destinations with a greater Puerto Rican population attract more inbound travelers from Puerto Rico. In this study, we address the above research questions using a modified gravity model that includes COVID-19 variables at destination states, socioeconomic factors specific to Puerto Rican populations, and spatial accessibility of airports. The sections of this study are as follows: data and methodology are explained in Section 2, Distance parameters are listed in Section 3, Section 4 pertains to results and discussion, and conclusions are discussed in Section 5.
2. Data and methodology
2.1. Study area
The study area includes Puerto Rico and the contiguous United States. Specifically, we analyzed travel flows from 78 counties in Puerto Rico to 49 state-level administrations in the contiguous US (48 states plus D.C.). Taking counties as the origin spatial units allows us to examine various socioeconomic factors about the travelers, such as income, age, and vehicle ownership. On the other hand, taking states as the destination spatial units allows us to analyze COVID-19 variables without collecting travel flows that are too sparse. We define our study time periods as the pre-pandemic period (January 2019 to December 2019) and the peri-pandemic period (March 2020 to March 2021). Although the pandemic has not ended after March 2021, the impact on travel behaviors became more complicated with factors like vaccination and the pandemic fatigue. Therefore, we mainly compare the first months entering the pandemic and the previous 12 months to observe the impacts.
Due to the major travel bans and lockdowns that happened due to COVID-19, it is important to note the timeline of events throughout our defined study period. This timeline will be summarized in section 3.1.1 below.
2.1.1. Peri-pandemic in Puerto Rico
In mid-March 2020, the CDC (Centers for Disease Control and Prevention) issued a No Sail Order for cruise ships, directly affecting one of the two only ways to get to Puerto Rico. This order was not lifted until October 2020, when the Conditional Sailing Order replaced the original sailing framework (https://www.cdc.gov/quarantine/cruise/covid19-cruiseships.html). Also in mid-March, the Government of Puerto Rico banned travel to Vieques and Culebra and declared an island-wide curfew (Executive Order Citation2020–23 2020). Several large universities canceled in-person classes and moved to remote instruction (https://www.noticel.com/educacion/ahora/20200312/sagrado-corazon-suspende-sus-clases-presenciales-desde-manana/), and public schools and businesses were ordered to close (Executive Order 2020–23 Citation2020). In April, the governor of Puerto Rico requested the FAA restricts travel from hot spot states to San Juan, which would bar flights from Connecticut, Florida, Illinois, New Jersey, New York, and Pennsylvania. According to the Bureau of Transportation Statistics, Florida and New York are the top destinations for Puerto Rican airports and, consequently, flight traffic to the island was drastically decreased (https://www.primerahora.com/noticias/puerto-rico/notas/wanda-vazquez-le-pide-a-faa-que-prohiba-los-vuelos-a-la-isla-desde-nueva-york-y-florida/). In June, the lockdown was lifted excluding external tourism (https://caribbeanbusiness.com/52221-2/), but became more restrictive in July with the re-closing of bars, gyms, and movie theaters (https://www.elnuevodia.com/noticias/gobierno/notas/estas-son-las-nuevas-restricciones-que-entran-en-vigor-manana-para-frenar-el-covid-19/). In August, the governor of Puerto Rico ordered the closure of restaurants that do not provide outside seating and restricted capacity of the remaining restaurants to 50% (https://www.mcvpr.com/newsroom-publications-Executive-Order-EO-2020-060). In early December, a lockdown was ordered for every Sunday through the new year (https://cnnespanol.cnn.com/2020/12/04/gobierno-de-puerto-rico-vuelve-a-ordenar-cuarentena-total-los-domingos-para-evitar-contagios-de-covid-19/).
In January 2021, Discover Puerto Rico began hosting journalists and influencers to jump-start Puerto Rico’s tourism industry (https://www.theweeklyjournal.com/business-gallery/discover-puerto-rico-hosts-journalists-and-influencers/article_073ea722-c552-11eb-955d-2705af7f9cd3.html). Beaches reopened for recreational use and the Sunday curfew was lifted (https://www.mcvpr.com/newsroom-publications-Executive-Order-EO-2020-060). In March, about 12% of the schools were permitted to reopen for in-person learning (https://www.wjtv.com/health/coronavirus/puerto-rico-reopens-public-schools-amid-covid-19-fears/), but a new, albeit later, curfew was enforced along with $100 no-mask fines (https://www.usatoday.com/story/travel/news/2021/03/31/puerto-rico-travel-aggressive-tourists-police-fines/6979905002/). By the end of the month, vaccinations began to be distributed on the scale of thousands (https://abcnews.go.com/Health/wireStory/puerto-rico-vaccinates-thousands-15-hour-mass-event-76798108).
2.2. Gravity model
We modified the classic gravity model by adding Puerto Rico-specific push and pull factors based on study needs, because adding constraints to the model helps improve its accuracy (Karemera, Oguledo, and Davis Citation2000; Hsiao Citation2007; O’Kelly Citation2009; Hilton, Sood, and Evans Citation2020). The Origin-Constrained (O-C) and Destination-Constrained (D-C) Poisson version of the gravity model was adopted to evaluate the impact of each factor on the travel flows, shown in EquationEquation (1)(1)
(1) and EquationEquation (2)
(2)
(2) , respectively.
where represents the spatial interaction, or travel flow volume, between origin i and destination j, represented in our analysis by a model-generated coefficient;
is the population of the origin and
is the population of the destination, both taken from the US Census Bureau;
represents the linear combination of all socioeconomic variables, of which the details will be given in Section 3.2;
is the COVID-19 variable at the destination gleaned from the CDC’s COVID-19 Task Force, given as the percentage of cases or deaths by destination state population; and
is the travel impedance based on Euclidean distance calculated as the distance between origin county centroids in Puerto Rico to destination state centroids in the contiguous US. For the D-C model, an additional distance parameter First Leg was calculated as the distance from the origin county centroids to the nearest of the three international airports on the island. Comparisons were made between the Euclidean distance and First Leg Distance for the D-C model. For pre-pandemic, the O-C model only included the destination population and Euclidean distance impedance. For peri-pandemic, the COVID-19 variables of the destination states were added to the O-C model. The D-C model included the same variables for both periods: the origin population, the social vulnerability makeup of the origin, and the distance impedance between the origin and destination using Euclidean distance.
2.3. ODT flow data
We adopt the travel flow data from the SafeGraph mobility data as the ground truth of Puerto Ricans’ travel patterns in recent years. SafeGraph Inc. offers data generated by a panel of GPS pings from anonymous mobile devices at Geohash-7 granularity (153 m × 153 m). These data are then aggregated by census block groups. Differential privacy is applied to all device count metrics (except the device count itself) to preserve privacy. The flow data was derived from location changes of approximately 3.7 million smartphone users (SafeGraph Citation2021). Therefore, it is more accurate than commercial flight data to represent the true origin and destination of each short-term trip. Besides, it is one of the few data sources that provide up-to-date travel flow data, in contrast with survey-based data that takes a long time to collect and process. The same data source has been used for mobility changes during COVID-19 in studies such as Kang et al. (Citation2020) and Weill et al. (Citation2020). We queried and downloaded the flow data from the ODT (Origin-Destination-Time) Explorer, which is an interactive geospatial data portal about human mobility (Li et al. Citation2020; Squire Citation2019).
shows the ODT flow data between Puerto Rico and the US from January 2019 to March 2021. In the beginning of 2020, the flow volume was higher than the same period in 2019. However, a sharp decrease was observed since March 2020. This is due to the mass business closures, several major universities canceling in-person instruction, and an island-wide curfew that started March 2020 due to COVID-19 (Gobierno de Puerto Rico Citation2020). The flow volume bounced back from May to Jun 2020, then decreased again since July. The turbulence in travel volume implies high uncertainty brought by the pandemic.
Figure 1. Monthly ODT flows between Puerto Rico and the US.
It is important to note that SafeGraph changed methodologies in the 2020-01-01—2020-05-09 period. This change impacted the flow estimates of the early months of 2020. They have not confirmed whether a backfill will be available in the future (SafeGraph Citation2021). For this reason, we have separated the pre-pandemic and peri-pandemic periods into 2019-01—2019-12 for pre-pandemic and 2020-05—2021-03 for the peri-pandemic period for the aggregated results. Monthly results were not impacted significantly enough to exclude the first few months of 2020.
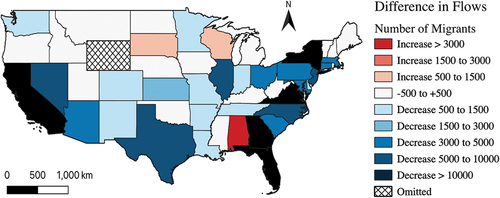
To illustrate the spatial patterns of travel flows from Puerto Rico counties to the 48 states plus the District of Columbia, includes differences in flows between pre- and peri-pandemic periods. Alabama, Michigan, and South Dakota were the only states that experienced an increase in Puerto Rican travelers peri-pandemic, while California, Florida, Georgia, New York, and Virginia were the states that experienced the greatest decrease.
Figure 2. Difference in travel flows from Puerto Rico to the contiguous US calculated as pre-pandemic flow minus peri-pandemic flow.
3. Distance parameters
Available from the Bureau of Transportation Statistics is the locations of direct flights from BQN (Rafael Hernández Airport, Aguadilla), PSE (Mercedita Airport), and SJU (Luis Munoz Marin International Airport, San Juan). Direct flights from Puerto Rico to locations in the contiguous United States provide the least spatial impedance when all other variables are kept constant (distance to airports, economic or social conditions, etc.) and therefore serve an important role in the modeling process. The variable First Leg is defined as the distance between the centroid of each county in Puerto Rico to the nearest of the three major airports. With the D-C model, it was important to explore both the traditional Euclidean distance and the First Leg Distance impedance to see if travel to the nearest airport has a significant impact on travelers at the origin.
3.1. CDC’s COVID-19 data
Data for COVID-19 were taken from the CDC Case Task Force (Citation2020). This dataset is updated daily with aggregate numbers of COVID-19 cases and deaths from 60 jurisdictions: 50 states, Washington D.C., New York City, American Samoa, Guam, the Commonwealth of the Northern Mariana Islands, Puerto Rico, the US Virgin Islands, the Federated States of Micronesia, Republic of the Marshall Islands, and the Republic of Palau. New York City and New York State are reported separately, so these data were aggregated in analysis. Alaska, Hawaii, and Wyoming were excluded due to lack of data, and Vermont was omitted during the months August-October 2020 in analysis due to zero reported deaths. The CDC notes two main limitations: 1) dependency on reports from their respective jurisdictions, and 2) the fact that COVID-19 presented with mild or no symptoms may not be reported at all (CDC Case Task Force Citation2020). These are discussed in more detail in Section 4.
3.2. Socioeconomic variables
The CDC developed the Overall Social Vulnerability Index (CDC’s SVI) as a point of reference for the social side of disasters. According to the CDC, the social component of the disaster cycle is often neglected, but knowing where these socially vulnerable communities are located can help more effectively allocate resources throughout the cycle of disaster (Flanagan et al. Citation2011). The CDC’s SVI provides 16 variables under four topic umbrellas: socioeconomic status, household composition and disability, minority status, and housing and transportation. This index utilizes U.S. Census Bureau data from 2018 to synthesize vulnerable populations by geographic location, specifically at the county level. The CDC’s SVI was developed as a point of reference for the social side of disasters. According to the CDC, the social component of the disaster cycle is often neglected, but knowing where socially vulnerable communities may be affected can help more effectively allocate resources before, during, and after a disaster (Flanagan et al. Citation2011). The development of this index included US Census Bureau data based on mainland US definitions (i.e. a minority is anyone nonwhite), and not all will apply to Puerto Rico.
The final variables, chosen through model runs and collinearity trials, were the following: Below Poverty, Aged 65 or Older, Civilian with a Disability, Single-Parent Households, Crowding, and No Vehicle. Each variable was aggregated at the county level in Puerto Rico. Variables Aged 65 or Older and Civilian with a Disability are calculated as the percentage of individuals in each county that fall under each respective category. Variables Below Poverty, Single-Parent Households, Crowding, and No Vehicle are calculated based on the percentage of households in each county that report below the poverty line, have a single parent as head of a household with at least one child aged 17 years or younger, households that have more individuals living in a dwelling than number of rooms, and households that do not have a vehicle associated with the address, respectively (Flanagan et al. Citation2011). The technical definitions from the CDC dataset for each variable are included in .
Table 1. Official definitions of the chosen variables from the CDC’s SVI (Flanagan et al. Citation2011) and how they impact travel decisions.
Variable % PR Pop at D, or the percentage of Puerto Ricans at the destination state, is the only socioeconomic factor regarding the destination. States with a larger population of Puerto Ricans, such as New York and Florida, have always been the most popular destination for both long-term migrants and short-term travelers from Puerto Rico. The strong cultural connection is a pull factor in the gravity model. Whether its impact became more significant during the pandemic remains to be tested.
4. Results and discussion
4.1. Aggregate results
We first obtained results for data aggregated by the pre-pandemic period (2019-01—2019-12) and the peri-pandemic period (May 2020-March 2021). For the peri-pandemic period, we tested with the total case number and total death number as the COVID-19 independent variable, respectively. The coefficients for the O-C model are summarized in and the D-C model coefficients are in .
Table 2. O-C model-generated coefficients for the pre-pandemic and peri-pandemic periods.
Table 3. D-C model-generated coefficients for the pre-pandemic and peri-pandemic periods.
As expected in a gravity model, Origin Pop and Destination Pop are the main push and pull factors, respectively. The Euclidean Distance and First Leg also serve the role of travel impedance in each study period. % PR Pop at D is another important pull factor as travelers are more likely to choose states with a higher percentage of Puerto Rican population as their destination. According to the model coefficients, its impact becomes higher in the peri-pandemic period (0.316 vs. 0.395) during the first year of COVID-19 if choosing death number as the COVID-19 variable, and higher still (0.466) if using case number. It implies that cultural connection is a key factor before or during the pandemic, as many Puerto Ricans travel to visit their friends and relatives of the same ethnicity. Among the socioeconomic factors at the origin counties peri-pandemic, Below Poverty, Civilian with a Disability and No Vehicle were deterrents of travel given their negative coefficients, whereas Age 65 or Older, Single-Parent Households, Crowding, and Uninsured have positive coefficients, meaning COVID-19 status at the destination was not a deterrent of travel.
When looking at changes caused by the pandemic, all variable coefficients changed in magnitude after the pandemic started, and some even changed in sign. Variable Single-Parent Households changed from negative in the pre-pandemic period to positive in the peri-pandemic period, meaning that they made their decision to travel more during the pandemic even though their status was a deterrent before the pandemic. For the variable No Vehicle, the relationship was opposite: it changed from positive pre-pandemic to negative peri-pandemic, meaning households with no vehicle were deterred from traveling after the pandemic started when they were not before. We ran the origin- or destination-constrained model for each month to evaluate the varying impact of all factors in section 4.4.
4.2. COVID-19‘s varying impact
Looking at COVID-19 variables, there is an apparent discrepancy between new cases and new deaths. The coefficient of new cases is positive for the peri-pandemic period, which even “contribute” to the travel volume. A possible reason is that COVID-19’s negative impact on travel may vary across time. Travel was deterred and restricted at the beginning of pandemic, but it is unclear how long the deterrent effect would last. This calls for further analyses at a finer temporal resolution. We ran the same models as above with data aggregated at monthly level. The coefficients for new cases and new deaths at each month are illustrated in to observe how the impact of COVID-19 changed over time.
Figure 3. Coefficients of COVID-19 variables new cases (light blue bar) and new deaths (dark blue bar) by month. All coefficients were significant at the 0.001 level. Raw numbers of new cases and new deaths are included as light blue and dark blue lines, respectively. New case number was scaled down by a factor of 50 to show trends.
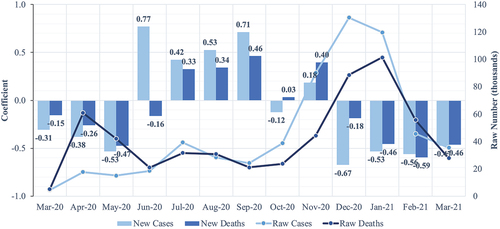
COVID-19 was initially a deterrent of travel from March to May 2020 as both new cases and new deaths had negative coefficients. This is expected as various travel restrictions were deployed both in Puerto Rico and the contiguous US. However, the deterrent effect only lasted for a few months. In June 2020, new cases shifted to positive coefficient values while new deaths remained negative, showing that the number of new cases did not have the same impact as when the pandemic started. From 2020 July to September, both new cases and new deaths returned positive coefficients, showing that although the pandemic was still in full-swing, COVID-19 did not impact travel enough to keep people from traveling in these months. This could be due to the reopening of all sectors excluding external tourism in June 2020 (Cabiyo Citation2020), pandemic fatigue (WHO Citation2020), or a combination of both. It could also be attributed to the lift of travel restriction of popular destination states such as Florida and New York in the early summer of 2020 (https://www.nbcnewyork.com/news/local/all-eyes-on-new-york-city-as-tens-of-thousands-return-to-work/2451180/; https://www.nbcmiami.com/news/local/broward-miami-dade-set-to-enter-phase-one-of-reopening-monday/2234833/), which were the top destinations for Puerto Ricans traveling by air pre-pandemic (Bureau of Transportation Statistics Citationn.d.). The travel demand depressed in the beginning of COVID-19 was compensated in the summer and fall of 2020. Starting in December 2020, both COVID-19 variables had their coefficients returned to negative for the rest of the peri-pandemic period. When comparing the raw numbers of monthly new cases and new deaths and their model-generated coefficients, the relationship is not straightforward throughout the peri-pandemic period. There exists a negative relationship between them in most days of spring and winter of 2020, but a positive relationship in the summer and fall. It implies that COVID-19's impact on Puerto Rican’s travel behaviors was not solely attributed to travelers' fear of huge spike of cases or deaths. Other related factors, such as policy changes regarding travel restriction in summer 2020, can trump the fear of exposure to the disease. Besides, we also noticed that new cases always changed the sign and magnitude of its coefficient before new deaths. This could be due to the known lag in reported deaths, which would skew monthly data. For this reason, only the variable new cases was included in the following analysis.
4.3. Destination-specific factors
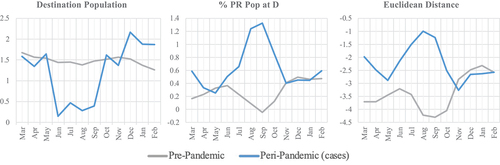
We also examined the variable coefficients with O-C and D-C monthly models. In , each graph includes the monthly-generated coefficients from the O-C model of Destination Population, % PR Pop at D, and Euclidean Distance for both pre-pandemic and peri-pandemic periods. Coefficients of Destination Population approached zero in the same period that coefficients of % PR Pop at D increased in positive magnitude, showing the destination percentage of Puerto Ricans was a greater pull factor than in normal years and destination population became less of a pull factor. Additionally, the absolute values of the negative coefficients of Euclidean Distance became smaller, meaning it was less of an impedance on travel during the pandemic than in the previous year.
Figure 4. O-C model-produced coefficients for variables destination pop, % PR pop at D, and Euclidean distance, separated by month for pre-pandemic in gray and peri-pandemic in blue.
4.4. Origin-specific factors
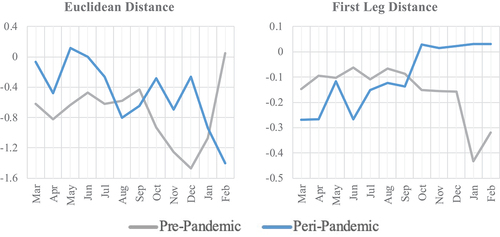
For the D-C model, we first examined the differences between two distance parameters: traditional Euclidean distance and what we defined as First Leg Distance. In , each graph includes monthly-generated coefficients of these two distance parameters. First Leg Distance produced lower coefficient magnitudes than Euclidean Distance throughout the study period. In addition, Euclidean Distance coefficients better captured the relationship between COVID-19 and travel flows seen in , with more negative coefficients generated during the winter months peri-pandemic. As seen with First Leg Distance coefficients, they approached zero during those winter months, meaning it was much less of a deterrent than Euclidean Distance in the same period. Finally, looking at r-squared values for each parameter in the D-C model, there was no significant difference between the two (0.911 for Euclidean Distance and 0.914 for First Leg Distance). For these reasons, Euclidean Distance was chosen as the distance variable of choice and was the only distance parameter included in the following analysis.
Figure 5. D-C model-produced coefficients for variables first leg and Euclidean distance separated by month for pre-pandemic in gray and peri-pandemic in blue.
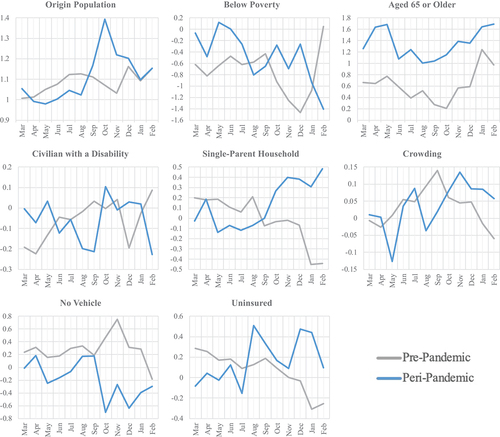
We also examined the coefficients of origin-specific socioeconomic variables with the D-C model. In , each graph includes the monthly-generated coefficients of a socioeconomic variable for both pre-pandemic and peri-pandemic periods. Coefficients of Aged 65 or Older increased in positive magnitude, showing that the elderly population was traveling more often than pre-pandemic. This proved H2.3 true but raised questions about why the most vulnerable population to COVID-19, the elderly, is traveling more often. The variable No Vehicle coefficients switched from positive to negative, meaning not having a vehicle became a deterrent of travel during the pandemic when it was not before the pandemic. This proved H2.2 true. Coefficients for Single-Parent Household seemed to mirror between pre- and peri-pandemic periods. For the first half of the pre-pandemic year, individuals in single-parent households were not as deterred from traveling as they were during the holiday months. By contrast, during the pandemic, these individuals were more likely to travel during the holiday months than during the beginning of the year. Coefficients for Below Poverty show that poverty status did deter individuals from traveling during the holiday months in the pre-pandemic period but were much less significant of a deterrent from travel in the peri-pandemic period. Except for August 2020 and February 2021, most of these coefficients were closer to zero throughout the peri-pandemic period. This means that poverty status did not affect travel as much during COVID-19 as it did before the pandemic. Coefficients for Civilian with a Disability showed that disability remained only a small deterrent to travel for most of both pre- and peri-pandemic periods, despite persons with a disability being classified as higher risk for severe symptoms and death (CDC Citation2021). For the variable Crowding, coefficients remained majorly insignificant throughout both periods with an average of 0.03 pre-pandemic and 0.04 peri-pandemic. This means that, although there is a greater concentration of individuals living in close parameters, crowding was not found to be a significant push factor. The above findings prove H2.1 false, as some socioeconomically disadvantaged population from Puerto Rico had a higher tendency of traveling during COVID-19 compared with the year prior.
Figure 6. D-C model-produced coefficients for variables origin pop and chosen SVI variables separated by month for pre-pandemic in gray and peri-pandemic in blue.
5. Discussions and conclusions
This study sought to explore COVID-19’s impact on Puerto Rican’s travel behavior, specifically when traveling to the contiguous US. Major push and pull factors were evaluated with a modified gravity model that included variables regarding COVID-19, socioeconomic factors, and travel impedance. Coefficients for % PR Pop at D were found to increase more peri-pandemic than pre-pandemic during June to November. This reinforces how important cultural connection is in travel decision-making, especially during the pandemic. Travel purposes that are less important, such as tourism, were likely to be reduced in comparison with purposes like family reunion.
The most deterring variable to travel is Euclidean Distance, meaning that increased distance led to increased impedance on travel based on model outputs. This, combined with the majority negative coefficients produced for the variable No Vehicle in the peri-pandemic period, paints a picture of how difficult or how unattractive it became to ground travel far distances during the pandemic. Considering the sanitary concerns at gas stations, rest stops, and hotels, this finding was consistent with consensus about ground travel during the pandemic. The CDC warned, and still warns, heavily against it (CDC Citation2021), and people are generally less inclined to travel due to perceived risk (e.g. Abdullah et al. Citation2020).
Running the model at the monthly level helped us track the varying impact of COVID-19 on travel. COVID-19 was a strong deterrent factor of travel at the beginning of pandemic. However, its deterrent role was not kept entering summer 2020. As soon as the travel restrictions were lifted, a large volume of travel was observed despite the ongoing pandemic. A significant spike of cases and deaths formed in the holiday season of 2020, and COVID-19 resumed its role as a travel deterrent. There are several factors that come into play: waves of outbreaks, holiday seasons, differing travel restrictions, quarantine requirements, and reopening dates across states, pandemic fatigue, etc. The unsynchronous status of COVID-19 in different states would also have a significant impact on the number of cases and deaths reported. The variable new cases is a better proxy of COVID-19 than new deaths, as data collection of the latter is known to be delayed for weeks.
One of the most interesting findings is that the elderly population of Puerto Rico seemed to travel despite the typical deterrents. With the elderly being the most at-risk group for hospitalization and death from COVID-19, it was unexpected to see the willingness of travel by this demographic in the face of the pandemic. This, coupled with the increased coefficient of % PR Pop at D, paints the picture of elderly populations traveling more to be with family during lockdowns. For example, a qualitative survey-based study by Finlay et al. (Citation2021) found that older adults in the US reported using coping strategies that included being more mobile and making an effort to stay socially connected.
Another interesting finding is that during the holiday season, October through January, coefficients seemed to flip from being a deterrent to being a significant push factor from Puerto Rico for variables Single-Parent Households and Below Poverty. This means that, although single-parent and poverty statuses were deterrents to travel pre-pandemic, they were not major hindering factors in the peri-pandemic period. Literature suggests that the necessity of working, and decreased work options kept lower income individuals traveling throughout the pandemic for job opportunities (Kar, Le, and Miller Citation2021).
5.1. Limitations
SafeGraph’s change methodologies in the 1 January 2020–9 May 2020 period impacted flow estimates for the early months of 2020, showing that more people were staying home in Jan 2019 than Jan 2020 which is demonstrably false. There is no current plan for a backfill of the data (SafeGraph Citation2021), so our aggregate results were limited.
The CDC’s Overall Vulnerability Index (https://www.atsdr.cdc.gov/placeandhealth/svi/data_documentation_download.html) is comprehensive of social factors, but it does not include resource or hazard data. Therefore, this customized SVI map is only helpful when looking at social factors, alone, in the disaster cycle (Flanagan et al. Citation2011). Including quantitative resource and hazard data would make the vulnerability map much more comprehensive.
Using the method of aggregation (Adger et al. Citation2004) also comes with its own issues. Giving each variable the same weight presents problems; for example, there could be some vulnerabilities Puerto Rico is more sensitive to, or counties may have varied sensitivities. This would require a deeper analysis as to how certain areas are more vulnerable than others (Adger et al. Citation2004; Rygel, O’Sullivan, and Yarnal Citation2006). Overall, it is difficult to objectively determine a proper weighting system.
The CDC’s COVID-19 dataset is limited by the number of reported cases. COVID-19 symptoms sometimes present as mild and either go unreported or delay in testing and reporting. There are also differences in how each state reports their new cases and deaths. The CDC also warns that any differences between the dataset they provide and public health departments, the public health departments should be considered most current because they update case data over time as they receive more accurate information (CDC Case Task Force Citation2020).
5.2. Future studies
For future studies, vaccination data are available starting on 13 December 2020 and the CDC updates numbers daily. This data can be added to the existing models to identify the impact of vaccination rate on travel. In addition, phycological factors such as pandemic fatigue, attitudes toward mask and vaccine, should also be explored in more details. This topic is more qualitative and would require survey or interview data, but it is certainly an important perspective to untangle the complex nature of pandemic-related travel behaviors.
Disclosure statement
No potential conflict of interest was reported by the authors.
Data availability statement
The data that support the findings of this study are openly available from the following locations: 1) US Census Bureau in [https://data.census.gov/cedsci/table?q=mobility&g=0400000US72&tid=ACSDT1Y2019.B07204PR&tp=true], reference number [B07204PR]; 2) CDC Case Task Force in [https://data.cdc.gov/Case-Surveillance/United-States-COVID-19-Cases-and-Deaths-by-State-o/9mfq-cb36], reference number [Centers for Disease Control and Prevention (009:20)]; 3) CDC/ATSDR Social Vulnerability Index in [https://www.atsdr.cdc.gov/placeandhealth/svi/data_documentation_download.html]; and 4) ODT Flow Explorer in [http://gis.cas.sc.edu/GeoAnalytics/od.html].
Additional information
Notes on contributors
Lauren C. Carter
Lauren C Carter, M.S., is a PhD candidate in the Geosciences Department at the University of South Florida. She received her master’s degree in applied meteorology from Plymouth State University. Her research interests include human impacts of severe weather, GIS and spatial analysis, how hurricanes affect socioeconomically challenged communities, and the confluence of hurricanes and pandemics.
Ran Tao
RanTao, Ph.D., is an assistant professor at the School of Geosciences, University of South Florida. His research centers on GIScience methods and applications, especially in movement analysis, travel behaviors, and spatial interaction phenomena.
References
- Abdullah, M., C. Dias, D. Muley, and M. Shahin. 2020. “Exploring the Impacts of COVID-19 on Travel Behavior and Mode Preferences.” Transportation Research Interdisciplinary Perspectives 8: 100255. doi:10.1016/j.trip.2020.100255.
- Adger, W. N., N. Brooks, G. Bentham, M. Agnew, and S. Eriksen. 2004. “New Indicators of Vulnerability and Adaptive Capacity.” Technical Report 7. University of East Anglia, Norwich, UK: Tyndall Centre for Climate Change Research.
- Brinkman, J. C., and K. Mangum. 2020. “The Geography of Travel Behavior in the Early Phase of the COVID-19 Pandemic.” Federal Reserve Bank of Philadelphia Research Department. doi:10.21799/frbp.wp.2020.38.
- Bureau of Transportation Statistics. n.d. “TransStats: Airport Snapshots.” Bureau of Transportation Statistics. Accessed 17 February 2021. https://transtats.bts.gov/airports.asp.
- Burns, N. 2020. “Boundary Maintenance: Exploring the Intersections of Disability and Migration.” In Routledge Handbook of Disability Studies, edited by Nick Watson and Simo Vehmas. 2nd ed., 305–320. Oxon and New York: Routledge.
- Cabiyo, Y. H. 2020. Dramatic Economic Reopening After 88-Day Lockdown. Caribbean Business. https://caribbeanbusiness.com/52221-2/
- CDC. 2021. “COVID-19 Information for People with Disabilities.” Centers for Disease Control and Prevention https://www.cdc.gov/ncbddd/humandevelopment/covid-19/people-with-disabilities.html.
- CDC Case Task Force. 2020. “United States COVID-19 Cases and Deaths by State Over Time.” Centers for Disease Control and Prevention https://data.cdc.gov/Case-Surveillance/United-States-COVID-19-Cases-and-Deaths-by-State-o/9mfq-cb36.
- Czarnecki, A., A. Dacko, and M. Dacko. 2021. “Changes in Mobility Patterns and the Switching Roles of Second Homes as a Result of the First Wave of COVID-19.” Journal of Sustainable Tourism. 1–19. doi:10.1080/09669582.2021.2006201.
- Executive Order 2020-23. 2020. Administrative Bulletin OE-2020-023. San Juan, Puerto Rico: Government of Puerto Rico. https://www.trabajo.pr.gov/docs/Boletines/OE-2023Eng.pdf.
- Finlay, J. M., J. S. Kler, B. Q. O’Shea, M. R. Eastman, Y. R. Vinson, and L. C. Kobayashi. 2021. “Coping During the COVID-19 Pandemic: A Qualitative Study of Older Adults Across the United States.” Frontiers in Public Health 9 (April): 643807. doi:10.3389/fpubh.2021.643807.
- Flanagan, B. E., E. W. Gregory, E. J. Hallisey, J. L. Heitgerd, and B. Lewis. 2011. “A Social Vulnerability Index for Disaster Management.” Journal of Homeland Security and Emergency Management 8 (1): 1. doi:10.2202/1547-7355.1792.
- Gobierno de Puerto Rico. 2020. “Boletín Administrativo Núm. OE-2020-023.” https://www.trabajo.pr.gov/docs/Boletines/OE-2023Esp.pdf.
- Gudishala, R., and C. Wilmot. 2012. “Comparison of Time-Dependent Sequential Logit and Nested Logit for Modeling Hurricane Evacuation Demand.” Transportation Research Record 2312 (1): 134–140. doi:10.3141/2312-14.
- Hilton, B., A. P. Sood, and T. S. Evans. 2020. “Predictive Limitations of Spatial Interaction Models: A NonGaussian Analysis.” Scientific Reports 10 (1): 17474. doi:10.1038/s41598-020-74601-z.
- Hsiao, C. 2007. “Panel Data Analysis—advantages and Challenges.” TEST 16 (1): 1–22. doi:https://doi.org/10.1007/s11749-007-0046-x.
- Kang, Y., S. Gao, Y. Liang, M. Li, J. Rao, and J. Kruse. 2020. “Multiscale Dynamic Human Mobility Flow Dataset in the U.S. During the COVID-19 Epidemic.” Scientific Data 7 (1): 390. doi:10.1038/s41597-020-00734-5.
- Karemera, D., V. I. Oguledo, and B. Davis. 2000. “A Gravity Model Analysis of International Migration to North America.” Applied Economics 32 (13): 1745–1755. doi:10.1080/000368400421093.
- Kar, A., H. T. K. Le, and H. J. Miller. 2021. “What is Essential Travel? Socioeconomic Differences in Travel Demand in Columbus, Ohio, During the COVID-19 Lockdown.” Annals of the American Association of Geographers: 1–24. doi:10.1080/24694452.2021.1956876.
- Li, Z., X. Huang, X. Ye, and X. Li 2020. “ODT Flow Explorer: Extract, Query, and Visualize Human Mobility.” https://arxiv.org/abs/2011.12958v1.
- O’Kelly, M. E. 2009. “Spatial Interaction Models.” In International Encyclopedia of Human Geography, 365–368. Elsevier Science. doi:10.1016/B978-008044910-4.00529-0.
- Ostrovsky, Y. 2004. “Life Cycle Theory and the Residential Mobility of Older Canadians.” Canadian Journal on Aging/La Revue Canadienne Du Vieillissement 23 (5): S23–37. doi:10.1353/cja.2005.0038.
- Pedro, S. 2006. “Delineating Hurricane Vulnerable Populations in Orleans Parish, Louisiana.” LSU Master’s Theses, January. https://digitalcommons.lsu.edu/gradschool_theses/515.
- Pullano, G., E. Valdano, N. Scarpa, S. Rubrichi, and V. Colizza. 2020. “Evaluating the Effect of Demographic Factors, Socioeconomic Factors, and Risk Aversion on Mobility During the COVID-19 Epidemic in France Under Lockdown: A Population-Based Study.” Lancet Digital Health 2 (12): e638–49. doi:10.1016/S2589-7500(20)30243-0.
- Rahman, M. K., M. A. I. Gazi, M. A. Bhuiyan, and M. A. Rahaman. 2021. “Effect of COVID-19 Pandemic on Tourist Travel Risk and Management Perceptions.” Plos One 16 (9): e0256486. doi:10.1371/journal.pone.0256486.
- Rygel, L., D. O’Sullivan, and B. Yarnal. 2006. “A Method for Constructing a Social Vulnerability Index: An Application to Hurricane Storm Surges in a Developed Country.” Mitigation and Adaptation Strategies for Global Change 11 (3): 741–764. doi:10.1007/s11027-006-0265-6.
- SafeGraph. 2021. “Social Distancing Metrics.” https://docs.safegraph.com/docs/social-distancing-metrics.
- Shamshiripour, A., E. Rahimi, R. Shabanpour, and A. Mohammadian. 2020. “How is COVID-19 Reshaping Activity-Travel Behavior? Evidence from a Comprehensive Survey in Chicago.” Transportation Research Interdisciplinary Perspectives 7: 100216. doi:10.1016/j.trip.2020.100216.
- Siddiqui, T. 2012. “Impact of Migration on Poverty and Development.” Migrating out of Poverty. United Kingdom: University of Sussex, School of Global Studies. https://opendocs.ids.ac.uk/opendocs/bitstream/handle/20.500.12413/14824/wp2-impact-of-migration-on-poverty-and-development.pdf?sequence=1&isAllowed=y
- Simpson, N. 2017. “Demographic and Economic Determinants of Migration.” IZA World of Labor. doi:10.15185/izawol.373.
- Snel, E., and R. H. J. M. Staring. 2001. “Poverty, Migration, and Coping Strategies: An Introduction.” Focaal European Journal of Anthropology 38 (January): 7–22.
- Squire, R. F. 2019. “What About Bias in the SafeGraph Dataset?” SafeGraph. https://colab.research.google.com/drive/1u15afRytJMsizySFqA2EPlXSh3KTmNTQ.
- Weeks, L. E., J. Keefe, and D. J. Macdonald. 2012. “Factors Predicting Relocation Among Older Adults.” Journal of Housing for the Elderly 26 (4): 355–371. doi:10.1080/02763893.2011.653099.
- Weill, J. A., M. Stigler, O. Deschenes, and M. R. Springborn. 2020. “Social Distancing Responses to COVID-19 Emergency Declarations Strongly Differentiated by Income.” Proceedings of the National Academy of Sciences 117 (33): 19658–19660. doi:10.1073/pnas.2009412117.
- WHO. 2020. “Pandemic Fatigue: Reinvigorating the Public to Prevent COVID-19.” World Health Organization. https://apps.who.int/iris/bitstream/handle/10665/335820/WHO-EURO-2020-1160-40906-55390-eng.pdf.