
 ?Mathematical formulae have been encoded as MathML and are displayed in this HTML version using MathJax in order to improve their display. Uncheck the box to turn MathJax off. This feature requires Javascript. Click on a formula to zoom.
ABSTRACT
Geothermal energy is a renewable and environmentally sustainable resource of increasing importance. However, areas with geothermal potential are not easily detected by traditional field investigations, requiring the development of new, robust, and reliable models for detection. In this study, remote sensing data and ground-based variables were used to detect and analyze geothermal resource potential areas. General Land Surface Temperature (GLST) was integrated using 5 years of remote sensing data. Landsat 8 daytime GLST (Landsat-GLST), Moderate Resolution Imaging Spectroradiometer (MODIS) daytime GLST (MODIS-DLST), and MODIS nighttime GLST (MODIS-NLST) data were integrated with Landsat Nighttime Land Surface Temperature (Night-LST), which not only filled the gap of Landsat Night-LST but also improved the spatial resolution of MODIS nighttime temperatures. Specifically, three independent variables (Night-LST, Distance From Known Geothermal Resource Points [DFGP], and Distance From Geological Faults [DFF]) were used to develop a weighted model to form a Geothermal Detection Index (GDI) based on Principal Component Analysis (PCA). Along with field verification, the GDI was successfully used to identify three geothermal activity areas in Tengchong City, Yunnan Province. Overall, this work provides a novel method for detecting geothermal potential to support the successful exploitation of geothermal resources.
1. Introduction
With the recent increase in serious environmental problems, such as climate change and the depletion of traditional resources, the development of renewable energy sources, such as geothermal, solar, wind, and biomass, has intensified considerably. In particular, geothermal resources offer pollution-free and stable energy sources (T. Abbasi and S. Abbasi Citation2012; Kurek et al. Citation2021; Rezaie and Aghajani Citation2013; Van der Meer et al. Citation2014) that can effectively meet energy demands with minimal environmental impact (Chen and Xu Citation2013). Geothermal energy has been successfully harnessed on a large scale for space heating, industry, and electricity generation for many years (Ingvar Citation2001); however, uncertainty encountered in previous geothermal investigations has raised many problems (Jennejohn Citation2009). Therefore, it is particularly important to develop robust models that can detect geothermal activity and resource potential.
Previous studies have shown that suitable assessment criteria for geothermal potential include distance to mineral alteration zones, volcanic rock, faults, and hot springs; earthquake distributions; and magnetic anomaly distributions (Sun et al. Citation2012; Meng et al. Citation2021; Moghaddam et al. Citation2013, Citation2014; Mcguire et al. Citation2015; Li and Zhang Citation2017; Zhang et al. Citation2020). However, active geothermal fields often exhibit temperature anomalies at the ground surface because of heat and mass transfer processing from volcanic activity, hot springs, mud pots, or fumaroles (Tian et al. Citation2015). Currently, most studies detect geothermal activity by focusing on two criteria, namely geological structures and Land Surface Temperature (LST). Indeed, LST is a key parameter in the physics of land surface processes at regional and global scales (Zhang and He Citation2013; Wang et al. Citation2019; Gemitzi, Dalampakis, and Falalakis Citation2021; Li et al. Citation2021; Li, Xu, and Yao Citation2021). For example, Saepuloh et al. (Citation2020) using The Thermal Infrared Red (TIR) of the Advanced Spaceborne Thermal Emission and Reflection Radiometer (ASTER) data, Synthetic Aperture Radar (SAR) images, and ground data explored the relationship between surface temperature and roughness and identified the geothermal steam spots. Romaguera et al. (Citation2018) explored the possibility of using two types of LST time series to detect geothermal anomalies and extract the geothermal component of LST.
The geothermal potential of areas within the Akarcay Basin in Turkey was also determined using a GIS-based Multi-Criteria Decision Analysis Method (MCDA), with hot springs reliably predicted as having geothermal potential (Yalcin and Gul Citation2017). Similarly, in Hokkaido, Japan, a geostatistical approach combined with TIR remote sensing data and three-dimensional (3D) temperature modeling based on well measurements was used for geothermal exploration (Tian et al. Citation2015). Zhang et al. (Citation2020) identified and classified potential geothermal areas based on geothermal, geological, and geophysical spatial associations in Fujian Province, China. Based on the GIS supported weight-of-evidence model and fuzzy logic model, the geothermal prediction maps were established using the impact factor maps.
Rich data on the causes of Tengchong magma heat source geothermal resources. Qin et al. (Citation2011) inversed the surface temperature by using the single-channel algorithm on the thermal infrared band, and identified four geothermal regions consistent with the fault development in Tengchong. Zhang et al. (Citation2012) used remote sensing and Geographic Information System (GIS) for geothermal exploration in Tengchong, Yunnan Province, SW China. Xiong, Chen, and Huang (Citation2016) used elevation information partition to identify the abnormal surface temperature areas and circled the geothermal abnormalities in Tengchong; Tang, Li, and Liu (Citation2017) determined geothermal abnormal areas in Tengchong by eliminating the shadow influence and inversing the temperature.
In particular, Landsat datasets provide a unique opportunity for global-scale surface temperature assessment with more than 30 years of archived imagery, including TIR (Roy et al. Citation2014; Weng and Fu Citation2014; Weng, Fu, and Gao Citation2014; Cristóbal et al. Citation2018; Saepuloh et al. Citation2020). Over the past decade, LST derived from Landsat remote sensing data has been successfully used to assess geothermal potential (e.g. Li et al. Citation2014; Gemitzi, Dalampakis, and Falalakis Citation2021). More recently, LST methods including the split-window method (Becker and Li Citation1990; Wan and Dozier Citation1996), the single-channel method (Jiménez-Muñoz and Sobrino Citation2003), and radiative transfer equation-based methods have been developed. Moreover, obtaining LSTs using the radiative transfer equation-based method based on Band 10 has been verified as the approach providing the highest level of accuracy with Root Mean Square Errors (RMSEs) of <1 K (Yu, Guo, and Wu Citation2014). LST products of MODIS have been widely used in a range of research fields. This includes Li et al. (Citation2012), who used multi-temporal nighttime MODIS LSTs to identify geothermal anomalies that show good agreement with relative geothermal gradient measurements. Furthermore, using historical data, LST models can be built to predict daytime temperature (Hengl et al. Citation2012). MODIS LST data have also been successfully combined with Landsat 8 data to improve the accuracy of LST measurements derived from satellites (e.g. Zhao et al. Citation2020).
In this study, we sought to build on this existing work by improving data quality and accuracy to better inform geothermal exploration. Specifically, as Landsat 8 LST data have a high spatial resolution, and MOD11A2 LST products contain both daytime and nighttime data, we combined these products to retrieve high-resolution nighttime LSTs. In addition, we developed a weighted principal component model to evaluate geothermal potential by combining Night-LST with geotectonic factors, which concluded that DFGP and DFF are useful indicators of geothermal potential. Tengchong City, Yunnan Province, located in Southwest China, is extremely rich in geothermal resources due to its geological structure. We take this county as an example for research.
2. Study area
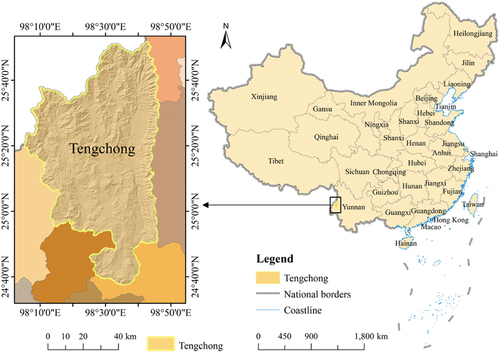
Tengchong County is located in southwest Yunnan Province (), Southwest (SW) China, with a total area of 5,845 km2. This area sits at the intersection of the Eurasian and Indian Plates with 84% of the land area covered by mountains (Wei et al. Citation2003). The terrain is high in the north and low in the south, and the mountains run Northeast-west and North-south, which is basically the same with the regional structural line. The formation development in the study area was incomplete due to the new and Mesozoic magmatic activity, the lower Paleozoic formation was absent in the study area, only development Proterozoic rocks, Paleozoic rocks, Mesozoic rocks, Neogene rocks, and Quaternary sediments. Formation exposure is relatively sporadic and has poor continuity due to granite intrusion in different periods. Quaternary volcanic and fault structures are the most prominent characteristics of the region at present. The active faults in the Northeast, North, Northwest, and South of the region have developed well and are conducive to geothermal formation (Du et al. Citation2005). The county is characterized by frequent tectonic-thermal events, seismic activity, and active faults, with more than 70 volcanic craters of different sizes and 140 hot springs (Wan, Zhao, and Kang Citation2005). As a famous volcanic and hot spring geothermal area, Tengchong displays a wide distribution of volcanic rocks and hot geothermal fields.
Figure 1. Location of Tengchong County, Yunnan Province, China.
3. Input ata
3.1. Remote sensing data
Remote sensing data, including Landsat 8 and MODIS, were the main focus of this study. The obtained images () were free from cloud and snow cover. The geological structure map of the Tengchong area was obtained from the China Geological Survey, and land survey results for Tengchong County (2011) were obtained from the Land Management Department of Tengchong City. The verification data we used were from other studies (Li and Zhang Citation2017; Guo Citation2012; Ba Citation2017). Information about the Rehai geothermal field was also obtained from field surveys.
Table 1. Remote sensing data used in this study.
3.2. Distance from sites with known geothermal activities (DFGP)
To date, 64 sites of geothermal activity have been identified in the Tengchong area. These sites are mainly hot springs that have been explored by residents and opened to the public as tourism sites. Here, we determined 60 sites with strong geothermal activity, with a high probability that currently unknown geothermal activity exists around the known geothermal resource points. Therefore, the probability of geothermal activity decreases with distance from existing geothermal hotspots. Based on this, we generated a DFGP raster file showing the distance between each pixel and known geothermal hotspots ().
Figure 2. Raster files showing (a) distance from known geothermal resource points (DFGP) and (b) distance from faults (DFF).
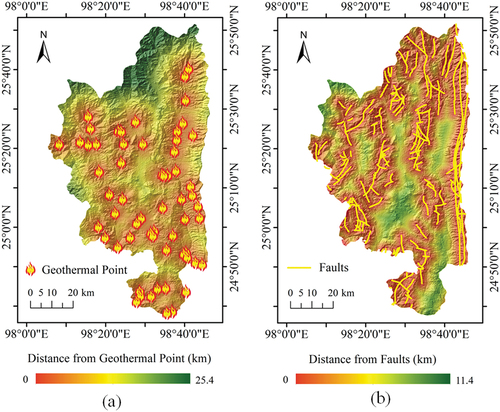
3.3. Distance from faults (DFF)
Previous studies of geothermal resources in the Tengchong area have found that the fault structure controls the spatial distribution of geothermal activity, and high-temperature geothermal areas are concentrated at the intersection of faults. In the studied region, the active faults are predominantly north–south oriented (Shangguan, Bai, and Sun Citation2000). Correspondingly, the spatial distribution of geothermal heat is banded and curved following an anastomosing pattern consistent with the fault-line geomorphology. We created a DFF raster file based on the distance of each pixel from geological fault lines (). Note that fault depth was not considered.
4. Methodology
4.1. Technical framework
Night-LSTs were obtained by integrating Landsat 8 daytime General Land Surface Temperature (GLST; Landsat-GLST), MODIS Daytime GLST (MODIS-DLST), and MODIS Nighttime GLST (MODIS-NLST) with DFF and DFGP input data. From this, we developed a geothermal detection model based on a PCA weighting method ().
Figure 3. Overall workflow adopted to detect geothermal potential.
4.2. Remote sensing data processing
4.2.1. LST retrieval
LST results from solar radiation and the energy emitted back from beneath the Earth’s surface. To detect geothermal resources, the effect of solar radiation can be subtracted from the total thermal radiation observed by the satellite sensor. The obtained thermal radiation intensity can then be converted into LST, which provides a scientific basis for the detection of potential geothermal resources. Current algorithms for retrieving surface temperature from remote sensing data include the radiative transfer equation method, single-window, and split-window algorithms, as well as multi-channel and multi-angle algorithms, among others. The radiative transfer equation method, also known as the atmospheric correction method, is mainly based on the composition of the thermal radiation intensity received by the thermal infrared satellite sensor. The algorithm subtracts the atmospheric influence factor and calculates surface temperature, using the relationship function between thermal radiation intensity and surface temperature. The radiation flux received by Landsat 8 Thermal infrared Sensor (TIRS) is mainly composed of surface heat radiation, atmospheric upward heat radiation, and atmospheric downward heat radiation, which are partially reflected by the sensor. The expression of the thermal infrared radiance received by the sensor can be written as (Sobrino, Jimenez-Munoz, and Paolini Citation2004):
where is the radiance received by the thermal infrared sensor (
),
is the specific surface emissivity,
is the thermal emission of a blackbody as expressed by Planck’s law,
and
are the downward and upward radiation intensities of the atmosphere, respectively (
), and τ is the atmospheric infrared transmittance. The upward and downward radiation and transmittance of the atmosphere were obtained, using the atmospheric correction parameter calculator provided by the National Aeronautics and Space Administration (NASA) https://atmcorr.gsfc.nasa.gov (Barsi et al. Citation2005). Black body luminance can be obtained from the formula (2):
The relationship between radiation energy, temperature, and wavelength within the specifications of TIRS 10 can be simplified according to Planck’s law, as follows:
where is the surface temperature,
,
, based on previous studies (Van der Meer et al. Citation2014) on the range and spectral response function of TIRS 10.
Subsequently, specific surface emissivity and the radiance received by thermal infrared sensor
can be calculated.
can be directly obtained by radiometric calibration of the thermal infrared band 10. The processes of temperature retrieval by the radiation transmission equation method are shown in . Land-specific surface emissivity, or emissivity, refers to the ratio of the radiation emitted by a land surface to the radiation emitted by a blackbody at the same temperature (Li et al. Citation2013).
Figure 4. The workflow of LST retrieval, using the radiative transfer equation-based method.
This ratio is determined by surface composition, roughness, the observed range of wavelengths, and other factors. Remote sensing images are mainly composed of water, urban land use, and natural land surfaces. Natural land surfaces, covered by different types of vegetation, differ in their specific emissivity. One of the most common classification indices, which was also used in the present study, is the Normalized Difference Vegetation Index (NDVI). As NDVI is a normalized index, the calculation error from atmospheric influence on NDVI is not very large. In the case of the present study, the surface temperature error caused by NDVI remained less than 0.1 K. NDVI can be obtained directly by the Operational Land Imager (OLI) B4 and B5 after radiometric calibration. The proportion of ground covered by vegetation is closely related to the temperature ratio and specific surface emissivity of land surfaces. Thus, NDVI can be used to estimate vegetation coverage , as follows (Sobrino, Jimenez-Munoz, and Paolini Citation2004):
where represents the minimum value of NDVI without vegetation, and
is the maximum value for an area completely covered by vegetation. For the calculated NDVI values, a certain amount of noise is inevitable, for this reason
and
generally are reported within their respective confidence ranges. However, for the calculation of vegetation cover using Equationequation (5)
(5)
(5) , it is assumed that the pixel value is 1 if NDVI>
and it is 0 if NDVI<
.
For the calculation of land surface emissivity, the specific emissivity of typical ground objects can be represented by an estimate, and the band 10 thermal infrared band of TIRS and Thematic Mapper/Enhanced Thematic Mapper (TM/ETM +) 6 thermal infrared band have similar spectral range, so the same calculation method of surface emissivity of TM/ETM+6 is used in this study. In addition, Yu, Guo, and Wu (Citation2014) used a single band for surface temperature inversion, and found that the band 10 was relatively Band 11 has high inversion accuracy.
In this study, LST products of MODIS were used to evaluate if the LST results from Landsat imagery were reliable and used to synthesize the night land surface temperature data combining the Landsat land surface temperature. MOD11A2 Daytime LST products provide per-pixel Land Surface Temperature and Emissivity with 1-km spatial resolution. It included Daytime Land Surface Temperature, Nighttime Land Surface Temperature, Daytime LST Quality Indicators, and other data layers. To obtain LST data, it is necessary to extract the corresponding layers from MOD11A2 products. For this study, the MODIS Reprojection Tool (MRT) (Dwyer and Schmidt Citation2006) software was used to re-project the MOD11A2 data and convert the default Hierarchy Data Format-Earth Observation System (HDF-EOS) data format to GeoTIFF. To reduce the required storage space, the LST product needed to undergo a numerical conversion process. To obtain LST in degree Celsius, MOD11A2 raw data had to be converted as follows:
where is the ground temperature in degree Celsius, DN is the raw value from the LST_Day_1km layer of the MOD11A2 product, and
is the proportional coefficient for the product, in this case, 0.02.
MODIS LST products were used to evaluate whether the LST results obtained from the Landsat imagery were reliable, which were then used to synthesize the Night-LST data. First, the corresponding layer was extracted from the multiple data layers of the MOD11A2 LST product. The MRT was then applied to convert the default data format to GeoTIFF. The MOD11A2 raw data were also converted to degree Celsius.
4.2.2. Construction of GLST
As the LST data for 1 year cannot accurately reflect true LST due to complex variability over a range of timescales, a composite of remote sensing data for 5 years was used to synthesis based on the standard deviation. Thus, the standard deviations for LST from 2015 to 2019 were used to determine surface temperature anomalies at different points in time, thereby representing more generalized surface temperature conditions. The weighted and synthesized LST estimates were calculated as follows:
where is the weight of the ith image,
is the standard deviation of the ith image,
is the LST obtained from the i-th image, and GLST is the comprehensive temperature.
Comparisons of Landsat-GLST, MODIS-DLST, and MODIS-NLST data are shown in and . Although the selected data were from the same period, there was some deviation due to slight differences in the acquisition times and temperature-retrieval algorithms. Nevertheless, in general, the spatial pattern of pixel values was in good agreement between Landsat-GLST and MODIS-DLST. High-temperature anomalies were concentrated in similar regions, indicating that temperature results are reliable. Therefore, the spatial distribution of the measured temperature range still has reference value, and the comparison demonstrated that the results from remote sensing data were reliable, especially the occurrence of high-temperature anomalies in the eastern farmland area. For MODIS-NLST, the spatial pattern was different from that of the DLST values, which reflects the intensity of insolation, the different types of land cover, and the influence of human activities. Take Rehai geothermal field as an example in , the Landsat-GLSTs and MODIS-DLSTs are broadly similar, although there are still some differences due to the higher spatial resolution of the MODIS-DLST dataset. In comparison, the pattern of MODIS-NLSTs is quite different from the other two datasets. This shows that the surface temperature during the day is affected by other external factors and cannot accurately reflect the geothermal conditions, so it once again proves that the surface temperature at night is more reflective of the abnormal geothermal activities. Compared to the MODIS-DLSTs in , the temperature range is greater in the Landsat dataset, with a maximum of 30.34°C and a minimum of 5.29°C, although the average temperature is similar to that of the MODIS-DLST dataset. As expected, the nighttime LSTs are generally much lower than the daytime values. As a result, these statistical data once again prove that the use of Landsat data can more effectively detect geothermal abnormal areas.
Figure 5. Comparison of GLST (a) Landsat-GLST; (b) MODIS-DLST; and (c) MODIS-NLST.
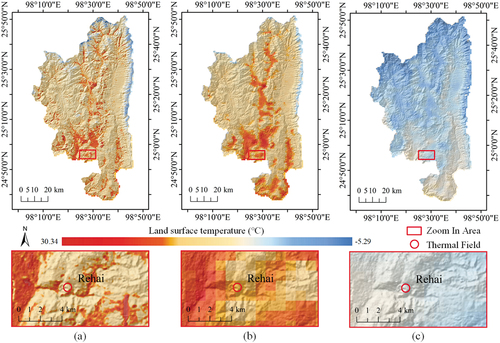
Table 2. Summary statistics for Landsat-GLST, MODIS-DLST, and MODIS-NLST datasets.
4.2.3. GLST verification
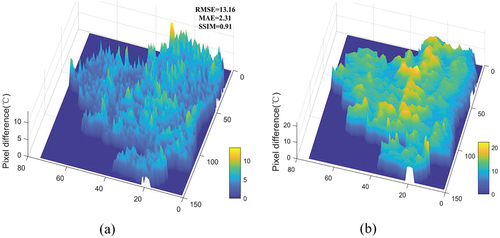
To verify the LST estimates, the RMSE (Fridleifsson Citation2001), Mean Absolute Error (MAE) (Willmott and Matsuura Citation2005), and Structural Similarity Index Measure (SSIM) (Qin et al. Citation2004) were used to evaluate the consistency between the GLST values. For the comparison of Landsat-GLST and MODIS-DLST, the RMSE indicated abnormal values in the image. In comparison, the MAE was less than 3°, indicating that the errors of the two images were small. Finally, the SSIM was 0.91, which shows that the structural similarity between the two images was very high (). Based on these results, the reliability of the temperature retrieval method was confirmed, including support its use for the synthesis of Night-LSTs. In addition, the difference between MODIS daytime temperature data and nighttime temperature data was more pronounced in high-temperature regions.
Figure 6. (A) Comparison of Landsat-GLST and MODIS-DLST; (b) Comparison of MODIS-DLST and MODIS-NLST.
4.2.4. Construction of Landsat Night-LST
Based on the comparison and verification of the GLST data and to eliminate the influence of the spatial resolution of the MODIS dataset and compensate for the lack of Landsat nighttime surface temperature data, Landsat 8 nighttime LST inversion was performed as follows:
where is the weight,
is MODIS-NLST,
is MODIS-DLST,
is the Night-LST, and
is Landsat-GLST.
4.3. PCA
PCA is a powerful multivariate statistical method that is commonly applied in a wide range of areas (Bro and Smilde Citation2014). PCA can reassemble a group of multiple independent variables into a new, smaller set of variables that retain as much of the information contained in the original data as possible. The new, condensed variables are called principal components. In the process of synthesizing multiple independent variables to detect geothermal resources, it is difficult to determine the magnitude of each factor’s role in the process, which affects the detection capability of final results. PCA can effectively eliminate redundant information and determine the impact weight of each influencing factor to construct the detection model. Before performing PCA, an original sample matrix needs to be constructed. For this purpose, the study area was randomly divided into n blocks. A matrix X is established by using the average values of N influence factors in n regions as an index for the principal component analysis. The ith column vector of matrix X is the sample column vector (i = 1,2, … N). The column vectors are used to compute the correlation coefficient matrix R of matrix X as follows:
where is the covariance matrix, composed of the covariances of
and
.
and
are the variances of the corresponding column vectors. The column vectors can also be normalized to mean 0 and variance 1, resulting in a correlation coefficient matrix:
where and
are the averages and standard deviations of the sample variables
, and
is defined as a positive standard matrix. Subsequently, the eigenvalues and eigenvectors are obtained from the correlation coefficient matrix R by solving the equation:
where is the N eigenvalues of the matrix R and x is the eigenvector that corresponds to the eigenvalue
(i = 1,2, …, N). Arranging the eigenvalues from largest to smallest (
), the variance contribution rate g and the cumulative variance contribution rate G are calculated. The higher the cumulative variance contribution rate is, the lower the number of resulting principal components, which in turn indicates that less information has been lost. In general, eigenvalues with a cumulative variance contribution over 80% should be selected as main components, as in this case the quantity m of the principal component should be satisfied:
The eigenvector corresponding to m principal components is used as the coefficient of the comprehensive score model, and the weight of each influencing factor can be determined as follows:
where is the linear combination coefficient of the i-th influencing factor in the j-th principal component,
is the variance contribution rate of the j-th principal component,
is the standardized result of the weight
of the i-th influencing factor.
4.4. GDI
The GDI was calculated based on the weight of each influencing factor, where the weighted average operator of each factor is:
where is an influencing factor for detecting geothermal activity, and
represents the weight of each factor. Based on the PCA results, DFF, DFGP, and Night-LST were selected as the influencing factors to calculate the GDI.
5. Results and validation
5.1. Spatial pattern of Night-LST
Night-LST data are shown in and summarized in . Compared with the MODIS-NLSTs, Night-LST shows good spatial consistency with similar high-temperature anomalies in association with some human activity and farmland areas in the south. The temperature range of the Night-LST dataset is relatively large, but the average and standard deviation are broadly the same as the MODIS-NLST dataset. There is a certain degree of difference in the spatial pattern of LSTs between the nighttime and daytime values. This difference may be due to the impact of human activity and the heat island effect, i.e. the relatively higher temperature of urban surfaces in some cities compared to other areas. Thus, the inversion data of the Night-LST were available. Importantly, based on the identification of areas with abnormal Night-LSTs, geothermal resource potential can be effectively detected.
Figure 7. (A) Spatial pattern of Night-LST; (b) Classification of land cover based on Random Forest classification. The two images in the middle are detailed enlargements of the areas indicated.
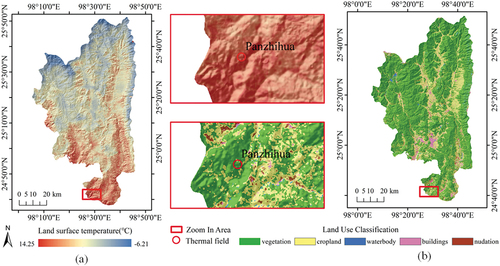
Table 3. Summary statistics for Night-LST.
shows a land-use classification map based on Landsat 8 multispectral data combining the NDVI, Normalized Difference Built-up Index (NDBI), texture analysis, and regions of interest obtained using the Random Forest classification. is used as a qualitative analysis to assist in interpreting the types of land cover in the study area. Based on the Night-LST dataset, the high-temperature areas are mainly concentrated in the vegetated and farmland areas as well as around some cities in the south. For example, the Panzhihua geothermal field in the south with high-temperature anomalies () is mostly by natural vegetation and cropland.
5.2. The results of PCA
I propose creating a map of 10 × 10 fishing net statistical zones, generating 78 regions, and a correlation coefficient matrix was established for the independent variables. The correlation coefficients and eigenvalues along with their variance contribute rates are shown in , and eigenvectors are shown in . The resulting two eigenvalues had a cumulative variance contribution rate of 88.6%. The weights of the first two component influencing factors were calculated using their corresponding two eigenvectors (). According to previous studies, DFF, DFGP, and Night-LST have associations with geothermal resources, and they are similar to the content expressed by the first principal component. Therefore, the first principal component was considered to contain information relating to three influencing factors.
Table 4. Eigenvalues of principal components and their variance contribution rates.
Table 5. Weights of the influencing factors and coefficients of the principal components.
5.3. Spatial pattern of GDI values
The GDI results are shown in , with high values concentrated around cropland and urban areas, which indicates that (i) human activity is concentrated in areas of higher geothermal activity and (ii) the heat produced by human activity may alter Night-LST patterns. Outside of the urban areas, high GDI values indicate key areas for further geothermal exploration, with three geothermal potential areas identified. The first area (area “a” in ) is centered on the Langpu and Rehai thermal fields, mainly covered by vegetation and with human activity, with existing developed geothermal activity points. The second area is located around the Panzhihua and Heishihe thermal fields (area “b” in , where geothermal activities are already developed and faults are relatively concentrated. The third area is located around Beihai thermal field (area “c” in ) in association with the north-south Dazhai-Longjiaying-Jiuzhai Fault. There are also some areas with the potential for geothermal exploitation in the Ruidian thermal field.
Figure 8. Spatial distribution of Geothermal Detection Index (GDI) values. The enlargements show areas marked “a”, “b”, and “c” in the left image centered on thermal fields.
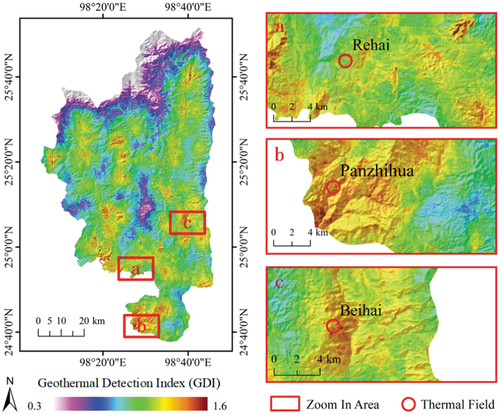
Based on , the GDI values in Tengchong range between 0.3 and 1.6 and the area with values between 1.3 and 1.6 were chosen as the area of geothermal development potential. Land-use data for this area are shown in , with almost half of the pixels indicating vegetation cover and approximately 41% cropland cover; areas of other human activity accounted for less than 10%. The altitude range of Tengchong County is 971.76 m to 3671.19 m. Compared to the elevation of the entire county, the average elevations of areas with GDI values ranging from 1.3 to 1.6 are relatively close, with the highest average elevation located in vegetation areas, followed by cropland. The lowest average elevation is in waterbody, followed by buildings. This is more in line with reality. For the average GDI value, the five types of land cover are 1.36 and 1.37. Therefore, the data analysis in the comprehensive table, most of these areas, which indicate rich geothermal resources, has not yet been developed. In view of some vegetation-covered areas with high altitude are difficult to develop, and the large-scale development in areas with frequent human activities is temporarily not carried out, the remaining vegetation-covered areas, cropland, bare soil, and some waterbodies have great potential for geothermal development.
Table 6. Land-use classifications and corresponding pixel counts, proportion (%), area (m2), average altitude (m) and average GDI within GDI values ranging 1.3–1.6.
5.4. Validation
5.4.1. Langpu geothermal field
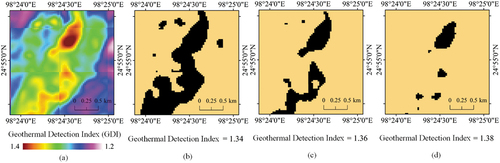
The distribution of GDI values in the Langpu geothermal area is shown in , ranging from 1.2 to 1.4. Using these values, we tested three thresholds (1.34, 1.36, and 1.38) for the extraction of geothermal areas with the greatest development potential (). The area corresponding to a threshold of 1.36 () was most suitable, producing an area that would neither require excessive survey work (as is the case for the 1.34 threshold, nor exclude potentially valuable locations (as is the case for the 1.38 threshold, . This area contained 654 favorable points with a total area of 0.59 km2. Compared to the recorded first-grade geothermal area of 0.6 km2 (Zhang et al. Citation2012), the extraction accuracy was 98%.
Figure 9. GDI values in the Langpu geothermal field (a) and the geothermal potential detection area extracted using three thresholds of 1.34 (b), 1.36 (c), and 1.38 (d).
5.4.2. Rehai geothermal field
Temperature was measured in eight drill wells in the Rehai area (), and the corresponding GDI values are shown in . In general, the GDI values (ranging from 1.317 to 1.378) increased with an increase in well temperature (ranging from 30°C to 96°C), but there were some exceptions, which may reflect differences in the well depths (). The locations of the eight measured drilling points are shown in , with Hamazui having the highest temperature (up to 96°C) and GDI value (1.378). shows GDI values around Da Zhai with a temperature of 71°C. shows GDI values around Shangqiluo, with a temperature of 30°C, indicating that the GDI results were also reliable for detecting potential geothermal areas with relatively low temperatures.
Figure 10. Field surveying in the Rehab area.
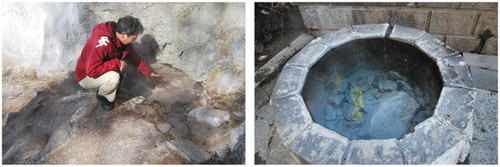
Figure 11. (A) Locations of eight drilling sites and Geothermal Detection Index (GDI) values in the Rehai area; (b) GDI values around Dazhai (CK2); (c) GDI values around Shangqiluo (CK8).
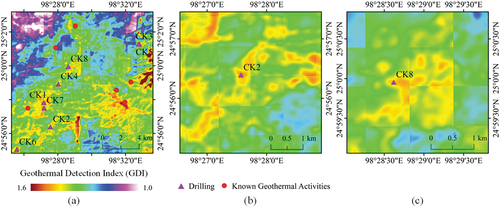
Table 7. Average GDI values corresponding to drilling well temperatures.
6. Discussion
6.1. Impact of human activity on LST retrieval
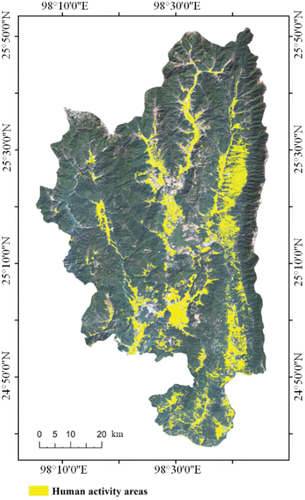
Interference from human activity can complicate the interpretation of LST results. Indeed, some important temperature anomalies indicating the presence of geothermal resources may be neglected if areas of human activity are simply excluded. For this reason, it is important to further consider land use in the study area. The 2011 Tengchong City land survey identified areas affected by intense human activity, as shown in . A comparison with indicates that the survey results can be considered fairly accurate. In the future, these land-use data could be combined with visual interpretation to determine the land-cover type of study sites as training samples for machine learning, which could allow the more effective exclusion of human interference and target these sites for subsequent research.
Figure 12. Areas of intensive human activity in the Tengchong region.
In addition to this, the urban heat island effect also needs to be taken into account. Urban Heat Islands (UHI) are a manifestation of these changes, a phenomenon in which urban areas are warmer than surrounding rural areas (Mirzaei and Haghighat Citation2010). Urbanization creates a process in which natural landscapes are replaced by built-up areas. Therefore, it affects the absorption, storage, and emission rates of surface energy and releases excess anthropogenic energy (Hart and Sailor Citation2009). Urban heat islands are one of the main negative impacts of increased human activity and impervious surface cover in urban environments (Firozjaei et al. Citation2020; Huang, Liu, and Li Citation2021; Jiang et al. Citation2022). As an important part of the urban impervious surface, buildings and residences have different surface radiation and energy distribution from the natural surface. In order to ensure the accuracy of the identification of the geothermal potential area by the LST. In the future, it can be combined with Night-Time Light data or other effective methods to identify and exclude as much as possible, which is still a complex and challenging task (Liu, Chi, and Kuang Citation2014; Peng et al. Citation2016; Kuang Citation2018; Shao, Wu, and Li Citation2021; Qian et al. Citation2022; Yu et al. Citation2022; Li et al. Citation2022; ElGharbawi and Tamura Citation2022).
6.2. Influence of topography and fault depth on geothermal detection
LST is controlled by the complex interplay of topography, incoming radiation, and atmospheric processes as well as by soil moisture, land cover, and vegetation types, especially in mountainous areas (Bertoldi et al. Citation2010; Jamali et al. Citation2022; Hussain et al. Citation2022). Therefore, to improve the reliability of remotely sensed LST data, topographic correction is needed to adjust the spectral characteristics of land surfaces and account for the differences in surface irradiation caused by terrain. In this context, shading also had important effects on the land-surface energy balance in mountainous terrain (Bellasio et al. Citation2005). Therefore, the influences of geological factors complicate the quantification of topographic effects on LST and, thus, limit model detection accuracy. Furthermore, faults with different activity depths result in variable surface temperatures and degrees of geothermal fluid activity. Deep faults can induce upwelling of geothermal water, while shallow faults only provide channels for lower-temperature groundwater. The burial depth of geothermal resources and, hence, the economic feasibility of exploitation efforts. Therefore, further research is required to examine the influence of fault depth on geothermal potential detections.
6.3. Influence of land-surface thermal properties
Energy at the land surface is mainly derived from solar radiation, bioenergy, and the internal heat of the Earth (Zhang and Cao Citation2003). As we specifically aimed to explore the relationships between heat from the internal Earth and land-surface temperature, we selected MODIS-NLST products to reduce the influence of daytime heat sources. However, given the range of land-cover types both in our study area and elsewhere, the thermal properties of the land surface can vary greatly (Zhang et al. Citation2015). Therefore, differences in the thermal capacity, conductivity, and diffusivity of different land-cover types should be taken into consideration in future research.
7. Conclusions
We developed and applied a new method for detecting geothermal activity using Tengchong as a case study. We derived high-resolution Night-LST data with satisfactory verification results. These data were combined with DFF and DFGP datasets in a multi-factor weighted model based on PCA, yielding a comprehensive GDI for assessing geothermal resources. By analyzing the spatial distribution of GDI values, we identified three geothermal potential areas in Tengchong, including vegetated areas that have not yet been developed. These locations represent potentially valuable areas for the development and utilization of geothermal energy resources. Considering that areas with high LST coincided with areas of high human activity, additional research is now needed to examine human land uses on the derived GDI results. In addition, a greater range of variables linked to geothermal resources could be added to the model to improve accuracy and detection capability.
Disclosure statement
No potential conflict of interest was reported by the authors.
Data availability statement
The remote sensing data are available at [http://glovis.usgs.gov/], the fault data and the sites of geothermal activity are derived from the following resources available in the public domain: [https://data.earthquake.cn/index.html, https://geocloud.cgs.gov.cn/]. The in-situ data that support the findings of this study are available from the corresponding author [Zhifang Zhao], upon reasonable request.
Additional information
Funding
Notes on contributors
Fei Zhao
Fei Zhao is an associate professor in the School of Earth Sciences, Yunnan University, Kunming, China. He received his PhD degree from Wuhan University, Wuhan, China, in 2012. His main research interests include cartography, spatial analysis, and urban sustainable development.
Zhiyan Peng
Zhiyan Peng is a postgraduate in School of Earth Sciences, Yunnan University, Kunming, China. Her research interests are remote sensing application and spatial analysis.
Jiangkang Qian
Jiangkang Qian is a PhD student in Cartography and GIS at Aerospace Information Research Institute, Chinese Academy of Sciences, Beijing, China. His research interests are the quantification of anthropogenic heat and urban thermal environment simulation.
Chen Chu
Chen Chu is a master student majoring in Geographical Information Sciences at Institution of Geographic Sciences and Natural Resources Research, Chinese Academy of Science, Beijing, China. His research interest is spatio-temporal data mining.
Zhifang Zhao
Zhifang Zhao is a professor in the School of Earth Sciences, Yunnan University, Kunming, China. Her research interests include resource and environmental remote sensing monitoring, mineralized alteration remote sensing anomaly enhancement extraction, and remote sensing monitoring of land and resources in border areas.
Jiangqin Chao
Zhifang Zhao is a professor in the School of Earth Sciences, Yunnan University, Kunming, China. Her research interests include resource and environmental remote sensing monitoring, mineralized alteration remote sensing anomaly enhancement extraction, and remote sensing monitoring of land and resources in border areas.
Jiangqin Chao is a Lecturer in School of Geographical Sciences and Tourism, Zhaotong University, Zhaotong, China. She is pursuing the PhD in Cartography and GIS at the Institute of International Rivers and Eco-Security, Yunnan University, Kunming, China. Her research interests are thermal infrared quantitative remote sensing inversion and thermal infrared geothermal geological exploration.
Shiguang Xu
Shiguang Xu is a professor in Yunnan Geology and Mineral Explorating & Engineering Corp. (Group) and a chief engineer in Yunnan Geological Engineering Survey and Design Institute. His research interests are water resources, geological environment, and prevention and control of geological disasters.
References
- Abbasi, T., and S. A. Abbasi. 2012. “Is the Use of Renewable Energy Sources an Answer to the Problems of Global Warming and Pollution?” Critical Reviews in Environmental Science and Technology 42 (2): 99–154. doi:10.1080/10643389.2010.498754.
- Ba, J. 2017. “Study on the genetic model of heat source-dominated thermal storage in the Ruidian geothermal field in Tengchong County, Yunnan Province.” PhD diss., Kunming University of Science and Technology.
- Barsi, J. A., J. R. Schott, F. D. Palluconi, and S. J. Hook. 2005. “Validation of a Web-Based Atmospheric Correction Tool for Single Thermal Band Instruments.” Earth Observing Systems 5882: 136–142. doi:10.1117/12.619990.
- Becker, F., and Z. Li. 1990. “Towards a Local Split Window Method Over Land Surfaces.” International Journal of Remote Sensing 11 (3): 369–393. doi:10.1080/01431169008955028.
- Bellasio, R., G. Maffeis, J. S. Scire, M. G. Longoni, R. Bianconi, and N. Quaranta. 2005. “Algorithms to Account for Topographic Shading Effects and Surface Temperature Dependence on Terrain Elevation in Diagnostic Meteorological Models.” Boundary-Layer Meteorology 114 (3): 595–614. doi:10.1007/s10546-004-1670-6.
- Bertoldi, G., C. Notarnicola, G. Leitinger, S. Endrizzi, M. Zebisch, S. Della Chiesa, and U. Tappeiner. 2010. “Topographical and Ecohydrological Controls on Land Surface Temperature in an Alpine Catchment.” Ecohydrology 3 (2): 189–204. doi:10.1002/eco.129.
- Bro, R., and A. K. Smilde. 2014. “Principal Component Analysis.” Analytical Methods: Advancing Methods and Applications 6 (9): 2812–2831. doi:10.1039/C3AY41907J.
- Chen, C., and X. Xu. 2013. “International Energy Companies’ Utilization of Geothermal Energy and Inspiration for Sinopec.” Sino-Global Energy 18 (11): 21–25.
- Cristóbal, J., J. Jiménez-Muñoz, A. Prakash, C. Mattar, D. Skoković, and J. Sobrino. 2018. “An Improved Single-Channel Method to Retrieve Land Surface Temperature from the Landsat-8 Thermal Band.” Remote Sensing 10 (3): 431. doi:10.3390/rs10030431.
- Du, J., C. Liu, B. Fu, Y. Ninomiya, Y. Zhang, C. Wang, H. Wang, and Z. Sun. 2005. “Variations of Geothermometry and Chemical-Isotopic Compositions of Hot Spring Fluids in the Rehai Geothermal Field, Southwestern China.” Journal of Volcanology and Geothermal Research 142 (3–4): 243–261. doi:10.1016/j.jvolgeores.2004.11.009.
- Dwyer, J., and G. Schmidt. 2006. “The MODIS Reprojection Tool.” In Earth Science Satellite Remote Sensing, 162–177. Berlin, Heidelberg: Springer. doi:10.1007/978-3-540-37294-3_9.
- ElGharbawi, T., and M. Tamura. 2022. “Increasing Spatial Coverage in Rough Terrain and Vegetated Areas Using InSar Optimized Pixel Selection: Application to Tohoku, Japan.” Geo-Spatial Information Science 25 (2): 295–311. doi:10.1080/10095020.2021.2004867.
- Firozjaei, M. K., Q. Weng, C. Zhao, M. Kiavarz, L. Lu, and S. K. Alavipanah. 2020. “Surface Anthropogenic Heat Islands in Six Megacities: An Assessment Based on a Triple-Source Surface Energy Balance Model.” Remote Sensing of Environment 242: 111751. doi:10.1016/j.rse.2020.111751.
- Fridleifsson, I. B. 2001. “Geothermal Energy for the Benefit of the People.” Renewable and Sustainable Energy Reviews 5 (3): 299–312. doi:10.1016/S1364-0321(01)00002-8.
- Gemitzi, A., P. Dalampakis, and G. Falalakis. 2021. “Detecting Geothermal Anomalies Using Landsat 8 Thermal Infrared Remotely Sensed Data.” International Journal of Applied Earth Observation and Geoinformation 96: 102283. doi:10.1016/j.jag.2020.102283.
- Guo, T. 2012. “Study on the characteristics and causes of the Rehai geothermal field in Tengchong, Yunnan.” PhD diss., Kunming University of Science and Technology.
- Hart, M. A., and D. J. Sailor. 2009. “Quantifying the Influence of Land-Use and Surface Characteristics on Spatial Variability in the Urban Heat Island.” Theoretical and Applied Climatology 95 (3): 397–406. doi:10.1007/s00704-008-0017-5.
- Hengl, T., G. B. M. Heuvelink, M. Perčec Tadić, and E. J. Pebesma. 2012. “Spatio-Temporal Prediction of Daily Temperatures Using Time-Series of MODIS LST Images.” Theoretical and Applied Climatology 107 (1): 265–277. doi:10.1007/s00704-011-0464-2.
- Huang, X., A. Liu, and J. Li. 2021. “Mapping and Analyzing the Local Climate Zones in China’s 32 Major Cities Using Landsat Imagery Based on a Novel Convolutional Neural Network.” Geo-Spatial Information Science 24 (4): 528–557. doi:10.1080/10095020.2021.1892459.
- Hussain, S., M. Mubeen, A. Ahmad, H. Majeed, S. A. Qaisrani, H. M. Hammad, M. Amjad, et al. 2022. “Assessment of Land Use/Land Cover Changes and Its Effect on Land Surface Temperature Using Remote Sensing Techniques in Southern Punjab, Pakistan.” Environmental Science and Pollution Research 1–17. doi:10.1007/s11356-022-21650-8.
- Ingvar, B. F. 2001. “Geothermal Energy for the Benefit of the People.” Renewable and Sustainable Energy Reviews 5 (3): 299–312. doi:10.1016/s1364-0321(01)00002-8.
- Jamali, A. A., R. G. Kalkhajeh, T. O. Randhir, and S. T. He. 2022. “Modeling Relationship Between Land Surface Temperature Anomaly and Environmental Factors Using GEE and Giovanni.” Journal of Environmental Management 302: 113970. doi:10.1016/j.jenvman.2021.113970.
- Jennejohn, D. 2009. “Research and Development in Geothermal Exploration and Drilling.” In Geothermal Energy Association, 1–25. Washington: Geothermal Energy Association.
- Jiang, S., J. Peng, J. Dong, X. Cheng, and Y. Dan. 2022. “Conceptual Connotation and Quantitative Characterization of Surface Urban Heat Island Effect.” Acta Geographica Sinica 77 (9): 2249–2265. doi:10.11821/dlzb202209008.
- Jiménez-Muñoz, J. C., and J. A. Sobrino. 2003. “A Generalized Single-Channel Method for Retrieving Land Surface Temperature from Remote Sensing Data.” Journal of Geophysical Research Atmospheres 108 (D8). doi:10.1029/2003JD003480.
- Kuang, W. 2018. “Advance and Future Prospects of Urban Land Use/Cover Change and Ecological Regulation of Thermal Environment.” Scientia Geographica Sinica 38 (10): 1643–1652. doi:10.3390/su10062056.
- Kurek, K. A., W. Heijman, J. van Ophem, S. Gędek, and J. Strojny. 2021. “The Contribution of the Geothermal Resources to Local Employment: Case Study from Poland.” Energy Reports 7: 1190–1202. doi:10.1016/j.egyr.2021.01.092.
- Li, H., T. M. Kusky, S. Peng, and M. Zhu. 2012. “Detection of Geothermal Anomalies in Tengchong, Yunnan Province, China from MODIS Multi-Temporal Night LST Imagery.” Abstract presented at the American Geophysical Union Fall Meeting 2012, San Francisco, California, United States; IN21C–1483.
- Li, B., Y. Liu, H. Xing, Y. Meng, G. Yang, X. Liu, and Y. Zhao. 2021. “Integrating Urban Morphology and Land Surface Temperature Characteristics for Urban Functional Area Classification.” Geo-Spatial Information Science 25 (2): 337–352. doi:10.1080/10095020.2021.2021786.
- Li, H., D. Sun, Y. Yu, H. Wang, Y. Liu, Q. Liu, Y. Du, H. Wang, and B. Cao. 2014. “Evaluation of the VIIRS and MODIS LST Products in an Arid Area of Northwest China.” Remote Sensing of Environment 142: 111–121. doi:10.1016/j.rse.2013.11.014.
- Liu, Y., W. Chi, and W. Kuang. 2014. “The Surface Flux Characteristics Based Quantitative Thermal Infrared Remote Sensing Inversion of Urban Impervious Surfaces.” Journal of Geo-Information Seience 16 (4): 609–620. doi:10.3724/SP.J.1047.2014.00609.
- Li, Z., H. Wu, N. Wang, S. Qiu, J. A. Sobrino, Z. Wan, B. Tang, and G. Yan. 2013. “Land Surface Emissivity Retrieval from Satellite Data.” International Journal of Remote Sensing 34 (9–10): 3084–3127. doi:10.1080/01431161.2012.716540.
- Li, T., Y. Xu, and L. Yao. 2021. “Detecting Urban Landscape Factors Controlling Seasonal Land Surface Temperature: From the Perspective of Urban Function Zones.” Environmental Science and Pollution Research 28 (30): 41191–41206. doi:10.1007/s11356-020-11060-z.
- Li, J., and Y. Zhang. 2017. “GIS-Supported Certainty Factor (CF) Models for Assessment of Geothermal Potential: A Case Study of Tengchong County, Southwest China.” Energy 140: 552–565. doi:10.1016/j.energy.2017.09.012.
- Li, R., S. Zheng, C. Duan, L. Wang, and C. Zhang. 2022. “Land Cover Classification from Remote Sensing Images Based on Multi-Scale Fully Convolutional Network.” Geo-Spatial Information Science 25 (2): 278–294. doi:10.1080/10095020.2021.2017237.
- Mcguire, J. J., R. B. Lohman, R. D. Catchings, M. J. Rymer, and M. R. Goidman. 2015. “Relationships Among Seismic Velocity, Metamorphism, and Seismic and Aseismic Fault Slip in the Salton Sea Geothermal Field Region.” Journal of Geophysical Research: Solid Earth 120 (4): 2600–2615. doi:10.1002/2014JB011579.
- Meng, F., X. Liang, C. Xiao, and G. Wang. 2021. “Geothermal Resource Potential Assessment Utilizing GIS-Based Multi Criteria Decision Analysis Method.” Geothermics 89: 101969. doi:10.1016/j.geothermics.2020.101969.
- Mirzaei, P. A., and F. Haghighat. 2010. “Approaches to Study Urban Heat Island-Abilities and Limitations.” Building and Environment 45 (10): 2192–2201. doi:10.1016/j.buildenv.2010.04.001.
- Moghaddam, M. K., Y. Noorollahi, F. Samadzadegan, M. A. Sharifi, and R. Itoi. 2013. “Spatial Data Analysis for Exploration of Regional Scale Geothermal Resources.” Journal of Volcanology and Geothermal Research 266: 69–83. doi:10.1016/j.jvolgeores.2013.10.003.
- Moghaddam, M. K., F. Samadzadegan, Y. Noorollahi, M. A. Sharifi, and R. Itoi. 2014. “Spatial Analysis and Multi-Criteria Decision Making for Regional-Scale Geothermal Favorability Map.” Geothermics 50: 189–201. doi:10.1016/j.geothermics.2013.09.004.
- Peng, J., Y. Chen, Z. Hu, and H. Wei. 2016. “Research Progress and Prospect on Quantitative Identification of Urban Hinterland Area.” Progress in Geography 35 (1): 14–24. doi:10.18306/dlkxjz.2016.01.003.
- Qian, J., Q. Meng, L. Zhang, D. Hu, X. Hu, and W. Liu. 2022. “Improved Anthropogenic Heat Flux Model for Fine Spatiotemporal Information in Southeast China.” Environmental Pollution 299: 118917. doi:10.1016/j.envpol.2022.118917.
- Qin, Z., W. Li, B. Xu, Z. Chen, and J. Liu. 2004. “The Estimation of Land Surface Emissivity for Landsat TM6.” Remote Sensing for Natural Resources 2004 (3): 28–32 +36-41+74.
- Qin, Q., N. Zhang, P. Nan, and L. Chai. 2011. “Geothermal Area Detection Using Landsat ETM+ Thermal Infrared Data and Its Mechanistic Analysis—a Case Study in Tengchong, China.” IInternational Journal of Applied Earth Observation and Geoinformation 13 (4): 552–559. doi:10.1016/j.jag.2011.02.005.
- Rezaie, M., and H. Aghajani. 2013. “A New Combinational Terminology for Geothermal Systems.” International Journal of Geosciences 4 (1): 43–48. doi:10.4236/ijg.2013.41005.
- Romaguera, M., R. G. Vaughan, J. Ettema, E. Izquierdo-Verdiguier, C. A. Hecker, and F. D. van der Meer. 2018. “Detecting Geothermal Anomalies and Evaluating LST Geothermal Component by Combining Thermal Remote Sensing Time Series and Land Surface Model Data.” Remote Sensing of Environment 204: 534–552. doi:10.1016/j.rse.2017.10.003.
- Roy, D. P., M. A. Wulder, T. R. Loveland, C. E. Woodcock, R. G. Allen, M. C. Anderson, D. Helder, et al. 2014. “Landsat-8: Science and Product Vision for Terrestrial Global Change Research.” Remote Sensing of Environment 145: 154–172. doi:10.1016/j.rse.2014.02.001.
- Saepuloh, A., R. H. Saputro, M. N. Heriawan, and D. Malik. 2020. “Integration of Thermal Infrared and Synthetic Aperture Radar Images to Identify Geothermal Steam Spots Under Thick Vegetation Cover.” Natural Resources Research 30 (1): 245–258. doi:10.1007/s11053-020-09754-9.
- Shangguan, Z., C. Bai, and M. Sun. 2000. “Mantle-Derived Magmatic Gas Releasing Features at the Rehai Area, Tengchong County, Yunnan Province, China.” Science in China Series D: Earth Sciences 43 (2): 132–140. doi:10.1007/BF02878142.
- Shao, Z., W. Wu, and D. Li. 2021. “Spatio-Temporal-Spectral Observation Model for Urban Remote Sensing.” Geo-Spatial Information Science 24 (3): 372–386. doi:10.1080/10095020.2020.1864232.
- Sobrino, J. A., J. C. Jimenez-Munoz, and L. Paolini. 2004. “Land Surface Temperature Retrieval from LANDSAT TM 5.” Remote Sensing of Environment 90 (4): 434–440. doi:10.1016/j.rse.2004.02.003.
- Sun, B., L. Wang, P. Dong, Y. Wu, C. Li, B. Hu, and C. Wang. 2012. “Integrated Analysis on Gravity and Magnetic Fields of the Hailar Basin, NE China: Implications for Basement Structure and Deep Tectonics.” Pure and Applied Geophysics 169 (11): 2011–2029. doi:10.1007/s00024-012-0452-1.
- Tang, C., K. Li, and Y. Liu. 2017. “Temperature Inversion of Geothermal Anomaly Area in Tengchong Area Based on Thermal Infrared Remote Sensing Technology.” Geomatics & Spatial Information Technology 40 (1): 36–39.
- Tian, B., L. Wang, K. Kashiwaya, and K. Koike. 2015. “Combination of Well-Logging Temperature and Thermal Remote Sensing for Characterization of Geothermal Resources in Hokkaido, Northern Japan.” Remote Sensing 7 (3): 2647–2667. doi:10.3390/rs70302647.
- Van der Meer, F., C. Hecker, F. van Ruitenbeek, H. van der Werff, C. de Wijkerslooth, and C. Wechsler. 2014. “Geologic Remote Sensing for Geothermal Exploration: A Review.” International Journal of Applied Earth Observation and Geoinformation 33: 255–269. doi:10.1016/j.jag.2014.05.007.
- Wan, Z., and J. Dozier. 1996. “A Generalized Split-Window Algorithm for Retrieving Land-Surface Temperature from Space.” IEEE Transactions on Geoscience and Remote Sensing 34 (4): 892–905. doi:10.1109/36.508406.
- Wang, K., Q. Jiang, D. Yu, Q. Yang, L. Wang, T. Han, and X. Xu. 2019. “Detecting Daytime and Nighttime Land Surface Temperature Anomalies Using Thermal Infrared Remote Sensing in Dandong Geothermal Prospect.” International Journal of Applied Earth Observation and Geoinformation 80: 196–205. doi:10.1016/j.jag.2019.03.016.
- Wan, Z., Y. Zhao, and J. Kang. 2005. “Forecast and Evaluation of Hot Dry Rock Geothermal Resource in China.” Renewable Energy 30 (12): 1831–1846. doi:10.1016/j.renene.2005.01.016.
- Wei, H., R. S. J. Sparks, R. Liu, Q. Fan, Y. Wang, H. Hong, H. Zhang, et al. 2003. “Three Active Volcanoes in China and Their Hazards.” Journal of Asian Earth Sciences 21 (5): 515–526. doi:10.1016/S1367-9120(02)00081-0.
- Weng, Q., and P. Fu. 2014. “Modeling Annual Parameters of Clear-Sky Land Surface Temperature Variations and Evaluating the Impact of Cloud Cover Using Time Series of Landsat TIR Data.” Remote Sensing of Environment 140: 267–278. doi:10.1016/j.rse.2013.09.002.
- Weng, Q. H., P. Fu, and F. Gao. 2014. “Generating Daily Land Surface Temperature at Landsat Resolution by Fusing Landsat and MODIS Data.” Remote Sensing of Environment 145: 55–67. doi:10.1016/j.rse.2014.02.003.
- Willmott, C. J., and K. Matsuura. 2005. “Advantages of the Mean Absolute Error (MAE) Over the Root Mean Square Error (RMSE) in Assessing Average Model Performance.” Climate Research 30 (1): 79–82. doi:10.3354/cr030079.
- Xiong, Y., F. Chen, and S. Huang. 2016. “Application of Remote Sensing Technique to the Identification of Geothermal Anomaly in Tengchong Area, Southwest China.” Journal of Chengdu University of Technology (Science & Technology Edition) 43 (1): 109–118. doi:10.3969/j.issn.1671-9727.2016.01.12.
- Yalcin, M., and F. K. Gul. 2017. “A GIS-Based Multi Criteria Decision Analysis Approach for Exploring Geothermal Resources: Akarcay Basin (Afyonkarahisar).” Geothermics 67: 18–28. doi:10.1016/j.geothermics.2017.01.002.
- Yu, X., X. Guo, and Z. Wu. 2014. “Land Surface Temperature Retrieval from Landsat 8 Tirs—comparison Between Radiative Transfer Equation-Based Method, Split Window Algorithm and Single Channel Method.” Remote Sensing 6 (10): 9829–9852. doi:10.3390/rs6109829.
- Yu, J., X. Li, X. Guan, and H. Shen. 2022. “A Remote Sensing Assessment Index for Urban Ecological Livability and Its Application.” Geo-Spatial Information Science 1–22. doi:10.1080/10095020.2022.2072775.
- Zhang, Q., and X. Cao. 2003. “The Influence of Synoptic Conditions on the Averaged Surface Heat and Radiation Budget Energy Over Desert or Gobi.” Chinese Journal of Atmospheric Sciences 27 (2): 245–254.
- Zhang, Z., and G. He. 2013. “Generation of Landsat Surface Temperature Product for China, 2000–2010.” International Journal of Remote Sensing 34 (20): 7369–7375. doi:10.1080/01431161.2013.820368.
- Zhang, N., Q. Qin, L. He, and H. Jiang. 2012. “Remote Sensing and GIS Based Geothermal Exploration in Southwest Tengchong, China.” In Paper presented at the Proceedings of the IEEE International Geoscience and Remote Sensing Symposium (IGARSS), Munich, Germany, July 22-27, 5364–5367. doi:10.1109/IGARSS.2012.6352395.
- Zhang, Z., Q. Wu, X. Xun, Y. Hou, and S. Gao. 2015. “Analysis on Thermal Physical Properties of Different Ground Types.” Journal of Chang’an University (natural Science Edition) 35 (4): 41–47. 10.1972l/j.cnki.1671-8879.2015.04.007.
- Zhang, Y., Y. Zhang, H. Yu, J. Li, Y. Xie, and Z. Lei. 2020. “Geothermal Resource Potential Assessment of Fujian Province, China, Based on Geographic Information System (GIS)-Supported Models.” Renewable Energy 153: 564–579. doi:10.1016/j.renene.2020.02.044.
- Zhao, B., J. Du, K. Song, J. Pierre-André, X. Xiang, H. Zhou, Z. Yang, L. Zhang, and P. Guo. 2020. “Spatio-Temporal Variation of Water Heat Flux Using MODIS Land Surface Temperature Product Over Hulun Lake, China During 2001–2018.” Chinese Geographical Science 30 (6): 1065–1080. doi:10.1007/s11769-020-1166-4.