
 ?Mathematical formulae have been encoded as MathML and are displayed in this HTML version using MathJax in order to improve their display. Uncheck the box to turn MathJax off. This feature requires Javascript. Click on a formula to zoom.
ABSTRACT
The advancement of effective spatial planning to support sustainable development and inter-regional cooperation has become an issue of serious concern for regional authorities. Spatial planning research helps to identify economic clusters and analyze their changing spatial patterns, which is important for understanding regional economic space dynamics and potential inter-regional cooperation. To support decision-makers in the development of efficient plans of spatial development encompassing the identification of the best-suited territories, a combined Geographic Information System (GIS) based approach to interpret qualitatively expressed multiple socio-economic scenarios in quantitative map-based terms of graded suitability, and a formalized approach to the socio-economic evaluation of the territory is offered. Based on GIS technology coupled with integrated cellular automata decision analysis techniques, the study provides a method that performs socio-economic assessment of the study area according to the generated scenarios of regional spatial and socio-economic development. The proposed method is applied to Primorsky and Khabarovsk Krais, located in the Russian Far East. Socio-economic scenarios of spatial development initiated by investors and regional authorities were assessed and evaluated. The generated socio-economic scenarios illustrate how the unified set of spatial and socio-economic variables can be linked and used to gain insights into inter-regional socio-economic and spatial development. The application results demonstrate the advantage of the proposed method in identifying the best-suited unit areas for targeted regional development.
1. Introduction
Almost a century ago, Hotelling (Citation1929) noted that space is a fundamental concept underlying much of economics where it is responsible for resource applications and efficient spatial planning (Walsh Citation1997; Yu et al. Citation2005; Billaud et al. Citation2020) since then it has been repeatedly confirmed in mainstream and transitional economics (Hooimeijer Citation1991; Hanink Citation1997; Gjestland, Thorsen, and Ubøe Citation2006; Li et al. Citation2015).
Starting from 2016 spatial planning research has been markedly increasing and has now been extended to not only urban and regional planning but also public administration, environmental studies, and other disciplines dealing with various economy-based and space-related factors (Pacuk, Palmowski, and Tarkowski Citation2018; Stead Citation2021; Zhang et al. Citation2022). Spatial planning research helps identify industrial clusters and analyze their changing spatial patterns, which is important for understanding regional economic space dynamics (Yang et al. Citation2012). A comprehensive scope based on social, economic, and space relations is essential in elaborating sound interaction policies of regional industries and their production chains. In its turn, effective regional interaction significantly improves production and territorial management systems triggering competitive growth and economic development (Batey Citation2000; Diao et al. Citation2009; Li et al. Citation2015; Bell and Morse Citation2018; Han et al. Citation2021).
Adopted in 2019 the Strategy of Spatial Development of the Russian Federation (SDS) introduces a summary of important spatial economic processes going on in Russia, addresses the current problems of the regions, contains main policy priorities, rules, and measures to be implemented, and sets goals to be reached by 2025. The SDS presents a list of decision rules concerning the location of infrastructure facilities but does not provide mechanisms and tools necessary for the preliminary assessment of existing socioeconomic and spatial situations to target the development and make the implementation of a regional SDS more efficient and less financially and resource intensive. The only proposed tool for unlocking the potential of regions and achieving the goals of the SDS is a mechanism that establishes the criterion and procedure for making decisions on establishing zones with preferential business conditions. Taking into consideration the vast spatial differences of the country, the reliability of a single development mechanism for different territories seems questionable (Kuznetsova Citation2019). Isaev (Citation2022) emphasizes that to understand the process of regional economic growth it is necessary to study its key driving factors, to recognize the mechanisms by which these factors show their impact, and to find how a particular combination of the factors affects the regional system in response to certain stimuli. According to Seliverstov et al. (Citation2019), unlocking a territory potential is based on an in-depth study of its specificity, competitive advantages, and limitations. The mandatory elements of a regional SDS should be scenarios of spatial development, options for the spatial emplacement of technological platforms, and mechanisms for implementing the established priorities and achieving the goals of spatial development.
Advanced regional planning strategies promote inter-regional economic development, population flow, and industrial cooperation with higher tendency to agglomeration and diffusion of regional industries in geographical space (Wang Citation2022b). Currently, there is a trend toward gathering high- and middle-end manufacturing and service industries in the agglomeration megacity, while labor-intensive middle- and low-end processing industries and agriculture move to its satellite cities. Based on this concept, Brabyn and Jackson (Citation2019) revealed a match between regional development and population change demonstrating that places growing in population attract investment. Alternatively, regional investment (or lack thereof) may change migration patterns. A number of studies have also stated that public facilities significantly influence the distribution of population, manufacturing, production, and service industries (Tsai Citation2014; Li et al. Citation2021; Saxena, Jat, and Clarke Citation2021).
The analysis of the drivers of net migration indicates the importance of economic conditions, lifestyle, and access to essential services, which should be considered when planning regional change. Since information on various aspects of regional socio-economic and spatial development is collected for diverse purposes, this creates difficulties when combining heterogeneous datasets and explains the scarcity of successful empirical research on regional development analysis. In this regard, the process of regional socio-economic and spatial development scenario building should involve a scoping study addressing comprehensive analysis and quantitative simulations of the study area to develop qualitative storylines of expected and desired changes. The results can then be represented in maps or Geographic Information Systems (GIS), which are crucial in communicating spatial information that cannot be properly conveyed by text or numbers (Xinyan et al. Citation2019). Moreover, the ideas generated by the scoping study scenario building are well described, structured, and parameterized and can be successfully used for quantitative simulations (Mora et al. Citation2020).
Recent advances in GIS technology enable to manipulate large amounts of heterogeneous data and construct the topological structure underlying complicated spatial phenomena (Wang Citation2022a). The technology integrates common dataset operations with the benefits of unique visualization and geographic analysis offered by maps. The GIS spatial modeling capabilities are beginning to improve such analyses and to extend their sophistication across the field (Bateman, Lovett, and Brainard Citation2003), which makes GIS technology and GIS-built databases valuable in explaining events, planning strategies, and predicting outcomes. Nevertheless, the capabilities of the state-of-the-art GIS are occasionally limited in advanced spatial and socio-economic scenario-based modeling. In this regard, cellular automata (CA), a cell-based method used to model two-dimensional space, has attracted growing attention in scenario-based regional planning (Li and Yeh Citation2000; Aburas et al. Citation2016; Shafizadeh-Moghadam et al. Citation2017; Avin and Goodspeed Citation2020) because it can be easily integrated with the GIS environment (Alsharif and Pradhan Citation2014; Aburas et al. Citation2016). The capability to model complex dynamic systems as well as flexibility and the ability to integrate the spatial and temporal dimensions of the processes are primary reasons for the widespread application of the CA method to stimulate future spatial changes (Santé et al. Citation2010).
Despite its indisputable advantages, the conventional CA method is not strong enough to create realistic simulations of future spatial changes because of such limitations as simplicity of the overall structure and its inability to apply quantitative socio-economic factors for modeling multiple scenarios of regional spatial development. Hence, traditional models based on the CA method should be modified (Clarke, Hoppen, and Gaydos Citation1997) and combined with quantitative systems to achieve better results (White and Engelen Citation2000), which can be accomplished by using quantitative factors apart from dynamic factors and by considering both spatial and temporal rules (Mohammadi, Sahebgharani, and Malekipour Citation2013). To overcome these limitations and improve simulation accuracy, the conventional CA-based models are integrated with advanced models (e.g. Markov Chain (MC); logistic regression (LR); frequency ratio; analytic hierarchy process (AHP); slope, land use, exclusion, urban extent, transportation, and hillshade (SLEUTH); artificial neural network, agent-based model, binomial logistic regression, and support vector machines). These integrated models include predictive variables affecting the dynamics of socio-economic and spatial transformation (Aburas et al. Citation2016; Saganeiti et al. Citation2021).
Currently, the contradiction of sparse population, large deposits of natural resources, vast spaces of Asian regions of Russia, and need in the development of efficient relationships among different regional elements of existing and planned production chains led to the valorization of socio-economic and spatial planning change in the country. Since domestic policymakers have highlighted the socio-economic and spatial development of the Far East as being of red-hot policy interest, this is a useful case-study area.
Here, we reveal a formal planning-constrained modeling framework based on the use of spatial datasets derived from GIS-built database combined with open-source GIS software that implements integrated cellular automata algorithms for the generation and further analysis of socio-economic and spatial scenarios of regional development and then apply it to Primorsky and Khabarovsk Krais located in the Russian Far East (Asian Russia).
This paper describes a Spatial and Socio-Economic Development Framework (SSEDF) method based on GIS data processing and integrated CA modeling. Compared to conventional CA models, the proposed CA model provides more flexibility, intuitiveness, and ability to model complex systems simulating multiple scenario-based plans of regional spatial development and economic growth patterns. To some extent, it is similar to the CA-AHP model (Mohammadi, Sahebgharani, and Malekipour Citation2013) that provides strong integration and good accuracy (Aburas et al. Citation2016). Both models rely on experts’ and stakeholders’ opinion when developing relation rulesand defining weights and socio-economic and spatial driving factors, and effectively use land suitability maps according to multiple criteria (e.g. social, environmental, economic, and weights). The main difference is their operation steps. The integration of spatial, time-dependent, and socio-economic factors by means of qualitative and quantitative relation rules allowed the proposed CA model to avoid complex operation steps used in other integrated CA models (Aburas et al. Citation2016). The introduction of conditional statements and rules connecting economic, social, and spatial factors of a territory in the proposed integrated CA model improved the results of land use simulation. The follow-up cost-benefit and cost-effectiveness analysis of the simulated multiple scenario-based plans enabled to find the least-cost scenario-based plan of regional spatial and socio-economic development to be implemented in order to achieve the SDS goals most efficiently, in due time, and at a lower cost. The SSEDF method does not pretend to address all the problems associated with weak planning systems, yet it considers many of them, including issues of inclusion and socio-economic and spatial development. The SSEDF method was initially developed in 2020–2021 to address a gap in strategic planning of socio-economic and spatial development, which is commonly observed in transshipment and raw material resource-based regions of Asian Russia. The method was first applied in the Novosibirsk region, Russia, in 2021, and then further improved. The SSEDF’s main assignment is to serve large territories (e.g. regions and countries) having difficulties or unable to implement sound socio-economic and spatial development plans according to a predefined policy discourse or approved development strategies, a situation currently occurring in Asian regions of Russia and, more in general, in global Asia. The SSEDF method enables to (i) capture and analyze the system of topographical and special objects and relations between socio-economic and spatial factors in a given territory; (ii) evaluate the spatial structure of the territory that empirically emerges from the analysis; (iii) model and estimate different scenarios characterizing the targeted level of socio-economic and spatial development of the territory; and (iv) formulate strategic socio-economic and spatial planning recommendations or development actions according to identified priorities.
The paper is organized as follows: First, we introduce the spatial and socio-economic profiles of the study area. Second, we reveal the priority development sectors and driving factors of the study area and describe how the operational spatial datasets were generated, validated, and used. Third, we discuss the scenario-building process within the context of the Khabarovsk and Primorsky Krais and describe the SSEDF method for extracting quantitative information from qualitative narratives formulated to describe socio-economic and spatial scenarios of regional development and inter-regional cooperation. Fourth, we give spatial representations of these scenarios as alternative ways of regional socio-economic and spatial development and inter-regional cooperation mapped for the two eastern regions of Asian Russia. The research results can provide policy suggestions for the coordinated development of regional economic integration. The main contribution of the study is the suggestion of a novel approach to improve simulation capability of the integrated CA-based models.
2. Materials and methods
2.1. Study area
The two regions in this study are Primorsky and Khabarovsk Krais located in the Russian Far East, . The study area covers 952,306 km2 and belongs to Asian Russia. The krais were chosen as a case study for investigating the level of spatial and socio-economic development of the territories because the region is a subject of significant public investment activity, which requires a better understanding of the linkages and feedback mechanisms between spatial and socio-economic factors.
Figure 1. The study area. (a) Asian Russia, (b) Primorsky and Khabarovsk Krais.
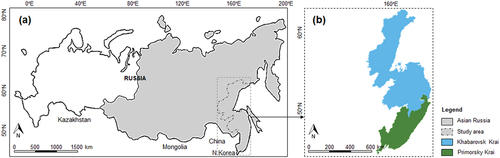
Primorsky Krai borders China and North Korea in its southwestern corner and Khabarovsk Krai in the north. It has the largest and most balanced economy among the regions of the Russian Far East. The krai’s compact territory is well endowed with infrastructure. Its road network is 11,117 km. The total length of the railways is 1,625 km. Shipping companies provide 80% of marine shipping services in the Russian Far East. Most of the territory is mountainous, 79% of the region is forested. The main source of electricity in the area is thermal power plants with total generation capacity of 2,777.8 MW. The region’s proximity to Pacific Rim markets gives it an edge in developing foreign trade with Japan, China, and South Korea. Major trade items include ferrous metals, seafood, and timber products.
Khabarovsk Krai is bordered by Magadan region to the north, Sakhalin region to the east, Primorsky Krai to the south, Amur region, Jewish Autonomous region, and the Sakha Republic to the west. The north of the krai is occupied by a vast mountainous area. The forests cover more than 67% of the territory. The krai’s road network is 10,950.1 km. The region is the most industrialized territory of the Russian Far East, producing 30% of the total industrial products in the Far Eastern Economic Region (large-scale aircraft-building, shipbuilding, and metal cutting and foundry machines enterprises). The region’s main source of electricity is thermal power plants with a total generation capacity of 2,231.3 MW. The territory of the krai is rich in mineral resources (e.g. coal, gold, wolfram, non-ferrous metals, chrome, ore, limestone, tin, marble, and granite).
Major industrial activities of the study area are shown in .
Table 1. Key production industries of the study area.
2.2. Data collection
The main dataset used in the paper is a digital topographic map derived from a 2016 survey by the Federal Service for State Registration, Cadastre and Cartography (Federal Spatial Data Fund of the Federal Scientific and Technical Center for Geodesy, Cartography and Spatial Data Infrastructure) covering the territory of Siberia and the Far East. Digital topographic maps were used to generate basic layers and for geo-referencing. The map was updated in GIS “Panorama” through panchromatic and multispectral satellite images with resolution ranging from 30 to 70 m (JSC “Russian Space Systems”). To improve the results of the socio-economic scenarios and regional development simulation the updated digital map was supplemented with non-topographic datasets derived from official open sources ( in Appendix) and then incorporated into the GIS database designed for socio-economic modeling and spatial development of the Asian regions of Russia (Certificate of State registration #2022621350). The database has over 18.0 million items represented in 28 separate thematic layers at a scale of 1:100,000.
All datasets were projected into geographic coordinate systems—State Coordinate System 2011 (GSK-2011) and World Geodetic System 1984 (WGS84)—with a common spatial resolution of 100 m.
2.3. Data preparation and analysis
The scoping study and the analysis of the research on strategic socio-economic and spatial development of Primorsky and Khabarovsk Krais (Vorozhbit et al. Citation2018; Chichkanov and Belyaevskaya-Plotnik Citation2018; Prokapalo et al. Citation2021, Citation2022; Isaev Citation2022) revealed the list of regional priority development areas:
Transport and logistics infrastructure
Settlement transport accessibility
International transit cargo flows
Petrochemical and gas chemical industry
Shipbuilding clusters
Fishing and aquatic food production
Fish and seafood processing industries
Advanced wood processing
Organic farming and livestock production
Energy and utility infrastructure
Mechanical engineering
Aircraft manufacturing
Ferrous and non-ferrous metallurgy.
These driving factors were taken into consideration when modeling socio-economic scenarios of regional development and inter-regional economic cooperation.
According to the scoping study, regional and local experts and stockholders formulated qualitative rules allowing the economic assessment and valuation of the study area. Once the rules were quantified, each then was expressed as a conditional statement that was applied to the relevant digital datasets, as illustrated in .
Then, the territory of Primorsky and Khabarovsk Krais was divided into 23,696 unit areas using a grid with a grid cell of 10 × 10 km, .
Figure 2. Data preparation. (a) division of the study area into unit areas, (b) the size of the grid cell, (c) analyzed area.
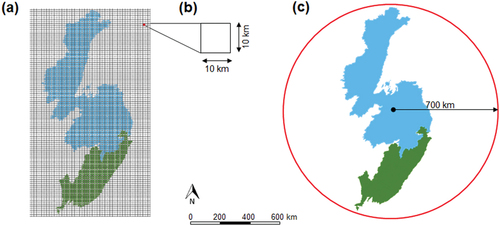
The area used for building accessibility maps was inscribed within a circle with radius of 700 km from the center of the study area, . To exclude noises caused by the semantic data of the adjacent territories, all of the analyzed layers were tailored to the study area in GIS “Panorama”.
To model socio-economic scenarios quantifying the consequences of alternative inter-regional development trajectories, 10 × 10 km grid-based thematic maps representing cost and accessibility of a unit area to key infrastructures and resources (e.g. settlements, natural resources, industrial enterprises, and power lines) were developed from topographic maps using the standard cost distance functions available in GIS “Panorama” (see and .
Figure 3. Building accessibility maps from topographic maps: (a) railway, (b) accessibility to the railway, (c) fluvial network, and (d) accessibility to navigational rivers.
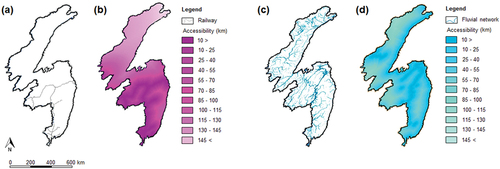
The cost maps identified the current state of the unit area having numerical description of its topographical and non-topographical objects, while accessibility maps captured the potential of the unit area, showing its proximity to key infrastructures and industrial clusters.
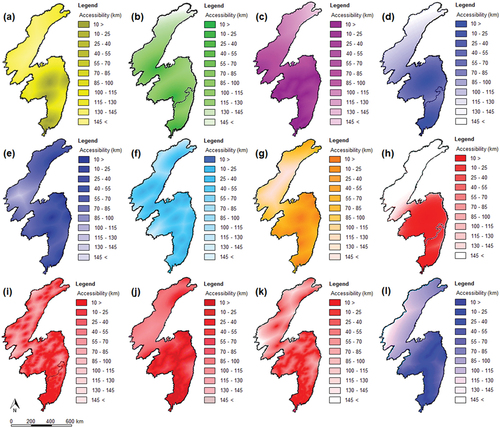
Thus, each of the developed cost and accessibility maps (layers) contained unique information related to the unit areas of the study region, as shown in .
Figure 4. Accessibility maps: (a) systemically important enterprises, (b) fishing and aquatic food production enterprises, (c) railways, (d) aircraft manufacturing enterprises, (e) river and seaports, (f) airports, (g) power generating companies, (h) shipbuilding enterprises, (i) settlements, (j) paved roads, (k) electric power lines, and (l) oil pipelines.
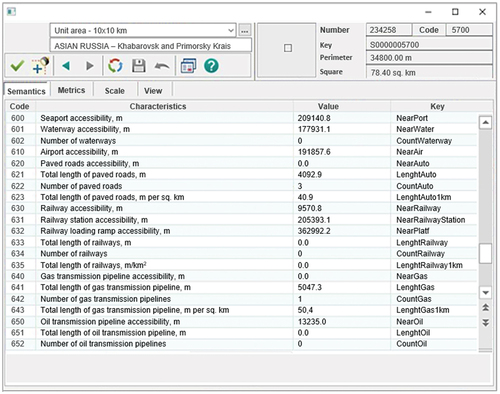
From the developed sets of cost and accessibility maps, all semantic issues belonging to the unit areas were then incorporated into the Grid-Based Database (GBD) coherent with the grid forming the unit areas, . Because the data were then processed in WGS84 projection, the squares of the unit areas generated in GSK-2011 were different. Thus, to ensure unbiased comparison, all numeric data in GBD were calculated per square kilometer of a particular unit area.
Figure 5. Description of a unit area in the grid-based database.
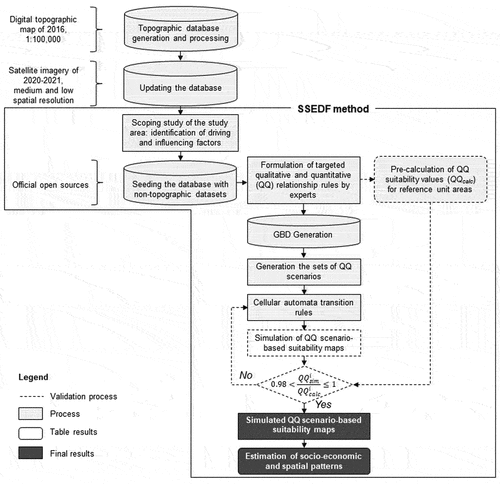
These data were analyzed using the SSEDF method allowing the extraction of quantitative information from qualitative narratives formulated to describe socio-economic and spatial scenarios of regional development (e.g. frequency and percentage counts, correspondence and residual analyses, and selected unit area metrics). The data and processes implemented are shown in .
Figure 6. Methodological flowchart. Generation of graded suitability maps from an integrated CA and scenario-based model.
2.4. SSEDF method
The scenario-based level of spatial and socio-economic development of the territory was estimated using Spatial and Socio-Economic Development Framework (SSEDF) method. The SSEDF method was designed to support national and regional government decision-making by setting out a spatio-economic vision of development and strategy specific to a given region with a view to maximizing the benefits from public and private investments, and bringing spatially balanced (in terms of best location) and efficient regional development patterns.
The SSEDF method is based on the combination of two techniques:
The socio-economic and spatial multi-criteria evaluation is an expert- and stakeholder-based formulation of qualitative and quantitative (QQ) relation rules to connect socio-economic and spatial factors (as conditional statements applied to relevant digital datasets), enabling economic and spatial assessment of the study area. The rules are used to analyze social, economic, and spatial factors, evaluate their availability, and identify targeted clusters strategically interconnected within a given region. The technique provides an unbiased and overall vision of the actual socio-economic and spatial situation in the region and the study area.
The cellular automata model is used to simulate and forecast regional development patterns. The CA model of the study area is represented as a 10 × 10 km grid-based database. Each cell of the GBD contains the number of the objects belonging to the unit area, their quantity attributes, and distances from the center of the unit area to the nearest topographic and non-topographic objects located within and beyond its borders.
According to , the SSEDF method includes the following steps:
The socio-economic and spatial analysis starts with the scoping study of the region through the collection and organization of existing data, including approved plans, strategies and policies related to socio-economic and spatial development at national and regional levels. As a result, the main socio-economic and spatial driving factors of the study area are defined.
In line with the defined driving factors, the database is updated with non-topographic data and datasets taken from the official open sources.
The socio-economic and spatial multi-criteria evaluation of the study area is organized by gathering national, regional, and local experts and stakeholders. The latter familiarize themselves with the SSEDF method, discuss preliminary results of the scoping study, suggest and develop QQ relation rules that insure the connection of socio-economic and spatial driving factors, develop the QQ sequences (scenarios), define GBD characteristics (e.g. size of a grid cell, coordinate system, accessibility step, and distance threshold), and select the location of reference unit areas. The developed QQ relation rules allow socio-economic and spatial multi-criteria assessment and valuation of a unit area.
The emerging socio-economic and spatial structure of the region, visualized as scenario-based graded suitability maps, results from the combination of the CA model and the sets of QQ-based scenarios used as its transition rules. Before a QQ relation rule is brought into play as a CA model transition rule it should be validated. Therefore, suitability values (QQcalc) of the selected reference unit areas are pre-calculated and then compared with those (QQsim) obtained for the same unit areas when the QQ relation rule is applied as a CA model transition rule. The QQ relation rule is accepted if QQcalc ≠ 0 and QQsim/QQcalc lies within the interval (0.98, 1]; otherwise, it should be adjusted or removed.
Based on the emerging socio-economic and spatial structure, strategic recommendations are formulated on where priority investments should be made. They form the basis for elaborating the socio-economic and spatial action plans, which should take into consideration on-going or planned interventions.
In the end, the SSEDF is validated through a workshop bringing together experts, regional decision-makers, practitioners, and stakeholders, and then disseminated.
2.5. Data processing
To process data incorporated into the GBD we used QGIS, an open-source GIS, which allowed the development of our own software.
For this purpose, the generated in GIS “Panorama” grid-based database and the uniform grid representing unit areas were exported to QGIS as MIF/MID and MTV files. In this regard, the coordinates of the uniform grid were re-projected from the GSK-2011 into the WGS84 for further modeling, spatial analysis, and QQ-based scenario generation. MIF/MID files represented the GBD. The MTV file contained the information about the coordinates of the generated unit area grid.
A classical cellular automata system consists of a regular lattice of sites – cells, states, neighborhoods, and rules (Von Neumann Citation1966; Jørgensen and Fath Citation2008). In our case, cells are the unit areas that manifest some adjacency or proximity. The state of a cell (unit area) is derived from cost map values and can change according to the formulated QQ relation rules (). Neighborhood relations of the unit area are represented by accessibility map values. Both cost and accessibility values are stored in the GBD. Standard cellular automata is generalized as follows (Li and Yeh Citation2000):
where S is the set of all possible states of the cellular automata, N is the neighborhood of all cells providing input values for the function f, and f is the transition function that defines the change of the state from t to t + 1. In our study, the rule-based structure of this type of cellular automata is defined as
where Sx,y is a state of the cellular automata in the grid cell (unit area) with coordinates {x, y}, n is the number of thematic layers taken from the GBD for joint processing under a chosen socio-economic and spatial development scenario, Vx,y is the value estimate (suitability value) of the particular unit area with coordinates {x, y} in the thematic layer l, and math.ceil() is the procedure that rounds a number upward to the nearest integer. Here Sx,y ∈N0 ={0, 1, 2, 3, 4, 5} where 0 means that the unit area does not meet the requirements of the QQ-based scenario (totally unsuitable), conversely 5 means the fully met requirements (most suitable), and Vx,y∈ [0, 5]. Value estimate (+)Vx,y represents the compliance level of the unit area to the formulated QQ relation rules and is expressed as follows
where Rlk is a suitability value matching the QQ relation rule formulated for a particular thematic layer l, vx,y is the value taken from the cell (unit area) of the GBD with coordinates {x, y} belonging to the thematic layer l or its allocated area, and min v and max v are the minimum and maximum values in the cells (unit areas) belonging to the thematic layer l. Rlk ∈N0 ={0, 1, 2, 3, 4, 5}.
In scenarios that consider the deficiencies of unit areas – (–)Vx,y, the suitability values of QQ relation rules should be inversed (i.e. 0 becomes 5, 1 becomes 4, 2 becomes 3, etc.), and the (–)Vx,y is calculated as
Scenarios are generated according to the driving factors of the study area and formulated QQ relation rules that connect socio-economic and spatial factors, . For instance, a scenario that considers populated (A.1) unit areas that have a well-developed basic infrastructure (railways (E.1), paved roads (E.2) and river transport (E.3)) is represented as
A scenario that takes into account uninhabited or underpopulated unit areas the suitability values of QQ relation rules formulated for A.1 (populated areas) should be inversed. In this case, the scenario is represented as (A.1)in. Thus, a scenario that considers underpopulated (A.1)in unit areas that have arable lands (C.1) is described as
In order to make cellular automata more sensitive to the impacts of particular items (e.g. seasonality, pipeline capacity, railway capability, and drops in navigational water levels) EquationEquation (2)(2)
(2) can be expressed as
where wlk is the weight factor of the particular item of the developed scenario in the layer l, wlk ∈ (0, 1], The weight factors rely on expert’s opinion by answering the Analytic Hierarchy Process (AHP) form.
Thus, in coupling GIS with an integrated CA model, the latter serves as an analytical engine, providing a flexible framework for building socio-economic and spatial scenarios, and QGIS visualizes the results of the modeling as graded suitability maps.
2.6. Validation of the CA model
The validation of the integrated CA model based on multiple scenarios was carried out according to the principle of equifinality (Dzhurka Citation2022). First, the suitability values of a number of pre-selected reference unit areas were calculated according to a particular scenario using GIS “Panorama.” The calculated values were double-checked and approved by regional experts and stakeholders. Then, the Kappa coefficient was calculated to check the accuracy and validity of the CA models. Depending on the scenario, the value of the Kappa coefficient varied from 0.981 to 0.993. As stipulated by the United States Geological Survey classification scheme (Anderson et al. Citation1976) the simulation is acceptable when the value of Kappa index is greater or equal to 0.85. Hence, it was concluded that the developed CA model was accurate and capable of the simulation suitability maps.
2.7. Visualization of socio-economic scenarios of regional development as graded suitability maps
The grid-based database captured the current and potential states of a certain unit area lying within the study region, and the use of cellular automata made it possible to model the involvement of the unit areas that met the QQ-based scenario requirements into different socio-economic activities. Based on the results of the scoping study 39 thematic layers were generated in the GBD, , which allowed 39n possible combinations of different groups of socio-economic scenarios, where n is the number of layers included into a particular scenario.
In the study, we examined 55 QQ-based scenarios that combined from 2 to 7 different thematic layers, . The QQ-based scenarios were built according to the requests of Potential Investors (PI) and Regional Authorities (RA) that had been previously formulated in the research on strategic socio-economic and spatial development of the study area (Vorozhbit et al. Citation2018; Chichkanov and Belyaevskaya-Plotnik Citation2018; Prokapalo et al. Citation2021, Citation2022; Isaev Citation2022). The scenario indices used to determine the unit areas that had a sufficient degree of marketability to take care of the needs of the potential investors or pending requests from regional authorities were not intended to be fixed or prescriptive but to capture the territories best suited to the conditions of socio-economic and spatial development.
The scenarios demonstrate an attempt to quantify the narratives summarized in and are used here to represent the spatial modeling method. In this study, the QQ-based scenarios were built for those socio-economic drivers of positive changes in the study area that could ensure the generation of new or stimulation of existing production chains incorporated into regional or inter-regional industrial clusters.
In order to use the QQ-based scenarios as a basis for quantifying the level of socio-economic and spatial development of a unit area we next needed to transform them into graded suitability maps. Our QGIS model used a two-step process that started with QQ relation rules to act as CA transition rules followed by a grading process to identify the suitability value of a unit area.
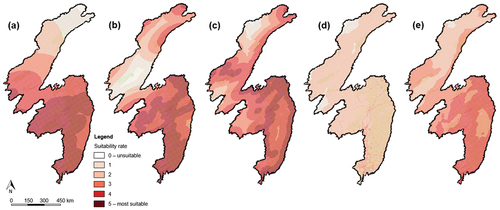
Each socio-economic and spatial driving factor had a series of six QQ relation rules indexed from 0 (totally unsuitable) to 5 (most suitable) to determine the suitability level of a unit area. The relation rules were expressed as conditional statements that were applied to the relevant digital datasets (thematic layers) of the GBD to produce a series of Boolean values and find the relation rule that meets all of the conditional rules for that driving factor. Then, the rule’s index was assigned to the correspondent unit area of the suitability map. For a multi-factor scenario, the resulting value assigned to the unit area of the suitability map was calculated as an arithmetic mean of all defined indices, which was then rounded to the nearest integer. Visualization results of the graded suitability maps generated in accordance with some QQ-based scenarios and then combined with a geographic map are shown in .
Figure 7. Generation of suitability maps according to defined scenarios. (a) developed railway net – E.1, (b) developed paved road net – E.2, (c) developed river and sea transportation net – E.3, (d) populated areas – A.1, (e) populated areas with developed railway, paved road, river and sea transportation nets – E.1 + E.2 + E.3 + A.1.
3. Results
The SSEDF method enabled to estimate the potential of the study area for regional socio-economic and spatial development and inter-regional cooperation using our own open-source software for QGIS, integrated CA model, GBD, and QQ-based relation rules for multiple socio-economic and spatial scenario generation and simulation.
Among the driving factors that contributed to regional development, population density, access to basic and transport infrastructure, and power supplies were estimated to have greater importance on inter-regional cooperation processes within the study area.
The two groups of scenarios based on investor requests and regional authorities’ intentions were revealed from the previously done research on strategic socio-economic and spatial development of the study area and following scoping study. Each scenario identified the best-suited unit areas in the Khabarovsk and Primorsky Krais supplemented with their coordinates, transport connectivity, and detailed topographic and non-topographic information. These two groups of scenarios and generated suitability maps had notable differences.
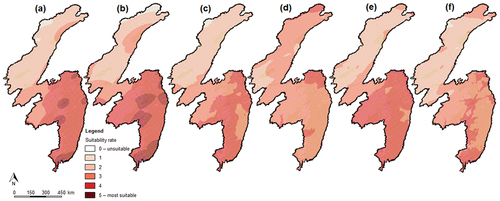
The graded suitability maps generated according to PI scenarios showed that industrial inter-regional cooperation in the fields of shipbuilding, aircraft manufacturing, fishing and aquatic food production, and international transit cargo flows was available in the central and southern regions of the study area, . Industrial expansion here was a common feature and was particularly marked in densely populated areas with existing transport infrastructures, accessibility to systematically important enterprises, and sustainable power supplies (.
Figure 8. Visualization of graded suitability maps according to PI scenarios. Unit areas that: (a) have access to sea and air transport, shipbuilding clusters, and uninterrupted power supply – D.5 + E.5 + E.6 + B.1, (b) have access to railway and air transport – E.1 + E.5, (c) are well populated and have access to railway and air transport, fishing and aquatic food production enterprises, and uninterrupted power supply – D.1 + E.1 + E.5 + B.1 + A.1, (d) have uninterrupted power supply but no systemically important enterprises – B.1 + (D.7)in, (e) are well populated, have fishing and aquatic food production enterprises, access to railway transport, developed paved road net, and uninterrupted power supply – D.1 + E.1 + E.2 + B.1 + A.1, (f) are well populated and have uninterrupted power supply – B .1 + A.1.
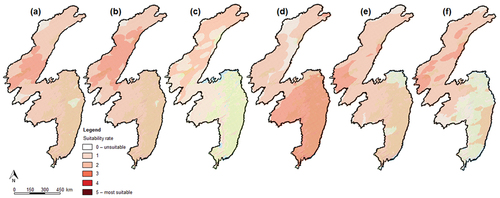
Table 2. Suitability rate of the unit areas identified under PI scenarios.
The GBD structure made it possible to trace transport connectivity between neighboring unit areas automatically, which is essential when forming industrial clusters. The results of the targeted scenario processing enabled to connect adjacent unit areas with suitability values 4 and 5 into industrial clusters. The analysis of the PI-based graded suitability maps (unit areas with suitability rates 4 and 5) and the comparison of obtained numerical data show that southern part of Khabarovsk Krai and all Primorsky Krai have high chances in establishing successful shipbuilding (41.9% of the specified area), aircraft manufacturing (37.9%), and railway and maritime transportation (46.5%) cluster cooperation. Generally, from 6% to 14.7% of the study area meet investor requirements. Under the stipulation that regional authorities promote favorable economic, social, and labor conditions for inducing the population growth, inter-regional cooperation in fishing and aquatic food production may attract investment in spatial development of 42.4% of the territory, .
Figure 9. Inter-regional cluster cooperation. (a) shipbuilding, (b) international transit cargo flows, (c) aircraft manufacturing, (d) fishing and aquatic food production.
The graded suitability maps generated according to RA scenarios revealed the main problems of the northern territories of the Khabarovsk Krai and priority measures to be taken in order to integrate its sparsely populated areas into primary economic activities. The analysis of the generated graded suitability maps based on RA scenarios of socio-economic and spatial regional development (unit areas with suitability rates 4 and 5), and the comparison of obtained numerical data show that the northern part of Khabarovsk Krai suffers a number of basic infrastructure problems. According to the conclusions made from the analysis of generated suitability maps and calculated numerical data, regional authorities and policymakers should focus on the spread of inter-settlement paved road network (49.2% of the specified territory is populated but has no access to paved roads); construction of power generating facilities and development of electricity transmission network infrastructure (79.2% of populated and 23.1% of undersized areas are pressed for power supply); establishment of local backbone enterprises in the populated areas (64.7% of settled areas with good transport infrastructure have no backbone enterprises), , . Otherwise, the situation may be compounded by further out-migration.
Figure 10. Visualization of graded suitability maps according to RA scenarios. Unit areas that: (a) are well populated and have no access to developed paved road net – A.1 + (E.2)in, (b) are populated and have no uninterrupted power supply – A.1 + (B.1)in, (c) are populated, have access to railway transport and developed paved road net, but have no systemically important enterprises – (D.7)in + E.1 + E.2 + A.1, (d) are populated and have systemically important enterprises – D.7 + A.1 (e) have systemically important enterprises that suffer power supply – D.7 + (B.1)in, (f) are populated and suffer power supply A.1 + (B.1)in.
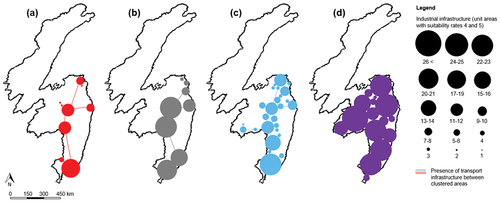
Figure 11. Regional spatial development of populated areas. (a) construction of paved road network, (b) construction of power generating facilities, (c) development of electric power network infrastructure, (d) establishment of backbone enterprises.
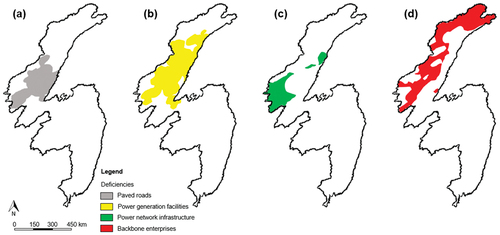
Table 3. Suitability rate of the unit areas identified under RA scenarios.
In general, the validation of the CA transition rules based on the formulated QQ relation rules proved their applicability and efficiency. As a rule, the average deviation between the pre-calculated and simulated by the CA model values for reference unit areas was less than 2%, . Nevertheless, the obtained results show that the use of generated suitability maps is preliminary.
It turned out that some of the formulated QQ relation rules used as CA transition rules in the SSEDF method demonstrated weak points in processing polygonal objects (e.g. large cities and arable lands) if they had been divided into different unit areas by the 10 × 10 km grid. In two cases, when the grid divided large cities (A.1), arable lands, and agricultural fields (C.1), the CA transition rules failed to model the real situation properly.
The small number of large cities divided into 2–5 unit areas made it possible to recalculate the population density values for all adjoining unit areas, and then enter them into the correspondent cells of the GBD. The found solution allowed further application of A.1 scenarios based on the previously formulated QQ relation rules.
Since there was a large number of arable lands and fields divided by the grid into different unit areas, all of the multiple scenarios that included C.1 were removed from further analysis of the generated suitability maps.
4. Discussion
In this paper, we describe a SSEDF method to extract quantitative information from qualitative narratives formulated to describe socio-economic and spatial scenarios of regional development and inter-regional industrial cooperation, illustrating its use on the example of Khabarovsk and Primorsky Krais. It was demonstrated that the functionality provided by GIS coupled with an integrated CA model could considerably enhance the incorporation of spatial, economic, and other heterogeneous and supplementary datasets in a grid-based database for further data analysis and visualization as graded suitability maps combined with geographic maps. The developed GBD also lifted the legal restrictions connected with the disclosure of sensitive information, making the application of the SSEDF method accessible to a wide range of users.
The CA transition rules were based on the QQ relation rules formulated by regional and local experts and stakeholders for all of the defined social, economic, and spatial driving factors. Among the most important driving factors, contributing to regional development and inter-regional cooperation processes, the experts and stakeholders marked population density, access to basic and transport infrastructure, and power supplies.
The QQ relation rules insured the connection of socio-economic and spatial driving factors of the study area, which allowed multi-criteria assessment and valuation of a unit area. Each socio-economic and spatial driving factor had a series of six QQ relation rules expressed as conditional statements applied to the relevant digital datasets of the GBD to produce a series of Boolean values and find the relation rule that met all of the conditional rules for that driving factor.
Two groups of multi-factor socio-economic and spatial scenarios initiated by investors and regional authorities were formulated and parameterized in order to estimate alternative socio-economic and spatial development plans and strategies for two of the Far Eastern regions of Asian Russia. Multi-factor scenarios consisted of a sequence of QQ relation rules that best met all of the conditional rules of the analyzed driving factors.
The graded suitability maps generated under PI scenarios show that the central and southern regions of the study area are most suited for industrial inter-regional cooperation. Industrial expansion here was marked in densely populated areas with existing transport infrastructures, accessibility to backbone enterprises, and sustainable power supplies. The analysis of the PI scenarios shows that the specified area of Khabarovsk and Primorsky Krais has good prospects for establishing successful shipbuilding, aircraft manufacturing, railway and maritime transportation cluster cooperation. Currently, up to 14.7% of the study region meet investor requirements with unit areas having suitability values 4 (very suitable) and 5 (most suitable). Although the PI scenarios show large potential in the development of industrial inter-regional cooperation in the central and southern regions of the study area, the issue of labor inflow is essential because each PI scenario includes the same population.
The graded suitability maps generated according to RA scenarios reveal key infrastructure problems in the northern part of the Khabarovsk Krai. The analysis of the specified territory identified priority measures to be taken in order to integrate its sparsely populated areas into primary economic activities. According to the conclusions made from the analysis of RA scenarios, regional authorities should focus on the development of inter-settlement paved road network, establishment of local backbone enterprises, construction of power generating facilities and electricity transmission network.
The scenarios presented and underlying principles of their construction show how it is possible to connect socio-economic and spatial factors and move to targeted multi-factor quantitative analysis of the territory initiated by different groups of actors.
Further refinement of the scenario-building technique is possible by introducing new quantitative rules, and use of predefined scenario-based datasets. From the modeling standpoint, predefined QQ relation rules and their parameters heavily depend on the study area, which is why they should be recalibrated during phase 3 of the SSEDF method and then validated before applied for the analysis of a new region. Formulation of the qualitative rules and quantitative expressions describing the state of the study area as well as data used for scenario generation need careful consideration with respect to their scale and quality (Swetnam et al. Citation2011; Myadzelets Citation2018).
One further issue not dealt with explicitly in this paper is the storage of old GIS databases in the databank, which will make it possible to use the presented integrated CA model coupled with other models for simulating dynamics of spatial development. Combined with the SSEDF method, they will be able to simulate suitability maps generated for driving socio-economic and spatial factors taking into account tendencies and dynamics of the evolving processes (Alsharif and Pradhan Citation2014). According to Aburas et al. (Citation2017), the integrated CA-AHP, CA-LR, and CA-SLEUTH models provide good solutions in terms of multi-scenario simulation of spatial and socio-economic development. Among them, the integrated CA-AHP model has very strong advantages in effective use of suitability maps for spatial development according to multiple environmental, dynamic, and socio-economic criteria and weights of factors; so far, it has not been widely applied and described in the literature (Aburas et al. Citation2016).
The complexity of spatial and socio-economic patterns makes simulating future changes using just one approach difficult, which necessitates the integration of a set of models to provide a flexible environment for the analysis and simulation of social, economic, and spatial phenomena.
5. Conclusions
Spatial planning research is important for understanding regional economic space dynamics and the identification of inter-regional economic clusters. This study demonstrates that coupling GIS technology with integrated CA models can be used to simulate regional development based on different socio-economic and spatial scenarios of inter-regional cooperation. The study has suggested that programming the cellular automata inside a GIS can be used as an appropriate planning tool to model regional development under complicated and changeable factors. The results of modeling can provide convenient guidelines for policymaking and regional management in countries with transitional economies, especially in Asia where inter-regional socio-economic cooperation is rapidly expanding in a highly spread pattern.
The study results show that there is a need to broaden standard cellular automata models in solving regional problems based on the principles of sustainable development. Regional, inter-regional, and global constraints can be embedded in integrated cellular automata models and thus manage regional spatial development and inter-regional socio-economic cooperation.
The comparison of actual state of the study area and the results of simulated socio-economic and spatial development scenarios show that these models produce much better regional forms of socio-economic cooperation and spatial development in terms of compactness and resource conservation. The comparison also indicates that the models based on cellular automata have produced more plausible results than a previous model that we have developed for the Novosibirsk region (Musikhin Citation2022a, Citation2022b).
Thus, the coupling of integrated CA models with GIS is of mutual benefit. Cellular automata provides some lacking simulation models in GIS. In its turn, the use of GIS enables cellular automata to become more realistic by taking into consideration real-world data, socio-economic and spatial factors, and constraints in their modeling. The combination of quantitative rules used for the generation of multiple socio-economic scenarios of spatial development at regional and inter-regional levels provides a powerful alternative for territory assessment compared to traditional methods. The incorporation of various kinds of constraints in cellular automata enables planners and policymakers to compare the costs and benefits of different development scenarios that are necessary for the formulation of plans for sustainable inter-regional socio-economic cooperation. The development of cellular automata within GIS also greatly enhances the ability of dynamic spatial and socio-economic modeling within GIS.
Acknowledgments
We thank our three anonymous reviewers for careful reading of our manuscript and their many insightful comments and suggestions to improve its final version. We also extend our thanks to Olga Opritova and Sergey Taranenko from the Research and Production Cartographic Center who assisted us in the generation of the grid-based database and the development of open-source GIS software.
Disclosure statement
No potential conflict of interest was reported by the author(s).
Data availability statement
The full data are not available due to legal restrictions. Meanwhile, the participants of this study agreed to share publicly the allowed for open access datasets (Musikhin, Igor; Karpik, Alexander P. (2022): Socio-Economic Development of Asian Russia – datasets for Khabarovsk and Primorsky Krais. figshare. Dataset. https://doi.org/10.6084/m9.figshare.20416599.v1) and the open GIS source software package (Musikhin, Igor (2022): Socio-Economic Development of Asian Russia – open source software package (Cellular automata). figshare. Software. https://doi.org/10.6084/m9.figshare.20417019.v1).
Additional information
Funding
Notes on contributors
Igor Musikhin
Igor Musikhin received the PhD degree from the National Research Tomsk State University. His research interests are geoinformatics, photogrammetry, remote sensing, geographic information systems, as well as higher education and ESP.
Alexander Karpik
Alexander Karpik is the rector and a professor at the Siberian State University of Geosystems and Technologies who received his PhD degree from the Siberian State Academy of Geodesy. His research interests are data analysis, geomatics, surveying, and global navigation satellite systems.
References
- Aburas, M. M., S. H. O. Abdullah, M. F. Ramli, and Z. H. Asha’ari. 2017. “Land Suitability Analysis of Urban Growth in Seremban Malaysia, Using GIS Based Analytical Hierarchy Process.” Procedia Engineering 198: 1128–1136. doi:10.1016/j.proeng.2017.07.155.
- Aburas, M. M., Y. M. Ho, M. F. Ramli, and Z. H. Ash’aari. 2016. “The Simulation and Prediction of Spatio-Temporal Urban Growth Trends Using Cellular Automata Models: A Review.” International Journal of Applied Earth Observation and Geoinformation 52: 380–389. doi:10.1016/j.jag.2016.07.007.
- Alsharif, A. A. A., and B. Pradhan. 2014. “Urban Sprawl Analysis of Tripoli Metropolitan City (Libya) Using Remote Sensing Data and Multivariate Logistic Regression Model.” Journal of the Indian Society of Remote Sensing 42 (1): 149–163. doi:10.1007/s12524-013-0299-7.
- Anderson, J. R., E. E. Hardy, J. T. Roach, and R. E. Witmer. 1976. “A Land Use and Land Cover Classification System for Use with Remote Sensor Data.” Geological Survey Professional Paper 964.
- Avin, U., and R. Goodspeed. 2020. “Using Exploratory Scenarios in Planning Practice: A Spectrum of Approaches.” Journal of the American Planning Association 86 (4): 403–416. doi:10.1080/01944363.2020.1746688.
- Bateman, I. J., A. A. Lovett, and J. S. Brainard. 2003. Applied Environmental Economics: A GIS Approach to Cost-Benefit Analysis. Cambridge: Cambridge University Press. doi:10.1017/CBO9780511493461.
- Batey, P. W. J., and P. Friedrich, eds. 2000. Regional Competition. Berlin: Springer.
- Bell, S., and S. Morse. 2018. “Sustainability Indicators Past and Present: What Next?” Sustainability 10 (5): 1688. doi:10.3390/su10051688.
- Billaud, O., M. Soubeyrand, S. Luque, and M. Lenormand. 2020. “Comprehensive Decision-Strategy Space Exploration for Efficient Territorial Planning Strategies.” Computers, Environment and Urban Systems 83: 101516. doi:10.1016/j.compenvurbsys.2020.101516.
- Brabyn, L., and N. O. Jackson. 2019. “A New Look at Population Change and Regional Development in Aotearoa New Zealand.” New Zealand Geographer 75 (3): 116–129. doi:10.1111/nzg.12234.
- Chichkanov, V. P., and L. A. Belyaevskaya-Plotnik. 2018. “Priority Development Areas in the Context of the Economic Security of Macro-Region.” Economy of Region 14 (1): 227–242. doi:10.17059/2018-1-18.
- Clarke, K. C., S. Hoppen, and L. Gaydos. 1997. “A Self-Modifying Cellular Automaton Model of Historical Urbanization in the San Francisco Bay Area.” Environment and Planning B: Planning & Design 24 (2): 247–261. doi:10.1068/b240247.
- Diao, X. D., S. X. Zeng, C. M. Tam, and V. W. Y. Tam. 2009. “EKC Analysis for Studying Economic Growth and Environmental Quality: A Case Study in China.” Journal of Cleaner Production 17 (5): 541–548. doi:10.1016/j.jclepro.2008.09.007.
- Dzhurka, N. G. 2022. “Testing Alternative Models of Regional Economic Growth: The Boundaries of the Possible.” Spatial Economics 18 (1): 168–183. doi:10.14530/se.2022.1.168-183.
- Gjestland, A., I. Thorsen, and J. Ubøe. 2006. “Some Aspects of the Intraregional Spatial Distribution of Local Sector Activities.” The Annals of Regional Science 40 (3): 559–582. doi:10.1007/s00168-006-0073-7.
- Hanink, D. M. 1997. Principles and Applications of Economic Geography: Economy, Policy, Environment. New York: Wiley.
- Han, Z., S. Jiao, X. Zhang, F. Xie, J. Ran, R. Jin, and S. Xu. 2021. “Seeking Sustainable Development Policies at the Municipal Level Based on the Triad of City, Economy and Environment: Evidence from Hunan Province, China.” Journal of Environmental Management 290: 112554. doi:10.1016/j.jenvman.2021.112554.
- Hooimeijer, P. 1991. “Towards a Spatial Demography of Housing.” In Emerging Issues in Demographic Research, edited by G. Frinking and C. Hazeu. Amsterdam: Elsevier.
- Hotelling, H. 1929. “Stability in Competition.” The Economic Journal 39 (153): 41–57.
- Isaev, A. G. 2022. Экономический рост российских регионов: экзогенные и эндогенные источники [Economic growth of Russian regions: exogenous and endogenous sources]. Khabarovsk: Economic Research Institute of Far Eastern Branch of the Russian Academy of Sciences.
- Jørgensen, S. E., and B. D. Fath. 2008. Encyclopedia of Ecology. Amsterdam: Elsevier.
- Kuznetsova, O. V. 2019. “Problems of Elaboration of Spatial Development Strategy of the Russian Federation.” Spatial Economics 15 (4): 107–125. doi:10.14530/se.2019.4.107-125.
- Li, Z., L. Jiao, B. Zhang, G. Xu, and J. Liu. 2021. “Understanding the Pattern and Mechanism of Spatial Concentration of Urban Land Use, Population and Economic Activities: A Case Study in Wuhan, China.” Geo-Spatial Information Science 24 (4): 678–694. doi:10.1080/10095020.2021.1978276.
- Li, X., and A.G. -O. Yeh. 2000. “Modelling Sustainable Urban Development by the Integration of Constrained Cellular Automata and GIS.” International Journal of Geographical Information Science 14 (2): 131–152. doi:10.1080/136588100240886.
- Li, J. M., W. Z. Zhang, H. X. Chen, and J. H. Yu. 2015. “The Spatial Distribution of Industries in Transitional China: A Study of Beijing.” Habitat International 49: 33–44. doi:10.1016/j.habitatint.2015.05.004.
- Mohammadi, M., A. Sahebgharani, and E. Malekipour. 2013. “Urban Growth Simulation Through Cellular Automata (CA), Analytic Hierarchy Process (AHP) and GIS; Case Study of 8th and 12th Municipal Districts of Isfahan.” Geographia Technica 18 (2): 57–70.
- Mora, O., C. L. Mouël, M. D. Lattre-Gasquet, C. Donnars, P. Dumas, O. Réchauchère, T. Brunelle, et al. 2020. “Exploring the Future of Land Use and Food Security: A New Set of Global Scenarios.” PLoS One 15 (7): e0235597. doi:10.1371/journal.pone.0235597.
- Musikhin, I. 2022a. “Socio-Economic Development of Asian Russia - Datasets for Novosibirsk Region. Figshare.” Dataset. doi:10.6084/m9.figshare.20087693.v1.
- Musikhin, I. 2022b. “Socio-Economic Development of Asian Russia - Open Source Software Package. Figshare.” Software. doi:10.6084/m9.figshare.20088365.v1.
- Myadzelets, A. V. 2018. “Role of Territorial Remoteness, Economic and Social Factors in Development of Siberian and Northern Regions of Russia.” Paper Presented at the IOP Conference Series: Earth and Environmental Science 190 (1): 012060. doi:10.1088/1755-1315/190/1/012060.
- Pacuk, M., T. Palmowski, and M. Tarkowski. 2018. “The Emergence of Baltic Europe: An Overview of Polish Research on Regional Integration.” Quaestiones Geographicae 37 (2): 47–60. doi:10.2478/quageo-2018-0013.
- Prokapalo, O. M., A. B. Bardal, A. G. Isaev, M. G. Mazitova, and D. V. Suslov. 2021. “Economic Situation in the Far Eastern Federal District in 2020.” Spatial Economics 17 (2): 81–126. doi:10.14530/se.2021.2.081-126.
- Prokapalo, O. M., A. B. Bardal, M. G. Mazitova, and D. V. Suslov. 2022. “Economic Situation in the Far Eastern Federal District in 2021.” Spatial Economics 18 (2): 135–182. doi:10.14530/se.2022.2.135-182.
- Saganeiti, L., A. Mustafa, J. Teller, and B. Murgante. 2021. “Modeling Urban Sprinkling with Cellular Automata.” Sustainable Cities and Society 65: 102586. doi:10.1016/j.scs.2020.102586.
- Santé, I., A. M. García, D. Miranda, and R. Crecente. 2010. “Cellular Automata Models for the Simulation of Real-World Urban Processes: A Review and Analysis.” Landscape and Urban Planning 96 (2): 108–122. doi:10.1016/j.landurbplan.2010.03.001.
- Saxena, A., M. K. Jat, and K. C. Clarke. 2021. “Development of Sleuth-Density for the Simulation of Built-Up Land Density.” Computers, Environment and Urban Systems 86: 101586. doi:10.1016/j.compenvurbsys.2020.101586.
- Seliverstov, V. E., L. V. Melnikova, E. A. Kolomak, V. A. Kryukov, V. I. Suslov, and N. I. Suslov. 2019. “Spatial Development Strategy of Russia: Expectations and Realities.” Regional Research of Russia 9 (2): 155–163. doi:10.1134/S2079970519020114.
- Shafizadeh-Moghadam, H., A. Asghari, M. Taleai, M. Helbich, and A. Tayyebi. 2017. “Sensitivity Analysis and Accuracy Assessment of the Land Transformation Model Using Cellular Automata.” GIScience & Remote Sensing 54 (5): 639–656. doi:10.1080/15481603.2017.1309125.
- Stead, D. 2021. “Conceptualizing the Policy Tools of Spatial Planning.” Journal of Planning Literature 36 (3): 297–311. doi:10.1177/0885412221992283.
- Swetnam, R. D., B. Fisher, B. P. Mbilinyi, P. K. T. Munishi, S. Willcock, T. Ricketts, S. Mwakalila, et al. 2011. “Mapping Socio-Economic Scenarios of Land Cover Change: A GIS Method to Enable Ecosystem Service Modelling.” Journal of Environmental Management 92 (3): 563–574. doi:10.1016/j.jenvman.2010.09.007.
- Tsai, Y. H. 2014. “Location-Demand-Based Residential Floor Area Ratio Distribution Method.” Urban Studies 51 (12): 2685–2702. doi:10.1177/0042098013506048.
- Von Neumann, J. 1966. Theory of Self-Reproducing Automata. Urbana: University of Illinois Press.
- Vorozhbit, O. Y., N. Y. Titova, I. A. Kuzmicheva, and O. V. Shnaider. 2018. “Quantitative Assessment of Primorsky Krai Fishery Cluster Competitiveness Factors on the Basis of the Porter Model Transformation.” Journal of Social Sciences Research 5: 350–357. doi:10.32861/jssr.spi5.350.357.
- Walsh, J. 1997. “Assessing Field Remediation Economics with Integrated Data Analysis.” Earth Observation Magazine 6 (4): 16–19.
- Wang, Y. 2022a. “Environmental Economic Decision Support Information System Based on GIS.” In Cyber Security Intelligence and Analytics. CSIA 2022. Lecture Notes on Data Engineering and Communications Technologies, Z. Xu, S. Alrabaee, O. Loyola-González, X. Zhang, N. D. W. Cahyani, and N. H. Ab Rahman edited by. Vol. 123. Cham: Springer. doi:10.1007/978-3-030-96908-0_23
- Wang, Y. 2022b. “Population-Land Urbanization and Comprehensive Development Evaluation of the Beijing-Tianjin-Hebei Urban Agglomeration.” Environmental Science and Pollution Research 29 (39): 59862–59871. doi:10.1007/s11356-022-20027-1.
- White, R., and G. Engelen. 2000. “High-Resolution Integrated Modelling of the Spatial Dynamics of Urban and Regional Systems.” Computers, Environment and Urban Systems 24 (5): 383–400. doi:10.1016/S0198-9715(00)00012-0.
- Xinyan, Z., H. Tao, Y. Xinyue, G. Wei, H. Liang, X. Hanjiang, A. Haojun, S. Bing, X. Qing, and D. Lian. 2019. “Development and Implementation of a Dynamic and 4D GIS Based on Semantic Location Model.” Geo-Spatial Information Science 22 (3): 193–213. doi:10.1080/10095020.2019.1649192.
- Yang, Z. S., R. Sliuzas, J. M. Cai, and H. F. L. Ottens. 2012. “Exploring Spatial Evolution of Economic Clusters: A Case Study of Beijing.” International Journal of Applied Earth Observations & Geoinformation 19: 252–265. doi:10.1016/j.jag.2012.05.017.
- Yu, J., F. Bian, J. Peterson, and P. Li. 2005. “Interrelations Between Socio-Economic Development and Environmental Quality: A Simulation Integrating System Dynamics Models with GIS.” Geo-Spatial Information Science 8 (3): 176–182. doi:10.1007/BF02826816.
- Zhang, J., Q. Wang, Y. Xia, and K. Furuya. 2022. “Knowledge Map of Spatial Planning and Sustainable Development: A Visual Analysis Using CiteSpace.” Land 11 (3): 331. doi:10.3390/land11030331.
Appendix
Table A1. Official open source non-topographic datasets incorporated into project’s GIS database.
Table A2. QQ reference rules. Qualitative socio-economic rules and their subsequent quantitative expressions used as CA transition rules.
Table A3. Thematic maps (layers) developed for the study area.
Table A4. Socio-economic and spatial development scenarios simulated in the research.
Table A5. Validation of the CA transition rules.