
 ?Mathematical formulae have been encoded as MathML and are displayed in this HTML version using MathJax in order to improve their display. Uncheck the box to turn MathJax off. This feature requires Javascript. Click on a formula to zoom.
ABSTRACT
Accurate measurement of urban sprawl is vital for urban planning and management. Urban planning-induced internal structure complexity affects the extent of urban sprawl. In addition, urban sprawl is closely linked to economic development. The study attempts to explore the impact of urban sprawl from an economic-dominated perspective. Thus a City-Ring road-County (CRC) scale framework based on top-down administrative divisions for urban sprawl measurement is proposed: 1) the single-index measurement based on economic activity is applied to calculate urban sprawl; 2) the spatiotemporal pattern of urban sprawl is investigated through a case study in 31 economy-dominated provincial capital cities across China from 2005 to 2015; 3) the impact of economy and land on urban sprawl is explored using correlation analysis. The results indicate that the degree of urban sprawl at the city scale shows an “inverted U-shaped” curve from 2005 to 2015, which represents that the phenomenon of urban sprawl was most severe in 2010. It finds that urban sprawl was more severe in the east and central regions relative to the provincial capitals in the western region, with the situation being most severe in the northeast region. Regions that have been transformed from suburban to urban built-up areas need to be given priority attention by the local government, including population movement, land layout, and fiscal policy, to meet the criteria of the urbanization process. Through correlation analysis, we also found that urban sprawl was influenced by the industry structure and the form of built-up area. The outcome of the study suggests that the data scale is sufficiently small in granularity to provide geographic boundaries for systematic analysis of urban sprawl in multiple administrative regions. Thus, the study helps provide a reference for differential planning policy formulation by governments at diverse economic levels.
1. Introduction
Urban sprawl first appeared in developed Western countries in the 1970s. The scientific discussion on urban sprawl is not conclusive, and the concept of sprawl lacks a generally accepted definition. Thus, researchers usually define sprawl depending on the function of the term, while its operationalization critically hinges on the availability of appropriate data (Knaap et al. Citation2000; Lopez and Hynes Citation2003; Sudhira, Ramachandra, and Jagadish Citation2004). Characterized by low-density, inefficient and scattered land expansion patterns in the urban fringe, urban sprawl has been generally referred to as an uneven urbanization phenomenon (Aljohani and Thompson Citation2016; Mouratidis Citation2019). The emergence of urban sprawl has led to multi-dimensional problems, including the disappearance of arable land resources (Skog and Steinnes Citation2016), the destruction of the ecological environment (Su et al. Citation2010), the increase of social injustice (Wei and Ewing Citation2018), excessive consumption of energy (Gavrilidis et al. Citation2019), and increase in the emission of greenhouse gases (Priem, Stessens, and Canters Citation2020). Urban sprawl has also caused physical and mental health problems, such as obesity, hypertension, diabetes, and other chronic diseases (Ewing et al. Citation2014; Wu et al. Citation2020).
Urban sprawl has become a global phenomenon over the last several decades commonly caused by rapid economic development, urbanization, and population growth (Gounaridis, Newell, and Goodspeed Citation2020; Hamidi and Ewing Citation2014; Sumari et al. Citation2020). Various studies have been devoted to measuring sprawl and comparing the degree of sprawl among diverse cities (Bhatta, Saraswati, and Bandyopadhyay Citation2010; Jiang et al. Citation2007; Schneider and Dispersed Citation2008). Studies on sprawl have focused primarily on U.S. cities (Song and Zenou Citation2006), but recent studies across the globe have emerged, such as in Europe (Kasanko et al. Citation2006), Tanzania (Shao et al. Citation2020), Israel (Frenkel and Ashkenazi Citation2007), India (Sudhira, Ramachandra, and Jagadish Citation2004), and China (Jiang et al. Citation2016). The negative socio-economic impacts of sprawl are seen as market failures that can lead to economically inefficient and ecologically unsustainable suburban living and urban growth (Brueckner Citation2000). The phenomenon of urban sprawl in China began in the 1980s, and Fung first introduced the concept of urban sprawl into China to describe the characteristics of China’s rapid urban growth (Fung Citation1981; Wu and Yeh Citation1997). The concept was then extended to inefficient spatial development patterns in urban fringe areas (Wang, Shi, and Zhou Citation2020).
In China, urban planning is a vital part of urban spatial development. Intra-city conflicts are exacerbated to some extent when the city master plan fails to meet the needs of cities. In the process of urban planning, economic development policies need to be used as the background and the implementation of national layout policies. Through the continuous improvement and planning of urban spatial structure, the regular operation of urban functions can be effectively ensured, thus promoting the rational allocation of urban spatial resources (Wei and Ewing Citation2018; Xu et al. Citation2019). Local governments use planning and land finance policies to open up new urban growth spaces for maximizing land revenue and prompting urban economic development (Guo et al. Citation2020; Sumari et al. Citation2019). The urban boundaries set by the master plan will affect urban expansion. Besides, the setting of counties and the urban ring road traffic also affect the spatial distribution of the population. Thus, it is worth exploring the urban sprawl in economic-dominated cities based on diverse administrative scales.
Accurately measuring urban sprawl is crucial due to the requirements of a scientific urban sprawl degree for urban planning adjustment (Shao et al. Citation2020; Tian et al. Citation2017). Early attempts at measuring urban sprawl are based almost solely on one metric such as population density, employment density, and the growth of urban areas (Ji et al. Citation2006; Jiang et al. Citation2007; Zhao Citation2011). These metrics can represent the primary indicator of sprawl because it is easy to measure and capture one crucial dimension of sprawl. Urban sprawl studies based on a single metric facilitate comparisons between multiple study areas (Lu, Chen, and Wang Citation2019; Sahana, Hong, and Sajjad Citation2018; Zhang et al. Citation2018). A multidimensional measure of urban sprawl has recently been adopted in quantitative studies (Monkkonen et al. Citation2018; Tian et al. Citation2017; Yue, Liu, and Fan Citation2013). However, there is no consensus on the dimensions that need to be included in multidimensional measurements of sprawl, and using individual dimensions or combining these dimensions also needs to be more uniform. The method has limitations in multi-regional studies like urban agglomerations. Therefore, multidimensional measurements are mainly used to study a specific single region, such as Guangzhou (Wu, Li, and Yu Citation2016), Wuhan (Zeng et al. Citation2015), and Chongqing (Liu et al. Citation2018). Urban sprawl studies in China started relatively late, and multiple case studies are still often based on traditional single-index measurement, including exploring the urban sprawl differences across cities (Jiang et al. Citation2016) and discovering the socioeconomic drivers of urban sprawl in China (Li and Li Citation2019). Existing studies mostly on how the economy as drivers affects urban sprawl, this study tends to measure of the degree of urban sprawl from an economic perspective. Accurately identifying the degree of sprawl in economy-dominated cities deserves studying.
Some researchers consider sprawl is related to economic development and fast urban expansion (Wang et al. Citation2019; Weilenmann, Seidl, and Schulz Citation2017; Yue et al. Citation2019). Unlike the sprawl of Western cities primarily driven by lifestyle changes (Mills Citation2003), China’s sprawl is significantly influenced by the national government. Studies have shown that China’s dramatic urban sprawl is driven on the one hand by market and economic development, as in the United States and other Western countries, and on the other by China’s land finance and land-centered urbanization strategy (Liu et al. Citation2018; Tian Citation2015; Wang et al. Citation2019). In the context of an imperfect land market and decentralization process, local governments tend to oversupply land in the pursuit of economic efficiency, leading to urban sprawl problems (Zhang Citation2000). Exploration of the driving indicators for urban sprawl also contributes to follow-up studies on urban sprawl. Therefore, exploring the economic-land drivers that influence urban sprawl is crucial, providing critical information for the rational planning of sustainable development.
The study aims to accurately measure the urban sprawl in 31 provincial capital cities based on multi-source data in order to: 1) quantify urban sprawl in a synoptic spatial and temporal pattern from 2005 to 2015; 2) compare the change of sprawl based on the geographical boundary of the city, ring road and county scale; 3) investigate the driving factors of urban sprawl from economy and land levels. The study measures urban sprawl based on the characteristics of the area’s economic activity perspective, using a City-Ring road-County (CRC) framework analysis to develop planning policies for different situations. This study contributes to concluding the future policies necessary for a more sustainable and compact development pattern.
2. Materials and methods
2.1. Study area
As sites for urban sprawl and rapid urban development, municipalities and provincial capitals are critical administrative units in China. They tend to be the center of a province’s economic, transport, and cultural development. These cities and their surrounding urban agglomerations (e.g. the Yangtze River Delta, the Pearl River Delta, and Beijing-Tianjin-Hebei) have become the dominant source of economic growth and urbanization in China. Although these cities cover only a tiny part of the national territory, they are home to a high population density and socio-economic activity. The municipalities and provincial capitals cover only 5.12% of the country’s land area. China is at a stage of rapid urbanization, especially in 31 provincial capital, which experiencing rapid urban expansion between 1990 and 2015 (Lu et al. Citation2019). As of 2015, the population density of Guangzhou, Changchun, Zhengzhou, Nanjing, Wuhan, and Chengdu reached over 1,000 people per kilometer. Based on the Statistical Yearbook, Guangzhou, Wuhan, Chengdu, and Hangzhou produced a gross domestic product of over 1 trillion, and 11 cities are with over 500 billion.
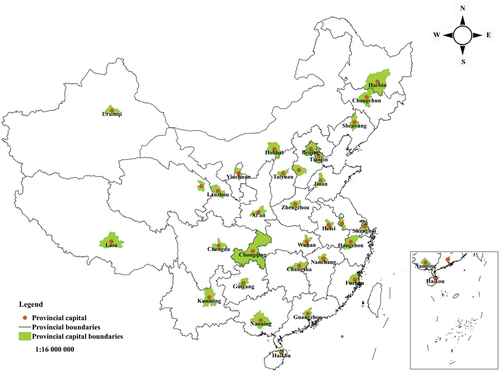
The sample cities selected for this study are 31 municipalities and provincial capitals in mainland China. Their spatial distributions are shown in . Municipalities and provincial capitals in China’s seven geographical regions (North, East, Northeast, Central, South, Southwest, and Northwest China) and four economic regions (Eastern, Central, Western, and Northeastern China) are all relatively economically prosperous, including first-tier cities, new first-tier cities and second-tier cities. They have representative advantages in terms of urban construction. As large cities or megacities, they have a driving effect on the regional economy (Huang et al. Citation2017). In addition, the provincial capital can also utilize the advantages and influence of a strong provincial capital to attract investment, which plays a supporting role in economic development. These cities constitute the fastest-growing areas in their respective provinces and have similarities and differences (Fang, Wang, and Li Citation2015; Lu, Chen, and Wang Citation2019). Municipalities and provincial capitals not only have a long period of urban development but also have various spatial patterns and development policies (Deng et al. Citation2019).
Figure 1. Spatial distributions of 31 Chinese municipalities and provincial capitals in China.
2.2. Data source
2.2.1. Land use/land cover and population data
We download Land Use/Land Cover(LULC) data (data accuracy of 95% tested by the data developer (Liu et al. Citation2010) and Population (POP) density spatial distribution data with a spatial of 1 km × 1 km in 2005, 2010, and 2015 from the Institute of Geographic Sciences and Resources, Chinese Academy of Sciences (http://www.resdc.cn/). Using ArcGIS version 10.5 to process the data, which includes extracting the urban built-up area and population density in urban built-up areas by rearranging the datasets. Besides, the LULC data is also used to calculate the driving indicators for the built-up area.
2.2.2. Gross domestic product, nighttime stable light and point of interest data
Gross Domestic Product (GDP) data (1 km × 1 km) in 2005, 2010, and 2015 are also sourced from the China Academy of sciences. The Nighttime Stable Light (NSL) data in 2005 and 2010 are collected by the Defense Meteorological Satellite Program’s Operational Line-scan System (DMSP/OLS), and NSL data (2015) is obtained using visible infrared imaging radiometer in the National Polar-orbiting Partnership (NPP-VIIRS) for connection with socioeconomic indicators. Point of interest (POI) data is obtained through API for the map (http://www.baidu.cn/). GDP data represents the state of economic development (Lu, Chen, and Wang Citation2019). NSL data can be used to evaluate the economic level of a city (Zhang et al. Citation2019). POI data contain the coordinate and attribute information of the buildings they represent, which can provide financial information for urban sprawl at the spatial level (Li et al. Citation2020).
2.2.3. Auxiliary data
OpenStreetMap (OSM) data is acquired from the Open Street Map (https://www.openstreetmap.org/), and we plot the dataset of the ring road line based on OSM data from 2015. The administrative boundary data, including provincial and regional boundaries, are derived from the National Geographic Information Center of China (http://ngcc.sbsm.gov.cn). As changes in administrative boundaries affect the calculation of urban population, we applied the 2015 urban boundaries to both datasets to ensure that urban area and urban population were comparable from 2005 to 2015. The socio-economic statistics are cited from the Chinese Urban statistical yearbook (2005–2015), details of the data sources can refer to .
Table 1. Introduction for data source.
2.3. Methods
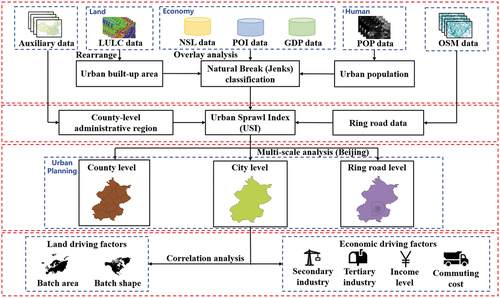
This study identifies urban sprawl characteristics and patterns in 31 municipalities and provincial capitals from 2005 to 2015 (2005, 2010, and 2015). During this period, municipalities and provincial capitals experienced rapid urban built-up area expansion and population growth. The overall framework of measuring and analyzing the degree of urban sprawl is illustrated in . We used GDP, POI, and NSL data to illustrate the economic activity of the built-up area. In terms of the essential characteristic of urban sprawl, LULC data and POP data were used to measure the urban sprawl. We then analyzed the degree of urban sprawl at diverse administrative planning scales (city, ring road, and county) to analyze the relationship between urban planning and actual development. We also explored the socioeconomic driving factors of urban sprawl based on statistical data.
Figure 2. Flow chart for calculating and analyzing urban sprawl.
2.3.1. Measuring urban sprawl index
Density plays an essential role in urban sprawl measurements. Furthermore, it is verified that some single-dimensional measurements (e.g. population density) tend to be highly correlated with multiple-dimensional measurements (Li and Li Citation2019; Lu, Chen, and Wang Citation2019). Municipalities and provincial capitals are economically developed and have a high concentration of people living in them. Therefore, referring to the single-index measurement based on residential density (Lopez and Hynes Citation2003), we decided to use the gridded data on population density to compare the differences between old and new built-up areas. Considering the economic characteristics of provincial capitals, economic activity is added to the calculation of urban sprawl.
The study is based on a spatial of 1 km × 1 km, which facilitates overlaying the data for comparability. The 1 km × 1 km grid is small enough for analysis at the city-ring road-county scale. Thus, the 1 km × 1 km gridded fishnet was created using the Fishnet tool available in the ArcGIS version 10.5. The index of GDP, POI, and NSL data cannot be calculated and overlaid directly because of their differences in dimension and meaning. These indexes need to be standardized to eliminate the effects of dimension differences, then they will become comparable, and where the formula is defined as
where xi* represents the value of the index after standardization, xi represents the value of index i, xmax represents the maximum value of index i, and xmin represents the minimum value of index i.
The overlaid data in gridded format were divided into economically high and low activity zones through the Natural Break (Jenks) classification (Khamis, Sin, and Hock Citation2018) in ArcGIS version 10.5. High-activity zones represent areas with developed economies, dense crowd activities, and complete public service facilities. Low-activity zones represent areas with relatively backward economies, sparse crowd activities, and inadequate public service facilities. The urban sprawl index at the city scale is calculated based on the built-up area of the city. In calculating the urban sprawl index at the ring road scale and the county scale, we use the administrative boundaries of the ring roads and counties to delineate the urban built-up areas and treat each ring road and each county as an area for independent delineation of activity.
The Urban Sprawl Index (USI) at the city-ring road-county scales is defined as
where USI(i,m,n) represents the urban sprawl index for city i, ring road m or county n; S(i,m,n) represents the percentage of the total population in low-activity areas relative to the total population of city i, ring road m or county n; and D(i,m,n) represents the percentage of the total population in high-activity areas relative to the total population of city i, ring road m or county n.
2.3.2. Analyzing the urban sprawl index at the ring road scale and county scale
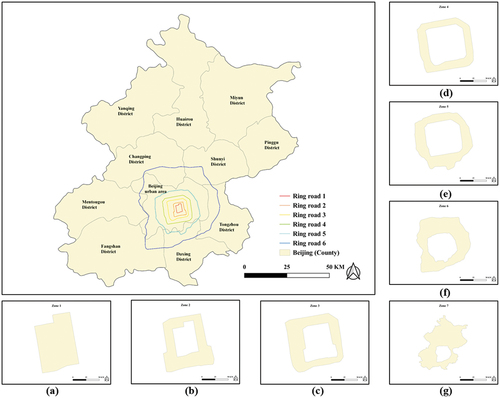
The ring road and county districts are important administrative divisions for the internal planning of the city and are closely related to a city’s economy and transportation. In this study, seven municipalities and provincial capitals (Beijing, Shanghai, Guangzhou, Wuhan, Chengdu, Xi’an, and Shenyang) were chosen based on seven geographic regions to analyze the extent of sprawl at the ring road scale. Nine cities were chosen based on their statuses as first-tier cities (Beijing, Shanghai, and Guangzhou), new first-tier cities (Nanjing, Changsha, and Tianjin), and second-tier cities (Hefei, Nanchang, and Guiyang) to analyze the extent of sprawl at the county scale. Beijing is analyzed both at the ring road scale and county scale, so Beijing is shown as an example to illustrate the composition of the ring road in . There are six ring roads in Beijing, consisting of an inner ring road (Ring road 1), the express ring road at the site of the former city walls (Ring road 2), the first ring road to be opened to traffic in Beijing (Ring road 3), the urban express ring road with eight lanes in each direction on the main road (Ring road 4), the toll motorways (Ring road 5), the circular highway connecting Beijing’s first circle of satellite cities (Ring road 6). In order to measure the degree of urban sprawl, we name the area within the inner ring road (Zone 1), express ring road (Zone 2), ring road 3 (Zone 3), ring road 4 (Zone 4), toll motorways (Zone 5), circular highway (Zone 6), outside the circular highway (Zone 7).
Figure 3. Identification of ring roads and counties, using Beijing as an example.
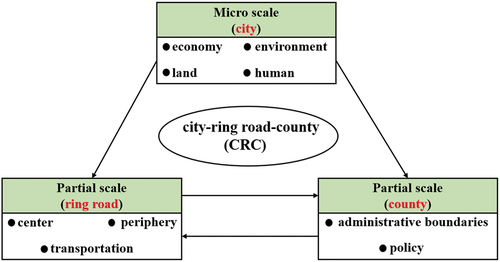
No ring road dataset could be directly obtained. Thus, ring road line data were drawn based on the OSM data, and county data were obtained through the China administrative division (Tian et al. Citation2017). After using ring road data and county data to segment the cities, the urban sprawl index of selected areas was calculated to analyze the sprawl within the cities. Furthermore, we selected cities for a fine-grained analysis of urban sprawl according to their geographic location and economic development, which can facilitate understanding the deeper meaning of urban sprawl from a partial perspective. The CRC analysis framework is illustrated in .
Figure 4. The CRC framework for analyzing urban sprawl.
2.3.3. Correlation analysis from economic and land perspectives
Economic development, living standards, and industrial structure are the key factors contributing to urban sprawl (Liu et al. Citation2010; Weilenmann, Seidl, and Schulz Citation2017). In addition, the spatial pattern of urban built-up areas is also closely linked to urban sprawl (Deng et al. Citation2019). To investigate the impact of indicators for economy and land on urban sprawl, we performed regression analysis using data from 31 municipalities and provincial capitals. The USI was used as the dependent variable, while the economy and land indicators were used as the independent variable. The proportion of the secondary and tertiary industries in the total GDP, the per capita GDP, and the cost of commuting were selected to represent the economic indicators in this study. For the land dimension, we choose the standard deviation of path areas and the patch shape index for urban built-up area to examine the influence of land indicators on sprawl. The economic and land indicators are presented in .
Table 2. Driving indicators for urban sprawl.
Municipalities and provincial capital were divided into eastern, western, and central regions according to geographical location. And they were divided into first-tier cities and second-tier cities according to their economic development level. This classification strategy is superior for observing the influence of urban sprawl in various areas. Furthermore, it facilitates helpful for government land administration departments in unified planning.
The driving indicators is taken as a logarithm in the formula to reduce the absolute difference between the data, thus avoid the effect of individual extreme values. The formulation of the regression analysis is defined as
where USIit represents the interpreted variables, namely, the urban sprawl index between 2005 and 2015 for every five years; ind2 is the proportion of secondary industries in GDP; ind3 is the proportion of tertiary industries in GDP; liv is the per capita GDP; com is the number of buses per 10,000 people in the city; pssd is the standard deviation of the patch areas; psi is the patch shape index; and ui represents the unit-specific error. For the panel data, the Hausman test was used to determine whether a fixed-effects or random-effects model was chosen.
3. Results
3.1. City-scale sprawl characteristics of municipalities and provincial capitals
3.1.1. General characteristics of municipalities and provincial capitals sprawl in China
The overall urban sprawl index of the studied cities shows a tendency to increase and subsequently decrease (). The increase in urban sprawl from 2005 to 2010 is consistent with the trends between land expansion and population growth. Shijiazhuang, Harbin, Hangzhou, and Nanchang have relatively large fluctuations in the urban sprawl index, while Xining, Yinchuan, and Urumqi have relatively small fluctuations in the urban sprawl index.
Figure 5. Maps of the variable urban sprawl, and constant in each of the 31 municipalities and provincial capitals in 2005(a), 2010(b) and 2015(c). For each map, the values are represented by colors, with the maximum values in red and the minimum values in green.
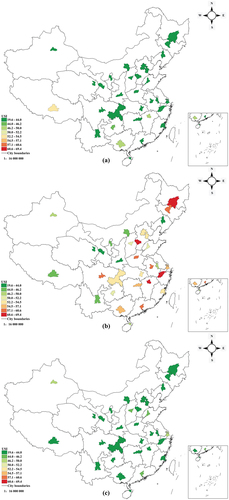
According to , the average sprawl index for the country’s municipalities and provincial capitals was 36.03 in 2005. Among the municipalities and provincial capitals, seventeen (54.84%) cities exceeded the average level of sprawl, and twenty (64.52%) had sprawl index values between 20 and 40. In 2010, the national average sprawl index for municipalities and provincial capitals was 52.97, with fifteen (48.39%) having higher than average sprawl index values. In addition, twenty-five (80.65%) cities had sprawl index values of between 40 and 60 that year. In 2015, the national capital city sprawl level was 38.49, with seventeen (54.84%) cities exceeding the overall sprawl level, of which nineteen (61.29%) were in the 20–40 range and represented the highest percentage of municipalities and provincial capitals.
Table 3. Urban sprawl for 31 municipalities and provincial capitals.
The degree of urban sprawl shows a clear “inverted U-shaped” trend in 2005, 2010, and 2015. With the rapid development of urbanization, population density is decreasing faster, which shows that the degree of land intensification is low and land resources are wasted.
3.1.2. Analyzing the sprawl of municipalities and provincial capitals from an economic angle: China’s four economic regions
Rapid urbanization led to great economic imbalances between different cities, and mainland China finally was divided into 4 economic regions: Eastern China, Central China, Western China and Northeastern China (Su et al. Citation2014). Municipalities and provincial capitals are analyzed and compared according to the four economic regions in our study, which can scientifically reflect the social and economic development of China’s regions and provide a basis for the government to formulate regional development policies.
The eastern region includes Beijing, Tianjin, Shijiazhuang, Shanghai, Nanjing, Hangzhou, Fuzhou, Jinan, Guangzhou, and Haikou. shows the distribution of the urban sprawl index for eastern municipalities and provincial capitals. In 2005, the sprawl index values of eight (80%) cities in the eastern region were between 20 and 40, with an average sprawl index value of 35.03. In 2010, the average sprawl rose to 55.62, with eight (80%) cities having values between 40 and 60. By 2015, the average sprawl index had fallen to 40.5, with six (60%) cities having sprawl index values between 40 and 60.
Table 4. Urban sprawl for eastern municipalities and provincial capitals.
The central region includes Taiyuan, Hefei, Nanchang, Zhengzhou, Wuhan, and Changsha. shows the distribution of the urban sprawl index for central municipalities and provincial capitals. In 2005, four (66.67%) central cities had sprawl index values between 40 and 60, with an average sprawl index value of 38.15. By 2010, five (83.33%) cities had a sprawl index between 40 and 60, and Nanchang’s sprawl index had risen to 69.41. By 2015, the overall sprawl index of central cities had fallen to 38.93, with four (66.67%) cities having sprawl index values between 20 and 40.
Table 5. Urban sprawl for central municipalities and provincial capitals.
The western region includes Hohhot, Nanning, Chongqing, Chengdu, Guiyang, Kunming, Lhasa, Xi’an, Lanzhou, Xining, Yinchuan, and Urumqi. shows the distribution of the urban sprawl index for western municipalities and provincial capitals. In 2005, eight (66.67%) cities had sprawl index values of between 20 and 40, with an average of 37.88. In 2010, eleven (91.67%) cities had sprawl index values between 40 and 60, with an average sprawl index value of 48.23. In 2015, the average sprawl index in the western cities fell to 37.97, with seven (58.33%) cities having a sprawl index between 20 and 40.
Table 6. Urban sprawl for western municipalities and provincial capitals.
The northeastern region includes Shenyang, Changchun, and Harbin. shows the distribution of the urban sprawl index for northeastern municipalities and provincial capitals. The sprawl index northeastern city averaged 27.66 in 2005 and increased to 54.52 in 2010, representing the region’s most significant change. Then, the sprawl index decreased in 2015 but remained significantly higher than that in 2005, with a sprawl index value of 32.98.
Table 7. Urban sprawl for northeastern municipalities and provincial capitals.
All municipalities and provincial capitals in mainland China experienced urban sprawl between 2010 and 2015. The urban sprawl index for municipalities and provincial capitals in the eastern and central regions vary similarly. The degree of urban sprawl for eastern and northeastern cities was relatively severe in 2010. Because most of China’s cities locate in the central and eastern parts of the country, particularly in the coastal areas. Since China’s reform and opening-up policy in the early 1980s, these regions have led the way regarding economic growth and urbanization. The commitment to urban land expansion in China’s eastern coastal regions has led to a need for land use intensification. Therefore, it is not unanticipated to see that urban sprawl occurs. The cities in the western region have the most minor trend in the change of urban sprawl. The relatively sparse population and low level of industrial development in the west have led to a slow urbanization process.
3.2. Ring road-scale sprawl characteristics of municipalities and provincial capitals
The ring road lines connect the various areas closely together, provide convenience for each area, and render traffic faster and travel more convenient. Passengers can keep the number of transfers the same because the area is distributed among various routes. At the same time, the ring road line can disperse the flow of changing passengers and ease the transfer pressure of traffic. According to the urban sprawl at the ring road scale (), the degree of sprawl in the outer ring road is relatively severe compared to the inner ring road area (e.g. Xi’an and Shenyang). The ascending sprawl areas were mainly in the outer suburbs along the ring express because the overdevelopment of built-up areas in the urban periphery, irrational suburban planning and low-density economic development have led to an increase in urban sprawl.
Figure 6. Maps of the USI in Beijing, Shanghai, Guangzhou, Wuhan, Chengdu, Xi’an, and Shenyang at the ring road scale.
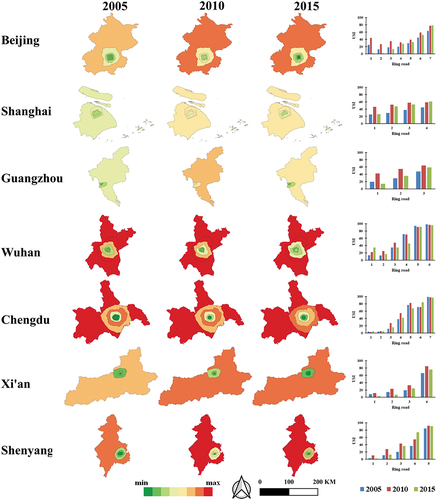
The degree of urban sprawl in Beijing, Shanghai, and Guangzhou are relatively low due to their relatively mature urbanization process in municipalities and provincial capitals. Thus, the urban spatial forms of these three cities are more compact and intensive than other cities. Meanwhile, in Beijing, Shanghai, and Guangzhou, the phenomenon of “central sprawl” exists, which means a higher sprawl index in ring road 1 than in ring road 2 or ring road 3. The centers of large cities are commonly the most economically prosperous areas. However, the overdevelopment of built-up areas leads to a price premium or the preservation of the old town’s original appearance, resulting in a low-density population distribution and non-intensive land use.
The ring road sprawl is also typical for Wuhan and Chengdu among the selected cities. According to the ring road sprawl () of Wuhan, the area with a more reasonable layout is ring road 2. The closer to the outer ring road, the more serious the urban sprawl. Under the circumstance that the filling between ring road 3 and ring road 4 is not yet saturated, the sprawl between ring road 4 and ring road 5 has been accelerated. From 2005 to 2010, the sprawl of ring road 5 is more serious than that of ring road 6 in Chengdu. Because urbanization has brought many migrants to Chengdu, resulting in the encroachment of open spaces reserved for the city and increased pressure on municipal infrastructure. By 2015, this phenomenon disappeared because the government directed public service resources to satellite cities and other small cities in the Chengdu metropolitan area to promote local citizenship efforts and reduce the pressure on large cities. Most cities are consistent with the sprawl development trends of Chengdu, which shows that the government has paid more attention to urban sprawl in recent years, and urban sprawl can affect the sustainable able development of a city.
3.3. County-scale sprawl characteristics of municipalities and provincial capitals
The county plays an essential role in serving the overall population. The government has closer ties with the people, facilitating the people’s participation in state management. Counties are divided according to the economic characteristics of regions, which is conducive to developing social productivity. According to the urban sprawl at the county scale (), the closer an area is to the peripheral districts and counties, the higher the degree of urban sprawl. The phenomenon aligns with prosperous economic development and more concentrated population distribution in urban centers. Irrational planning and sparse population distribution in the city’s outer suburbs exacerbate the urban sprawl phenomenon. However, the urban sprawl for the outer counties showed a downward trend from 2005 to 2015, which reflects the government has started to take the issue of urban sprawl seriously and has taken relevant solutions.
Figure 7. Maps of the USI in Beijing, Shanghai, Guangzhou, Nanjing, Changsha, Tianjin, Hefei, Nanchang, and Guiyang at the county scale (Tianjin Tanggu District, Hangu District and Dagang District were merged into Binhai New Area in 2009 and are still divided into three districts for the purpose of comparison; Nanchang’s administrative divisions are constantly evolving, so use 2005 as a standard for comparison).
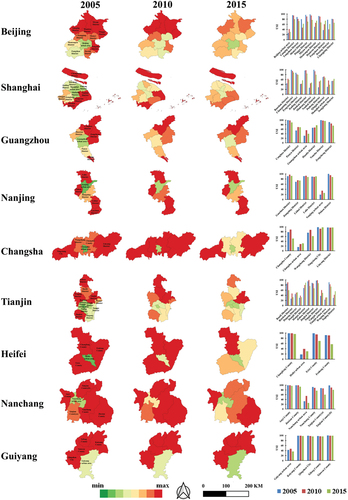
Among the first-tier cities (Beijing, Shanghai, and Guangzhou), Miyun District of Beijing has the most severe sprawl. Although Miyun District ‘s sprawl index has declined since 2010, it is still the highest of all counties. Chongming District and Nanhui District in Shanghai were originally suburban areas. With the rapid economic development of Shanghai, various industries relocated. The local population has also changed due to changes in employment, which led to a high degree of urban sprawl. The degree of urban sprawl in Guangzhou’s Huadu District between 2005 and 2015 is worth drawing the attention of local governments. Among the new first-tier cities (Nanjing, Changsha, and Tianjin) and second-tier cities (Hefei, Nanchang, and Guiyang), it is relatively easy to observe a slowdown in the degree of urban expansion in Tianjin. The sprawl in the central county of Changsha, Nanjing, and Nanchang were controlled from 2010 to 2015, while sprawl in the peripheral counties of Hefei showed a downward trend in this decade. In addition, the sprawl in Huaxi District of Guiyang slowed down in 2015 relative to 2005. Thus, this method and comparison can easily identify areas of severe urban sprawl, which facilitates the accurate location of sprawl areas. The internal sprawl of each city can be identified so that valuable urban building recommendations can be made to government land planning departments based on these characteristics. The planning department can then take targeted measures to achieve the goal of sustainable urban development.
3.4. Economic and land driving indicators behind urban sprawl
presents the descriptive statistical analysis of each variable for the whole sample (2005, 2010, and 2015). The table lists the minimum, maximum, mean and Standard Deviation (SD) of each variable, which shows the differences in the indicators for each city. The original hypothesis is accepted according to the Hausmann test. Hence, our study uses a random effects model for regression.
Table 8. Descriptive statistics for urban sprawl index and driving indicators.
In this study, we obtained an analysis table after the regression analysis, which was conducted to identify strong correlations between the selected data. Driving indicators for municipalities and provincial capitals were categorized into eastern, central, western, first-tier, and second-tier cities based on their geographical location and economic level (). Therefore, six models, including the total 31 municipalities and provincial capitals sample., were regressed on the random effects model.
Table 9. Relationships between urban sprawl and driving indicators.
shows the direct effect of secondary and tertiary industries on urban sprawl is −0.335 and −0.658, with significant levels of 10% and 5%. These results show that the layout of the secondary and tertiary industries, especially the tertiary ones, significantly negatively affects urban sprawl. Therefore, a reasonable proportion of secondary and tertiary industries and the focus on tertiary industries can effectively control urban sprawl. The government should pay attention to future industrial development of municipalities and provincial capitals. The direct effect of built-up area (standard deviation) on urban sprawl is 0.103 with a significant level of 1%, implying the standard deviation of the patch area for the built-up area has significantly promoted urban sprawl. This indicator reflects the degree of size variation among built-up areas, which indicates that the more dispersed construction land is likely to lead to urban sprawl. In central municipalities and provincial capitals, the per capita GDP positively affects urban sprawl, which is 0.386 with a significant level of 1%. Economic development in the central region has accelerated urban sprawl. The driving indicators of municipalities and provincial capitals in the central region and as second-tier cities were in line with each other. Second-tier cities are primarily located in the central region of China. They are in the rising stage of urbanization, requiring a focus on industrial development and built-up area expansion.
4. Discussion and policy implications
4.1. Relationship between urban sprawl and national policies
Urban lands in China’s municipalities and provincial capitals underwent different sprawl stages from 2005 to 2015, demonstrating the driving force of government policy-making and planning on urban sprawl. Rapid economic development has benefited from the reform and opening-up policy, and China’s urbanization has received a comprehensive boost (Wei and Ye Citation2014). Land-use right transfer system prompts urban expansion accompanied by a loss of cultivated land resources (Chen and Zheng Citation2008). From 2005 to 2010, China recovered from the effect of the financial crisis. More people flocked to municipalities and provincial capitals, and the demand for urban land became significant. The 31 cities have lost large amounts of cultivated land resources after only a period of accelerated expansion. Therefore, the central government in China has required local governments to enforce a series of policies and regulations for farmland preservation, intending to prevent farmland-urban built-up land conversion (Lichtenberg and Ding Citation2008). The basic farmland protection policy appears to have failed to control urban sprawl, as it is highly vulnerable to local development pressures and lack of oversight by the central government. The weakening of the household registration system may be linked to the increase in the migrant population (Deng and Huang Citation2004). Since the 1990s, the reformed household registration system has weakened the control over migration. Many migrant workers have been allowed to come to municipalities and provincial capitals for work. Most migrants live in the suburbs on the edge of the city as they cannot afford the commodity housing in the urban center. Urban sprawl may also be associated with urban planning, including master and urban land use planning (Tian et al. Citation2017). Urban planning is approved and monitored by the central government but developed and implemented by local governments in China. They control urban sprawl through tools such as built-up boundaries, zoning, and development permit. However, the changing development context compelled local governments in municipalities and provincial capitals to frequently revise their plans (Liu, Zhang, and Wang Citation2016; Lu et al. Citation2019). In each new planning round, the increase in building land area per capita will increase the land cost for urbanization. Low-density land use is the main reason urban planners fail to curb urban sprawl effectively.
4.2. Relationship between urban sprawl and land economy
Unprecedented rapid economic growth and massive rural-to-urban migration in China push urban boundaries outward (Hu et al. Citation2015). The built-up area of municipalities and provincial capitals continues to expand from 2005 to 2015. The loose rural-to-urban land conversion system in China has converted agricultural land in urban fringes to urban use, which has become a lucrative means for local governments to collect a significant proportion of municipal revenues (Liu et al. Citation2018). Local governments in municipalities and provincial capitals have heavily relied on land finance to expand off-budgetary incomes. The real estate or construction boom in the 31 cities is mainly due to the land-centered urbanization policies (Yew Citation2012). Thus, land finance in China is deeply rooted in the local governments’ monopoly of land development rights and the associated revenues from public land ownership. Local governments propelled urban development through land finance. A few scholars argued that adopting public land reserves enables advanced planning of developable land and controls the flow of new land on the market, potentially preventing urban sprawl. However, Local governments in municipalities and provincial capitals are used to generate revenue by the monopoly of land supply and having considerable discretion in land disposal to cope with the lack of revenue (Tian and Ma Citation2009; Ye and Wu Citation2014). They are enthusiastic about profiting from land development through substantial spatial expansion and even loosening land-use regulations that restrict the quantity of land supply. The local governments in the 31 cities need to reduce the overreliance on land finance. Otherwise, urban sprawl is inevitable.
4.3. Future combat on urban sprawl in Chinese municipalities and provincial capitals
The results for urban sprawl in municipalities and provincial capitals show that despite a declining trend during the decade, 71% of the country’s capital city sprawl indices were higher in 2015 than in 2005. It has been observed that urban sprawl in most municipalities and provincial capitals is hugely faster than in the megacities of North America and Europe (Patacchini et al. Citation2009; Valiela and Martinetto Citation2007). Local governments in China are confronting diverse challenges to attaining sustainable development due to rapid urban sprawl. The situation could be more acute in the coming years if planning regulations are not enforced. This study adopted a CRC analysis framework to quantitatively analyze the spatiotemporal characteristics of the urban sprawl form in municipalities and provincial capitals in China, providing scientific data support for sustainable urban development.
The results at the city scale illustrate that attention should be paid to eastern and northeastern municipalities and provincial capitals. Maintaining the carrying capacity of cities must be a fundamental policy to be maintained over the long term. Only through this strategy can we prevent the over-consumption of land resources and protect the security of arable land. Except for the intervention of the cultivated protection policy and the effect of the urban development macro policy, controlling urban boundaries and improving migration benefits to achieve intelligent and intensive urban growth can also curb urban sprawl (Li et al. Citation2017; Xiong et al. Citation2019; Yaping and Min Citation2009). The urban sprawl in 31 municipalities and provincial capitals has spatial heterogeneity at the ring road scale and county scale. Policymakers should carefully consider the differences in urban areas, city size, and administrative scale to develop effective regulatory policies for addressing urban sprawl (Liu, Zhang, and Wang Citation2016; Liu et al. Citation2018; Tian et al. Citation2017). Addressing urban sprawl has become an urgent priority. Furthermore, it is necessary to consider whether it is reasonable to promote the process of urbanization for counties with significant urban sprawl by frequently adjusting the policy of administrative divisions that mainly remove counties and establish districts. This measure may induce an increase in urban sprawl. At the same time, there are differences in the key socioeconomic factors that drive urban expansion, which should be reasonably considered in the decision-making process (Tong et al. Citation2017; Wang, Shi, and Zhou Citation2020). The layout of the industrial structure and the built-up area expansion need to be set according to the characteristics of different municipalities and provincial capitals to achieve local adaptation. In the future development of urbanization, local governments should avoid maximizing land revenue through urban planning.
5. Conclusions
In this study, we focus on identifying urban sprawl based on the combination of multisource geographical data such as land use/land cover data, population density data, and socioeconomic data. In terms of the rapid economic development in municipalities and provincial capitals, the degree of urban sprawl was calculated through the residential density of built-up areas with diverse economic activity. The spatial data was refined enough to provide geological boundaries so that the study can analyze the extent of urban sprawl within economic-dominated cities at both the ring road scale and the county scale. The construction of the CRC analysis framework will help to understand urban sprawl from a global and local perspective, which is helpful for urban planning.
Land and population planning are vital for urban sprawl in municipalities and provincial capitals. The local government should control the population in each administrative division, and the population can be managed dynamically to avoid the sprawl of suburbs and urban centers. The high number of employment opportunities in the urban centers and the low cost of living in the suburbs have led to a concentration of people in the city’s periphery. Therefore, local governments can prioritize the development of public transport, encourage mixed land use, implement urban regeneration and redevelopment of inefficient land, and increase the attractiveness of urban centers. Urban sprawl in China, as demonstrated by the case of 31 municipalities and provincial capitals, seems to be highly associated with built-up area expansion and rapid economic development. Recent social and economic changes in China require a transition from a land-centered to a people-centered strategy, which means site-specific development patterns can prompt socio-environmental coherence and sustainable urbanization.
Disclosure statement
No potential conflict of interest was reported by the author(s).
Data availability statement
Some data that support the results and analyses presented in this paper is publicly available from the Institute of Geographic Sciences and Resources, Chinese Academy of Sciences (http://www.resdc.cn/). The administrative boundary data including provincial and regional boundaries are publicly available from the National Geographic Information Center of China (http://ngcc.sbsm.gov.cn).
Additional information
Funding
Notes on contributors
Qiqi Zhu
Qiqi Zhu is currently an Associate Professor at China University of Geosciences. Her research interests include urban land use change, deep learning and spatio-temporal big data analysis.
Meizhi Zeng
Meizhi Zeng is a postgraduate student at China University of Geosciences. She mainly engaged in study on spatio-temporal big data and regional coordinated planning.
Pengfei Jia
Pengfei Jia is an undergraduate student at China University of Geosciences. He focuses on the spatio-temporal modeling of the urban sprawl.
Mingqiang Guo
Mingqiang Guo is currently a Professor at China University of Geosciences. His research interests include remote sensing image hyper-segmentation reconstruction, web GIS and high-performance spatial computing.
Xun Liang
Xun Liang is an Adjunct Professor at China University of Geosciences. His research interests include Geo-temporal dynamics simulation and urban planning.
Qingfeng Guan
Qingfeng Guan is a full Professor at Wuhan University. His research interests include spatio-temporal big data, spatial computing intelligence, high performance spatial computing and urban remote sensing.
References
- Aljohani, K., and R. G. Thompson. 2016. “Impacts of Logistics Sprawl on the Urban Environment and Logistics: Taxonomy and Review of Literature.” Journal of Transport Geography 57: 255–263. doi:10.1016/j.jtrangeo.2016.08.009.
- Bhatta, B., S. Saraswati, and D. Bandyopadhyay. 2010. “Quantifying the Degree-of-Freedom, Degree-of-Sprawl, and Degree-of-Goodness of Urban Growth from Remote Sensing Data.” Applied Geography 30 (1): 96–111. doi:10.1016/j.apgeog.2009.08.001.
- Brueckner, J. K. 2000. “Urban Sprawl: Diagnosis and Remedies.” International Regional Science Review 23 (2): 160–171. doi:10.1177/016001700761012710.
- Chen, M., and Y. Zheng. 2008. “China’s Regional Disparity and Its Policy Responses.” China & World Economy 16 (4): 16–32. doi:10.1111/j.1749-124X.2008.00119.x.
- Deng, F. F., and Y. Huang. 2004. “Uneven Land Reform and Urban Sprawl in China: The Case of Beijing.” Progress in Planning 61 (3): 211–236. doi:10.1016/j.progress.2003.10.004.
- Deng, Y., W. Qi, B. Fu, and K. Wang. 2019. “Geographical Transformations of Urban Sprawl: Exploring the Spatial Heterogeneity Across Cities in China 1992–2015.” Cities 105: 102415. doi:10.1016/j.cities.2019.102415.
- Ewing, R., G. Meakins, S. Hamidi, and A. C. Nelson. 2014. “Relationship Between Urban Sprawl and Physical Activity, Obesity, and Morbidity – Update and Refinement.” Health & Place 26: 118–126. doi:10.1016/j.healthplace.2013.12.008.
- Fang, C., S. Wang, and G. Li. 2015. “Changing Urban Forms and Carbon Dioxide Emissions in China: A Case Study of 30 Provincial Capital Cities.” Applied Energy 158: 519–531. doi:10.1016/j.apenergy.2015.08.095.
- Frenkel, A., and M. Ashkenazi. 2007. “The Integrated Sprawl Index: Measuring the Urban Landscape in Israel.” The Annals of Regional Science 42 (1): 99–121. doi:10.1007/s00168-007-0137-3.
- Fung, K. -I. 1981. “Urban Sprawl in China: Some Causative Factors.” Urban Development in Modern China 194–221.
- Gavrilidis, A. A., M. R. Niță, D. A. Onose, D. L. Badiu, and I. I. Năstase. 2019. “Methodological Framework for Urban Sprawl Control Through Sustainable Planning of Urban Green Infrastructure.” Ecological Indicators 96: 67–78. doi:10.1016/j.ecolind.2017.10.054.
- Gounaridis, D., J. P. Newell, and R. Goodspeed. 2020. “The Impact of Urban Sprawl on Forest Landscapes in Southeast Michigan, 1985–2015.” Landscape Ecology 35 (9): 1975–1993. doi:10.1007/s10980-020-01075-9.
- Guo, M., H. Liu, Y. Xu, and Y. Huang. 2020. “Building Extraction Based on U-Net with an Attention Block and Multiple Losses.” Remote Sensing 12 (9): 1400. doi:10.3390/rs12091400.
- Hamidi, S., and R. Ewing. 2014. “A Longitudinal Study of Changes in Urban Sprawl Between 2000 and 2010 in the United States.” Landscape and Urban Planning 128: 72–82. doi:10.1016/j.landurbplan.2014.04.021.
- Huang, X., J. Xia, R. Xiao, and T. He. 2017. “Urban Expansion Patterns of 291 Chinese Cities, 1990–2015.” International Journal of Digital Earth 12 (1): 62–77. doi:10.1080/17538947.2017.1395090.
- Hu, S., L. Tong, A. E. Frazier, and Y. Liu. 2015. “Urban Boundary Extraction and Sprawl Analysis Using Landsat Images: A Case Study in Wuhan, China.” Habitat International 47: 183–195. doi:10.1016/j.habitatint.2015.01.017.
- Jiang, F., S. Liu, H. Yuan, and Q. Zhang. 2007. “Measuring Urban Sprawl in Beijing with Geo-Spatial Indices.” Journal of Geographical Sciences 17 (4): 469–478. doi:10.1007/s11442-007-0469-z.
- Jiang, G., W. Ma, Y. Qu, R. Zhang, and D. Zhou. 2016. “How Does Sprawl Differ Across Urban Built-Up Land Types in China? A Spatial-Temporal Analysis of the Beijing Metropolitan Area Using Granted Land Parcel Data.” Cities 58: 1–9. doi:10.1016/j.cities.2016.04.012.
- Ji, W., J. Ma, R. W. Twibell, and K. Underhill. 2006. “Characterizing Urban Sprawl Using Multi-Stage Remote Sensing Images and Landscape Metrics.” Computers, Environment and Urban Systems 30 (6): 861–879. doi:10.1016/j.compenvurbsys.2005.09.002.
- Kasanko, M., J. I. Barredo, C. Lavalle, N. McCormick, L. Demicheli, V. Sagris, and A. Brezger. 2006. “Are European Cities Becoming Dispersed?: A Comparative Analysis of 15 European Urban Areas.” Landscape and Urban Planning 77 (1–2): 111–130. doi:10.1016/j.landurbplan.2005.02.003.
- Khamis, N., T. C. Sin, and G. C. Hock. 2018. “Segmentation of Residential Customer Load Profile in Peninsular Malaysia Using Jenks Natural Breaks.” IEEE 7th international conference on power and energy (PECon), Kuala Lumpur, Malaysia: IEEE, 128–131.
- Knaap, G., E. Talen, R. Olshansky, and C. Forrest. 2000. Government Policy and Urban Sprawl. Springfield, IL: Illinois Department of Natural Resources, Office of Realty and Environmental Planning.
- Lichtenberg, E., and C. Ding. 2008. “Assessing Farmland Protection Policy in China.” Land Use Policy 25 (1): 59–68. doi:10.1016/j.landusepol.2006.01.005.
- Li, G., and F. Li. 2019. “Urban Sprawl in China: Differences and Socioeconomic Drivers.” The Science of the Total Environment 673: 367–377. doi:10.1016/j.scitotenv.2019.04.080.
- Liu, Y., P. Fan, W. Yue, and Y. Song. 2018. “Impacts of Land Finance on Urban Sprawl in China: The Case of Chongqing.” Land Use Policy 72: 420–432. doi:10.1016/j.landusepol.2018.01.004.
- Liu, F., Z. Zhang, and X. Wang. 2016. “Forms of Urban Expansion of Chinese Municipalities and Provincial Capitals, 1970s–2013.” Remote Sensing 8 (11): 930. doi:10.3390/rs8110930.
- Liu, J., Z. Zhang, X. Xu, W. Kuang, W. Zhou, S. Zhang, R. Li, et al. 2010. “Spatial Patterns and Driving Forces of Land Use Change in China During the Early 21st Century.” Journal of Geographical Sciences 20 (4): 483–494. doi:10.1007/s11442-010-0483-4.
- Li, W., D. Wang, H. Li, and S. Liu. 2017. “Urbanization-Induced Site Condition Changes of Peri-Urban Cultivated Land in the Black Soil Region of Northeast China.” Ecological Indicators 80: 215–223. doi:10.1016/j.ecolind.2017.05.038.
- Li, F., Q. Yan, Z. Bian, B. Liu, and Z. Wu. 2020. “A POI and LST Adjusted NTL Urban Index for Urban Built-Up Area Extraction.” Sensors (Basel) 20 (10): 2918. doi:10.3390/s20102918.
- Lopez, R., and H. P. Hynes. 2003. “SPRAWL in the 1990S Measurement, Distribution, and Trends.” Urban Affairs Review (Thousand Oaks, CA) 38 (3): 325–355. doi:10.1177/1078087402238805.
- Lu, X., D. Chen, and Y. Wang. 2019. “Is Urban Sprawl Decoupled from the Quality of Economic Growth? Evidence from Chinese Cities.” Sustainability 12 (1): 218. doi:10.3390/su12010218.
- Lu, L., H. Guo, C. Corbane, and Q. Li. 2019. “Urban Sprawl in Provincial Capital Cities in China: Evidence from Multi-Temporal Urban Land Products Using Landsat Data.” Science Bulletin 64 (14): 955–957. doi:10.1016/j.scib.2019.04.036.
- Mills, E. S. 2003. “Urban Sprawl Causes, Consequences and Policy Responses: Gregory D. Squires, Editor. Washington, DC: Urban Institute Press, 2002.” Regional Science and Urban Economics 33 (2): 251–252. doi:10.1016/S0166-0462(02)00061-3.
- Monkkonen, P., A. Comandon, J. A. Montejano Escamilla, and E. Guerra. 2018. “Urban Sprawl and the Growing Geographic Scale of Segregation in Mexico, 1990–2010.” Habitat International 73: 89–95. doi:10.1016/j.habitatint.2017.12.003.
- Mouratidis, K. 2019. “Compact City, Urban Sprawl, and Subjective Well-Being.” Cities 92: 261–272. doi:10.1016/j.cities.2019.04.013.
- Patacchini, E., Y. Zenou, J. V. Henderson, and D. Epple. 2009. “Urban Sprawl in Europe.” Brookings-Wharton papers on urban affairs, 125–149.
- Priem, F., P. Stessens, and F. Canters. 2020. “Microsimulation of Residential Activity for Alternative Urban Development Scenarios: A Case Study on Brussels and Flemish Brabant.” Sustainability 12 (6): 2370. doi:10.3390/su12062370.
- Sahana, M., H. Hong, and H. Sajjad. 2018. “Analyzing Urban Spatial Patterns and Trend of Urban Growth Using Urban Sprawl Matrix: A Study on Kolkata Urban Agglomeration, India.” Science of the Total Environment 628-629: 1557–1566. doi:10.1016/j.scitotenv.2018.02.170.
- Schneider, A., and F. Dispersed. 2008. “Extensive? A Comparison of Urban Growth in Twenty-Five Global Cities Using Remotely Sensed Data, Pattern Metrics and Census Information.” Urban Studies 45 (3): 659–692. doi:10.1177/0042098007087340.
- Shao, Z., N. S. Sumari, A. Portnov, F. Ujoh, W. Musakwa, and P. J. Mandela. 2020. “Urban Sprawl and Its Impact on Sustainable Urban Development: A Combination of Remote Sensing and Social Media Data.” Geo-Spatial Information Science 24 (2): 241–255. doi:10.1080/10095020.2020.1787800.
- Skog, K. L., and M. Steinnes. 2016. “How Do Centrality, Population Growth and Urban Sprawl Impact Farmland Conversion in Norway?” Land Use Policy 59: 185–196. doi:10.1016/j.landusepol.2016.08.035.
- Song, Y., and Y. Zenou. 2006. “Property Tax and Urban Sprawl: Theory and Implications for US Cities.” Journal of Urban Economics 60 (3): 519–534. doi:10.1016/j.jue.2006.05.001.
- Su, Y., X. Chen, Y. Li, J. Liao, Y. Ye, H. Zhang, N. Huang, and Y. Kuang. 2014. “China’s 19-Year City-Level Carbon Emissions of Energy Consumptions, Driving Forces and Regionalized Mitigation Guidelines.” Renewable and Sustainable Energy Reviews 35: 231–243. doi:10.1016/j.rser.2014.04.015.
- Sudhira, H. S., T. V. Ramachandra, and K. S. Jagadish. 2004. “Urban Sprawl: Metrics, Dynamics and Modelling Using GIS.” International Journal of Applied Earth Observation and Geoinformation 5 (1): 29–39. doi:10.1016/j.jag.2003.08.002.
- Su, W., C. Gu, G. Yang, S. Chen, and F. Zhen. 2010. “Measuring the Impact of Urban Sprawl on Natural Landscape Pattern of the Western Taihu Lake Watershed, China.” Landscape and Urban Planning 95 (1–2): 61–67. doi:10.1016/j.landurbplan.2009.12.003.
- Sumari, N. S., P. B. Cobbinah, F. Ujoh, and G. Xu. 2020. “On the Absurdity of Rapid Urbanization: Spatio-Temporal Analysis of Land-Use Changes in Morogoro, Tanzania.” Cities 107: 102876. doi:10.1016/j.cities.2020.102876.
- Sumari, N. S., G. Xu, F. Ujoh, P. I. Korah, O. J. Ebohon, and N. N. Lyimo. 2019. “A Geospatial Approach to Sustainable Urban Planning: Lessons for Morogoro Municipal Council, Tanzania.” Sustainability 11 (22): 6508. doi:10.3390/su11226508.
- Tian, L. 2015. “Land Use Dynamics Driven by Rural Industrialization and Land Finance in the Peri-Urban Areas of China: “The Examples of Jiangyin and Shunde”.” Land Use Policy 45: 117–127. doi:10.1016/j.landusepol.2015.01.006.
- Tian, L., Y. Li, Y. Yan, and B. Wang. 2017. “Measuring Urban Sprawl and Exploring the Role Planning Plays: A Shanghai Case Study.” Land Use Policy 67: 426–435. doi:10.1016/j.landusepol.2017.06.002.
- Tian, L., and W. Ma. 2009. “Government Intervention in City Development of China: A Tool of Land Supply.” Land Use Policy 26 (3): 599–609. doi:10.1016/j.landusepol.2008.08.012.
- Tong, L., S. Hu, A. E. Frazier, and Y. Liu. 2017. “Multi-Order Urban Development Model and Sprawl Patterns: An Analysis in China, 2000–2010.” Landscape and Urban Planning 167: 386–398. doi:10.1016/j.landurbplan.2017.07.001.
- Valiela, I., and P. Martinetto. 2007. “Changes in Bird Abundance in Eastern North America: Urban Sprawl and Global Footprint?” Bioscience 57 (4): 360–370. doi:10.1641/B570410.
- Wang, J., S. Qu, K. Peng, and Y. Feng. 2019. “Quantifying Urban Sprawl and Its Driving Forces in China.” Discrete Dynamics in Nature & Society 2019: 1–14. doi:10.1155/2019/3453850.
- Wang, X., R. Shi, and Y. Zhou. 2020. “Dynamics of Urban Sprawl and Sustainable Development in China.” Socio-Economic Planning Sciences 70: 100736. doi:10.1016/j.seps.2019.100736.
- Wei, Y. D., and R. Ewing. 2018. “Urban Expansion, Sprawl and Inequality.” Landscape and Urban Planning 177: 259–265. doi:10.1016/j.landurbplan.2018.05.021.
- Weilenmann, B., I. Seidl, and T. Schulz. 2017. “The Socio-Economic Determinants of Urban Sprawl Between 1980 and 2010 in Switzerland.” Landscape and Urban Planning 157: 468–482. doi:10.1016/j.landurbplan.2016.08.002.
- Wei, Y. D., and X. Ye. 2014. “Urbanization, Urban Land Expansion and Environmental Change in China.” Stochastic Environmental Research and Risk Assessment 28 (4): 757–765. doi:10.1007/s00477-013-0840-9.
- Wu, Y., S. Li, and S. Yu. 2016. “Monitoring Urban Expansion and Its Effects on Land Use and Land Cover Changes in Guangzhou City, China.” Environmental Monitoring and Assessment 188 (1): 54. doi:10.1007/s10661-015-5069-2.
- Wu, T., S. Yang, M. Liu, G. Qiu, H. Li, M. Luo, and P. Jia. 2020. “Urban Sprawl and Childhood Obesity.” Obesity Reviews: An Official Journal of the International Association for the Study of Obesity 22 (S1): e13091. doi:10.1111/obr.13091.
- Wu, F., and A.G.-O. Yeh. 1997. “Changing Spatial Distribution and Determinants of Land Development in Chinese Cities in the Transition from a Centrally Planned Economy to a Socialist Market Economy: A Case Study of Guangzhou.” Urban Studies 34 (11): 1851–1879. doi:10.1080/0042098975286.
- Xiong, Y., Y. Chen, F. Peng, J. Li, and X. Yan. 2019. “Analog Simulation of Urban Construction Land Supply and Demand in Chang-Zhu-Tan Urban Agglomeration Based on Land Intensive Use.” Journal of Geographical Sciences 29 (8): 1346–1362. doi:10.1007/s11442-019-1663-5.
- Xu, G., T. Dong, P. B. Cobbinah, L. Jiao, N. S. Sumari, B. Chai, and Y. Liu. 2019. “Urban Expansion and Form Changes Across African Cities with a Global Outlook: Spatiotemporal Analysis of Urban Land Densities.” Journal of Cleaner Production 224: 802–810. doi:10.1016/j.jclepro.2019.03.276.
- Yaping, W., and Z. Min. 2009. “Urban Spill Over vs. Local Urban Sprawl: Entangling Land-Use Regulations in the Urban Growth of China’s Megacities.” Land Use Policy 26 (4): 1031–1045. doi:10.1016/j.landusepol.2008.12.005.
- Yew, C. P. 2012. “Pseudo-Urbanization? Competitive Government Behavior and Urban Sprawl in China.” Journal of Contemporary China 21 (74): 281–298. doi:10.1080/10670564.2012.635931.
- Ye, L., and A. M. Wu. 2014. “Urbanization, Land Development, and Land Financing: Evidence from Chinese Cities.” Journal of Urban Affairs 36 (sup1): 354–368. doi:10.1111/juaf.12105.
- Yue, W., Y. Liu, and P. Fan. 2013. “Measuring Urban Sprawl and Its Drivers in Large Chinese Cities: The Case of Hangzhou.” Land Use Policy 31: 358–370. doi:10.1016/j.landusepol.2012.07.018.
- Yue, W., S. Qiu, H. Xu, L. Xu, and L. Zhang. 2019. “Polycentric Urban Development and Urban Thermal Environment: A Case of Hangzhou, China.” Landscape and Urban Planning 189: 58–70. doi:10.1016/j.landurbplan.2019.04.008.
- Zeng, C., Y. Liu, A. Stein, and L. Jiao. 2015. “Characterization and Spatial Modeling of Urban Sprawl in the Wuhan Metropolitan Area, China.” International Journal of Applied Earth Observation and Geoinformation 34: 10–24. doi:10.1016/j.jag.2014.06.012.
- Zhang, T. 2000. “Land Market Forces and Government’s Role in Sprawl: The Case of China.” Cities 17 (2): 123–135. doi:10.1016/S0264-2751(00)00007-X.
- Zhang, G., X. Guo, D. Li, and B. Jiang. 2019. “Evaluating the Potential of LJ1-01 Nighttime Light Data for Modeling Socio-Economic Parameters.” Sensors 19 (6): 1465. doi:10.3390/s19061465.
- Zhang, C., C. Miao, W. Zhang, and X. Chen. 2018. “Spatiotemporal Patterns of Urban Sprawl and Its Relationship with Economic Development in China During 1990–2010.” Habitat International 79: 51–60. doi:10.1016/j.habitatint.2018.07.003.
- Zhao, P. 2011. “Managing Urban Growth in a Transforming China: Evidence from Beijing.” Land Use Policy 28 (1): 96–109. doi:10.1016/j.landusepol.2010.05.004.