
 ?Mathematical formulae have been encoded as MathML and are displayed in this HTML version using MathJax in order to improve their display. Uncheck the box to turn MathJax off. This feature requires Javascript. Click on a formula to zoom.
ABSTRACT
Block Adjustment (BA) is a critical procedure in the geometric processing of satellite images, responsible for compensating and correcting the geometric positioning errors of the images. The accuracy of the photogrammetric products, including Digital Orthophoto Map (DOM), Digital Elevation Model (DEM), Digital Line Graphic (DLG), and Digital Raster Graphic (DRG), directly depends on the accuracy of BA results. In recent years, the rapid development of related technologies such as Artificial Intelligence (AI), Computer Vision (CV), Unmanned Aerial Vehicles (UAVs) and big data has greatly facilitated and transformed the classical BA in photogrammetry. This paper first reviews the current status of BA and then looks into the future. First, this paper provides a brief review of the key technologies involved in BA, including image matching, the establishment of adjustment model, the determination of the parameters and the detection of gross error. Then, taking the intercross and fusion of current technologies such as AI, cloud computing and big data with photogrammetry into account, this paper explores the future trends of photogrammetry. Finally, four typical cases of large-scale adjustment are introduced, including large-scale BA without Ground Control Points (GCPs) for optical stereo satellite images, large-scale BA with laser altimetry data for optical stereo satellite images, large-scale BA for UAV oblique photogrammetry, and large-scale BA for indoor photogrammetry in caves with a large number of close-range images.
1. Introduction
As a crucial procedure in photogrammetric processing, Block Adjustment (BA) aimes to determining the imaging parameters accurately, such as attitude, position, time and the interior orientation elements of each image, thus achieving high-accuracy geometric positioning of targets in the image. Many researchers have conducted lots of research on the theory and method of BA.
In terms of adjustment models, the geometric imaging models commonly utilized at present in photogrammetry mainly include the rigorous geometry model and general geometry model. In aerial and close-range photogrammetry, the BA model usually employs the rigorous imaging model based on collinear equations. Besides, due to its simplicity in form and high fitting-accuracy, the Rational Function Model (RFM) has been widely adopted in geometric processing of remote sensing satellite images. With the advance of adjustment theory and method, the adjustment method has developed from strip BA to independent model BA, and further to bundle BA (BBA). Compared with the other two methods, the BBA establishes a mathematical model based on image coordinate, which is more rigorous in theory, more accurate and liable to systematic error compensation and detection of gross error, and has gradually become the mainstream method of BA. On the basis of strict function model, plenty of researchers have investigated much research on the automatic compensation of system error, the detection of gross error and the distinction between the two types of errors (Li Citation2012). As far as the distinguishability of system error and gross error is concerned, Li Deren developed the distinguishability theory of random error, system error, and gross error, as well as a method which is widely recognized as a groundbreaking contribution that has solved a long-standing problem in the field of mapping. Another classic and extensively explored theory called detection of gross error has been introduced in the prestigious literature, such as the “data snooping” (El-Hakim Citation1982), the “integration method with variable weights”, the “Li Deren method” (Li Citation1983) in photogrammetry and the Random Sample Consensus (RANSAC) (Cantzler Citation1981; Fischler Citation1987) method in computer vision. In terms of mapping method, Fritz Ackerman of the University of Stuttgart, the world authority in surveying, invented the Least Squares Template Matching (LSTM), which significantly improved the automation of mapping. Since then, PAT-B and PAT-M software based on this algorithm have been promoted worldwide. In the late 1980s, Ackermann was committed to integrating Global Positioning System (GPS) into photogrammetry, thus introducing GPS-assisted aerial triangulation.
With respect to data acquisition and processing, the treatment of BA is closely related to the means of data acquisition and the development of instruments and equipment. Because of advances in high-resolution observation technology of the earth, the process of BA has evolved from the adjustment of single photogrammetric observations to the joint adjustment with non-photogrammetric observations such as geodetic observations, Global Navigation Satellite System (GNSS) data and laser-ranging data. On the other hand, the advent of computers has also laid the foundation for the overall processing of multi-source, multi-temporal Earth observation data. Nowadays, satellite images have become primary data resource for photogrammetric products such as DOM and DEM. Thanks to the rapid development of UAV technology, oblique photogrammetry system employs UAVs equipped with oblique cameras to capture multi-view images of ground objects, breaking the limitations that traditional aerial photogrammetry could only obtain images from a vertical perspective, which has been widely adopted across various industries at present.
As the accuracy of attitude and position sensors continues to improve and calibration technology advances, and the emergence of multi-source remote sensing data such as SAR images, laser altimetry data, and global digital terrain models, the BA method has also advanced from relying on GCPs to becoming independent of GCPs. The emergence of new technologies such as sparse matrices and high-performance computing has enabled the expansion of BA from small-scale to large-scale areas. In the past decade, the global aerospace remote sensing industry has experienced rapid growth, with many countries launching high-resolution remote sensing satellites. Among these projects, the launch of the “China high-resolution earth observation system” and “China Space Infrastructure Construction” has extensively prompted the development of aerospace remote sensing in China (Li, Wang, and Jiang Citation2021). The massive amount of global remote sensing data obtained by high-resolution remote sensing satellites has laid the data foundation for global mapping. Block adjustment without GCPs for large-scale regions collaborative with multi-source data has become a development trend for BA of remote sensing images in the future. Meanwhile, the significant breakthroughs in information technology fields such as cloud computing, big data, the Internet of Things (IoT), and Artificial Intelligence (AI) have revolutionized the development of photogrammetry. The combination of photogrammetry and AI is bound to usher in a new era of intelligent photogrammetry.
This paper briefly reviews the technologies related to BBA in recent years, including image matching, block construction, model formulation, parameter solution, and detection of gross error. The following section discusses future trends in photogrammetry in the context of the integration of artificial intelligence, big data and photogrammetry. Then, four typical large-scale adjustment cases are introduced, including large-scale BA without GCPs for optical stereo satellite images, large-scale BA with laser altimetry data for optical stereo satellite images, large-scale BA for UAV oblique photogrammetry and large-scale BA for indoor photogrammetry in caves. Finally, concluding remarks are outlined in Section 5.
2. Review of the progress of BA
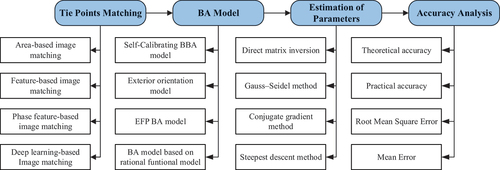
BA is the process of adjusting the parameters of images, with or without GCPs, to eliminate the relative geometric errors between the images and get an accurate transformation between the image and the ground. The process is based on the relationship between overlapping images, control points and the geometric imaging model. With digital data, BA consists of four critical components: image matching, model formulation, parameter solution, and detection of gross error. The overall process diagram is presented in .
Figure 1. Workflow of BA.
2.1. Image matching and block construction
Image matching plays an extreme role in the process of BA, mainly employed to obtain homologous points so as to construct a connection network between the images. The accuracy of subsequent processing would be directly affected by the quality of the image matching. In the stage of analog and analytical photogrammetry, obtaining homonymous points between images was primarily accomplished through manual measurements by the operator, resulting in a heavy workload and low level of automation. The advent of digital photogrammetry has brought about new methods and technologies for matching homonymous points between images. Fully automated image matching and block formulation have become one of the research hotspots in the field of digital photogrammetry.
2.1.1. Image matching
2.1.1.1. Grey-scale based image matching methods
Gray-scale based matching technology is currently mature, and its basic idea is to determine homonymous points between two images by comparing the similarity of pixels around the matching points. Similarity measurements mainly include Sum of Absolute Differences (SAD), Normalized Cross-Correlation (NCC), Mutual Information (MI), and Correlation Coefficient. This type of algorithm does not require image segmentation or feature extraction during the calculation process, which leads to lower preprocessing costs. However, due to its over-reliance on image grayscale information, the gray-scale-based image matching method also suffers from problems such as poor noise resistance, sensitivity to scale and rotation changes, and slow matching speed. Therefore, it is difficult to employ this method in situations involving geometric distortion, noise, and other similar factors. In order to improve the matching speed, Masry (Citation1973) used kernel line correlation to reduce the two-dimensional search space of image correlation to one-dimensional search, thus significantly improving the matching efficiency. Ackermann proposed the Least-Squares Template Matching (LSTM) in 1983, which considers both gray-scale and geometric aberrations of the image and introduces detection of gross error in the matching process, achieving a matching accuracy of 1/10 to 1/100th of a pixel, significantly improving the reliability of image matching. On this basis, the adaptive least squares correlation allows for simultaneous radiometric corrections and local geometrical image shaping, whereby the system parameters are automatically assessed, corrected, and thus optimized during the least-squares iterations (Gruen Citation1985).
2.1.1.2. Feature-based image matching methods
To overcome the dependence on image grayscale values and scale, feature-based matching methods have attracted the attention of scholars. Feature-based image matching methods mainly include three segments: feature extraction, feature description and feature matching. Feature extraction refers to the process of extracting physically significant structural features from images, such as feature points, feature lines or edges, and prominent feature surfaces (Beaudet Citation1978; Harris and Stephens Citation1988; Matas et al. Citation2004; Rosten and Tom Citation2006; Yi et al. Citation2016). Feature description is to quantify the connotation of features based on a specific measurement method, which is generally a numerical vector. Feature matching is the comparison of two feature vectors for similarity in vector space based on the feature description. If the distances are similar, they are judged to be corresponding. Harris corner extraction algorithm defines the point feature from a mathematical point of view (Harris and Stephens Citation1988). This method uses the Hessian matrix and its eigenvalues to determine the feature points, which is easy to calculate, and the detected corner points are rotationally invariant. Förstner and Gülch (Citation1987) proposed a method for finding points in an image with an error ellipse that is as small and close to a circle as possible as feature points by calculating Robert’s gradient value of each pixel and the pixel-centered gray covariance matrix of the window. The method is faster and more accurate than the Harris operator. However, it requires two thresholds to be set during the matching process. Furthermore, the thresholds depend on the image to be processed, which significantly impacts the number of feature points and the accuracy of the alignment. The Scale-Invariant Feature Transform (SIFT) feature point matching algorithm was proposed by Lowe (Citation2004), which has a robust matching ability and is resistant to translation, rotation, affine transformation, perspective transformation and illumination transformation, and could extract stable features, even for images taken at arbitrary angles with a more stable matching ability. Shao et al. (Citation2020) proposed an accurate matching method to project vector data into surveillance video. By introducing the similarity measure of matching support into the SIFT feature matching algorithm.
2.1.1.3. Phase feature-based image-matching methods
The phase congruency model was first proposed by Morrone and Owens (Citation1987), which states that features such as edges usually occur at the location of maximum phase coherence. Oppenheim and Lim (Citation1981) pointed out that many important signal features are preserved in the Fourier spectrum representation if only the signal’s phase is retained. This is also true in image processing, where an image that retains only the phase features will have many of the characteristics of the original image. Furthermore, as the phase mainly characterizes the structural information of the image, the phase coherent edge extraction algorithm has the feature of being insensitive to image brightness and contrast. It, therefore, has a better matching effect on heterogeneous images with significant differences in radiation. In recent years, many researchers have applied the phase consistency model to remote sensing image matching and achieved good matching results (Ye and Shen Citation2016).
2.1.1.4. Deep learning image-matching methods
The deep learning matching methods could acquire higher-level image features by learning sample data’s intrinsic laws and representation levels. Such image features are different from the artificially extracted features in traditional algorithms, which could better characterize the high-level features of images. He et al. (Citation2018) introduced the deep learning method to match multi-source remote sensing images. The results showed that when processing heterogeneous, multi-temporal and multi-resolution satellite images, the deep learning matching methods could extract more corresponding points, and the final matching results have a higher correct rate, which illustrated that the deep learning matching methods could provide a new idea to solve the heterogeneous source. The results show that the deep learning matching methods could provide a new idea to solve the multi-source image matching problem.
2.1.2. Large-scale block construction
Nowadays, there could be thousands or even tens of thousands of images in BA due to the improvement of imaging acquisition efficiency, which presents new challenges for the processing of remote sensing data. Most conventional matching algorithms are based on the Central Processing Unit (CPU) architecture and adopt a serial-mode net, making it difficult to achieve the timely processing requirements for massive remote sensing data. In recent years, the improvement of computer hardware, especially the CPU/Graphics Processing Unit (GPU) hybrid architecture, has greatly enhanced the power of the computing platform, providing a hardware basis for the rapid processing of massive remote sensing data. High-performance architectures represented by CPU/GPU and parallelization algorithms for block construction have gradually become new research hotspots in the domain of photogrammetric processing.
2.1.2.1. Image matching based on GPU
The image matching requires the intensive computation on large amounts of data. However, the calculation process is similar when coping with different images and each pixel could be carried out independently, which has good parallelism for GPU acceleration. Based on the above characteristics, high-performance processing architectures and parallelization algorithms, represented by CPU and GPU, would be effective in accelerating operations. Zhang et al. (Citation2008) used the OpenMP model to implement a parallel algorithm for SIFT feature extraction by means of an eight-core CPU system, achieving a speedup of 6.7 times compared to traditional algorithms, exceeding the general standard for real-time processing of video streams. Kowalczuk, Psota, and Perez (Citation2012) employed a novel local method for stereo matching using a GPU, which is 198 times faster than CPU parallel processing.
2.1.2.2. Parallelization of block construction
The single-threaded method that matches one by one in memory is not able to take advantage of computing resources, which affects the efficiency of BA. As a result, each matching unit could be processed in parallel on different CPU nodes, significantly increasing the efficiency by orders of magnitude. However, BA for large-scale block contains enormous amounts of images and the connectivity relationships between local block are intricate and complex. If this relationship is toughly accumulated, it not only requires a massive number of memory storage but also leads to disorganized point arrangements and uneven distributions, which are unfavorable for subsequent adjustment calculations. Yang et al. (Citation2017) proposed a dynamic topology organization method for large-scale block based on models as units, in which each model is independently and freely numbered without bandwidth required, which effectively solves the problems of efficient matching and selection of connection points in BA for large-scale block.
2.2. Typical BA function models and methods
The functional model in BA describes the functional relationship between observations and unknowns and generally contains geometric and physical models. The function models in BA of optical remote sensing image generally involves two kinds of models, namely the Rigorous Geometric Model (RGM) and the Rational Functional Model (RFM). Photogrammetrists have exploited a strip image-based RGM and a single imagery-based RFM by analyzing the errors of these two models. As data acquisition methods continue to evolve and application scenarios become more complex, new observations or constraints are constantly added to the adjustment model during the development of BA, making BA more applicable.
2.2.1. BA model based on a rigorous imaging geometry model
Aerial and close-range photogrammetry usually establish an accurate BA model by introducing various constraint conditions and optical cameras would adopt central projection to capture image data of the target. However, space photogrammetry usually acquires a strip-like image in the manner of CCD push-broom imaging, unlike aerial photogrammetry, which causes a discrepancy in the exterior orientation element between rows and lines within the images. In order to solve the problem of the difficult direct application of frame-based image processing methods to linear array image processing, many scholars have proposed adjustment models of linear array image represented by Attitude and Orbit Orientation (AOO) and Equivalent Frame Photo (EFP).
2.2.1.1. Self-Calibrating BBA model
In order to eliminate or weaken the systematic errors, the self-calibrating BBA model regards the possible systematic errors as undetermined parameters and estimates them in the determination of BA parameters. This method incorporates camera parameters (interior and exterior orientation parameters) as additional variables to enable precise determination of camera distortion parameters, thereby achieving the objective of camera calibration. Since the Citation1970s, many researchers have conducted extensive research on the system error model (Brown Citation1976; McGlone Citation2016).
2.2.1.2. BA model of attitude and orbit orientation image
Ebner and Kornus (Citation1991) first proposed the exterior orientation model for the geometric correction of the images acquired by the Modular Opto-electronic Multi-spectral Stereo Scanner (MOMS). This method simultaneously computes the coordinates of the object points and the external orientation elements of the three-line array image during adjustment. For the determination of external orientation elements, this method only calculates the external orientation elements for so-called orientation images, which are interpolated at certain time intervals. The parameters of the individual images are represented as functions of the parameters of the neighboring orientation images.
2.2.1.3. EFP BA model
Wang et al. (Citation2017) utilized the coordinates of three-line array CCD image points to form an “Equivalent Frame Photo” for the BBA model. The basic idea of the EFP method is to obtain the EFP point coordinates by the inverse projection of the stereo model constructed from the three-line array CCD images at discrete moments (EFP moments), construct the block with the EFP point coordinates and calculate the external orientation elements of EFP time. In contrast, the external orientation elements at other moments are obtained by interpolation at the EFP moments. Due to the EFP method disperses the satellite route according to a certain interval, when constructing the adjustment model, it is necessary to introduce the constraint condition that the second-order difference of the same kind of EOP is equal to zero, which should be met by the line/angle EOP, to ensure the applicability and stability of EFP method in the parameter solution of satellite image adjustment.
2.2.2. BA model based on rational polynomial model
Different from the BA of aerial photogrammetry, the collinear equation based on the RGM requires detailed information on parameters such as internal and external orientation parameters when sensor imaging of optical satellite images, which is inconvenient in practical use. Optical satellite images usually use RFM instead of RGM. RFM establishes the relationship between the image coordinates and the corresponding object coordinates through ratio polynomials (Grodecki and Dial Citation2003), which is essentially a high-precision mathematical fit to the RGM and could achieve geometric accuracy almost identical to that of the RGM (Tao and Hu Citation2001). It has become the international standard model of remote sensing images, and its specific form is shown in the following formula.
where are the normalized image point coordinates,
denotes the normalized corresponding object coordinates,
and
are higher order polynomials (usually three times). The numerator and denominator of the polynomial are respectively expressed as follows:
It is worth noting that when the RFM model is a first-order polynomial with the same denominator but not constant at 1, the RFM model degenerates into a Direct Linear Transformation (DLT) model, which is commonly used in the field of close-range photogrammetry.
2.2.3. Typical BA methods
During the development of the BA, sensor technology has also evolved, and new data such as position navigation data and DEM have emerged, bringing new observations and constraints to the BA. As the performance of the computing platform increases and the volume of remote sensing image data accumulates, the scale of the block becomes increasingly significant, and the adjustment is often faced without GCPs. A rank-deficient free block is that the unknown number to be solved is the additional parameters of the image side without GCPs and the object side coordinates corresponding to the Tie Points (TPs), the adjustment model has a high degree of freedom, and the coefficient matrix of the standard equation is the rank deficient matrix. In this case, if the parameters to be adjusted are directly solved as free unknowns, the normal equation matrix will be ill-conditioned. As a result, adjustment accuracy will be unstable, and the errors will quickly accumulate excessively, finally leading to the block’s distortion. At the same time, with the rise of computer vision, which also has mapping and localization needs in robot navigation, the theory and methods of Simultaneous Localization And Mapping (SLAM) for mobile robots have been developed accordingly.
2.2.3.1. POS-supported BA model
With the rapid development of Inertial Navigation System (INS) and GPS (the integration of the two is called Position and Orientation System (POS)), POS data could be used to obtain the position and attitude of the sensor in space at the time of imaging. POS-supported BA is to introduce POS data as additional observations into BA and use a unified mathematical model and algorithm to determine the overall point and evaluate its accuracy. Compared with the traditional BA, POS-supported BA could be carried out with little GCPs to ensure accuracy, reduces the production cost and improve operational efficiency. Since the Citation1980s, many researchers (Friess Citation1986; Lucas Citation1987; Schwarz, Fraser, and Gustafson Citation1984; Yuan et al. Citation2009) have conducted extensive research on POS-supported BA which verifies its feasibility.
2.2.3.2. DEM-Aided BA model
Due to the base–height ratio between the corresponding image rays of optical remote sensing satellites is usually small, the corresponding image rays are approximately parallel, which shows a weak intersection phenomenon in the geometric relationship. Under this weak intersection condition, a slight offset in the image space will cause a significant error in the elevation direction. Therefore, converging the object coordinate in the elevation direction in BA is difficult. To solve this problem, DEM could be introduced to constrain the elevation coordinates of the object points in the adjustment process (Teo et al. Citation2010).
When the elevation coordinate values of each TP are constrained based on the DEM elevation reference data, according to the principle of central projection geometric imaging, when the intersection angle is slight, even if the DEM data has a certain elevation error, the relative orientation error of the corresponding image ray caused by it could be ignored. Therefore, when DEM elevation data is introduced as the elevation constraint of corresponding points, the interpolated elevation value in DEM data could be directly used as the actual value.
2.2.3.3. BA method based on Virtual Control Points (VCPs)
In order to improve the model state and restrain the accumulation of errors in the block, Yang et al. (Citation2017) used the initial RPC model of the image to be adjusted in each scene to generate VCPs and introduced the VCPs into the adjustment model as weighted observations. Yang et al. (Citation2017) conducted a nationwide adjustment case without GCPs in China for ZY-3 images and verified it using 8000 high-precision control points distributed the greater Chinese mainland. The results showed that the splicing accuracy of adjacent models in the block was better than 1 pixel, and the absolute accuracy was better than 5 m, proving the adjustment’s feasibility and practicability based on VCPs without GCPs.
2.2.3.4. Adjustment in SfM
Capturing multi-sensor images in SfM 3D reconstruction has the potential to provide more geometric information, leading to improved accuracy and reliability. However, using multi-sensor images also brings new challenges, such as relative positioning, photometric correction, and image matching between different sensors. To overcome these issues, BBA could be utilized to calibrate and optimize multi-sensor images. Furthermore, in the combination of aerial and ground images, BA based on multi-view geometry could also be used to calibrate and optimize the geometric relationship between ground and aerial images (Carrivick, Smith, and Quincey Citation2016).
2.3. Estimation of parameters and accuracy evaluation
In the traditional BA methods, the adjustment parameters are estimated by directly inversing the coefficient matrix, and the unknowns are updated by iterative solutions. The rise of new technologies such as oblique photography and UAV photography has brought great changes to the acquisition of data. Compared with traditional regular aerial photography, more data shows the characteristics of irregular arrangement, different sizes of overlapping areas, and large number of images, which causes problems such as large matrix storage and rapid determination of massive adjustment parameters for the traditional BA method. With the development of computer technology and mathematical theory, researchers have introduced the sparse matrix into the storage of large-scale equations, and used the conjugate gradient method (Hestenes and Stiefel Citation1952) to realize the rapid determination of parameters for large-scale BA.
2.3.1. Estimation of weights
As another important part of BA model, the random model is usually used to describe the precision of the observations and provide reference for the weight determination. In the process of adjustment, the weight of the observations limits the size of the convergence space for the corresponding unknowns and determines the contribution of the observations to the adjustment result. TPs are mostly obtained by the high-precision matching algorithm, so the weights of tie point could be directly set as unit weights. GCPs are generally regarded as absolute constraints in BA, which contributes the most to the final adjustment result, and their weights could be assigned a large value. For other weighted observations, it is necessary to set the weight reasonably according to their prior accuracy.
2.3.2. Storage of large-scale equation
In the determination of adjustment parameters, the number of parameters to be calculated could be reduced by using normalized elimination to eliminate a class of unknowns. However, in the large-scale block, the order of the coefficient matrix after processing is still too high to be solved directly. Considering that all the non-zero elements of the coefficient matrix are concentrated on the diagonal line, and the number of zero elements is greater than that of non-zero, the computer memory used to store the coefficient matrix could be reduced by a more sensible strategy for data storage.
In traditional aerial photogrammetry, the block is constructed according to the regular strip, and the images are organized according to a certain rule to ensure that the distribution of non-zero elements in the normal equation has the minimum bandwidth, thus reducing the amount of computer memory occupied. For the adjustment for UAV images and satellite images, the minimum-bandwidth method is not applicable due to the irregularity of the strip and the complex relationship between images. Considering the sparsity of the coefficient matrix, the rows, columns and values of the non-zero elements of the matrix could be stored to achieve the purpose of compressing the large coefficient matrix and avoiding the operation of zero elements.
2.3.3. Estimation of parameters
When calculating the adjustment parameters of a small-scale BA, it is feasible to directly invert the coefficient matrix. When the order of the coefficient matrix is too high, the method of direct matrix inversion, which includes matrix inversion, the Confluent Huen Equation (CHE), and spectral decomposition, requiring heavy computation, thus decreasing the adjustment efficiency. Additionally, the matrix deformation methods such as Gausselimination, Chelosky decomposition and spectral decomposition might destroy the sparseness of the coefficient matrix (Yang et al. Citation2017). The iterative solution of the large linear matrix could effectively solve the problems faced by direct inversion and matrix deformation. Iterative methods such as Gauss–Sidel and conjugate gradient methods have unparalleled efficiency advantages compared with direct methods because they involve only simple matrix operations. Among them, the conjugate gradient method (Byröd and Åström Citation2010) is one of the most effective methods to solve large linear equations with a positive definite symmetric matrix, which has the advantages of fast convergence and high stability.
2.3.4. Detection of gross error
In terms of the detection of gross error, Professor Baarda from the Netherlands proposed the method of data detection and reliability theory in 1967–1968, which laid the foundation for the detection of gross error (Baarda Citation1967). In the Citation1980s, Li (Citation1983) proposed the iteration method with variable weights based on posteriori variance estimation, which is known as the “Li Deren method”. In 1985, Li (Citation1985) proposed an extended reliability theory based on two multidimensional alternative assumptions, including error discoverability and distinguishability. In addition, Fischler and Bolles proposed the RANSAC in computer vision (Fischler Citation1987). This method could iteratively estimate the parameters of the mathematical model from a set of observation data sets containing gross errors and gradually eliminate the influence of gross errors, which could be used to detect a small number of gross errors in the measurement data.
2.3.5. Accuracy evaluation of results
BA aims to compensate for and correct geometric errors in remote sensing images and solve the problem of spatial positioning of target points. Therefore, the accuracy of adjustment result is an index that people pay much attention to when solving practical problems. The accuracy of adjustment results could be divided into theoretical accuracy and practical accuracy. The theoretical accuracy is to treat the number of coordinate corrections of the point to be determined as a random variable and calculate its variance-covariance matrix in the least squares iteration calculation. The theoretical accuracy reflects the distribution pattern of errors in the block before and after BA and the reliability of the adjustment system, which provides a basis for adjustment quality optimization. The actual accuracy is to set the GCPs with known object coordinates as checkpoints to calculate the difference between the BA results and the accurate object coordinates, which is a more objective method to evaluate the adjustment accuracy.
3. Prospection of the future development of photogrammetry
3.1. Collaborative processing of space–air–ground multi-modal and multi-scale remote sensing data
The development of imaging sensor technology has spurred the emergence of multimodal sensors such as microwave radar, lidar, and optical cameras, which has led to the gradual expansion of data sources from visible light images to encompass a wide range of multi-modal and multi-scale remote sensing data, including SAR images and laser altimetry data. Utilizing multi-modal and multi-scale remote sensing data to observe the same target, the advantages of different data could be integrated and complemented, resulting in geographic spatial information products with higher accuracy and reliability than single data. The integration of multiple sensors across water, land, air, and space has become the trend of the collection equipment for spatial data, providing optimal data conditions for the collaborative processing of multi-modal and multi-scale remote sensing data. For instance, the ZY-3 (Xie et al. Citation2019) and GF-7 (Cao 2021) satellites are equipped with both optical cameras and space-borne laser altimeter, enabling the data acquisition of high-precision laser altimeter data while capturing optical images. Similarly, aerial platforms such as UAVs incorporate laser altimeter and multi-view oblique cameras, thereby facilitating simultaneous acquisition of laser point cloud and surface texture. Joint modeling of laser point clouds and multi-view images is also a burgeoning research direction in 3D reconstruction. Multi-scale cooperative positioning of the air, space, and ground is the future trend of development.
3.2. Intelligent processing of photogrammetry
Photogrammetry and computer vision are two critical technologies in the field of environmental perception that exhibit many similarities with regard to concepts, theories, and methods. Photogrammetry achieves precise geometric image positioning through BA for acquiring spatial information of the Earth and surface objects, while computer vision uses Structure ofMotion (SFM) for 3D object reconstruction and Simultaneous Localization and Mapping (SLAM) for extracting and reconstructing road information and indoor scenes, serving robot navigation, city mapping, intelligent transportation, and autonomous driving. As technologies for perceiving the environment surrounding a target, SFM and SLAM also involve the processing of BA. This happens to be a mature theory and method in BA, and the emergence of open-source codes in this field has promoted the propagation of BA.
On the other hand, accurate image matching is a prerequisite for collaborative processing of multi-modal remote sensing images and is a prominent research topic in both photogrammetry and AI. Photogrammetry commonly uses feature-based and template-based matching methods to obtain homologous points in remote sensing images. However, in the case of multi-modal remote sensing images with significant radiometric and geometric differences, these methods encounter challenges in achieving satisfactory matching results. Matching methods based on deep learning have gained much attention in the field of AI due to their strong generalization and learning ability. They have shown great potential in solving matching of remote sensing image problems in heterogeneous and complex scenes. At the same time, this method provides a new approach and tools for heterogeneous multimodal image matching in photogrammetry. The interdisciplinary integration of artificial intelligence and photogrammetry would further deepen and promote the development of intelligent photogrammetry in the future.
4. Demonstration of typical cases of large-scale BA
In this section, this paper presents four typical cases of large-scale network adjustment, which are (1) large-scale BA without GCPs for optical stereo satellite images, (2) large-scale BA with laser altimetry data for optical stereo satellite images, (3) large-scale BA for UAV oblique photogrammetry, and (4) large-scale BA for indoor photogrammetry in caves with a large number of close-range images.
4.1. Large-scale BA without GCPs for ZY-3 images in China
The ZY-3 is the first civilian high-resolution satellite for stereo mapping launched by China, representing a significant breakthrough in the civilian mapping domain. Its principal application is to generate and revise stereo maps at a scale of 1:50,000, as well as other fundamental geographic products at even greater scales. It is outfitted with a suite of four optical cameras, encompassing a 5.8 m multispectral camera capable of downward-looking imaging, a 2.1 m panchromatic camera with high resolution for downward-looking imaging, as well as two 3.5 m panchromatic cameras for forward and backward viewing. To investigate the potential application of the ZY-3 satellite, a BA experiments of large-scale block of BA without GCPs was conducted (Yang et al. Citation2017).
4.1.1. Introduction of data
In this study, 8802 ZY-3 three linear array stereo images (a total of 26,406 images) from the ZY-3 satellite, covering the greater Chinese mainland, were selected to perform integral BA without GCPs. These images covered more than 9 million km2, approximately 93% of China’s mainland area. All images were provided with the corresponding RPC files. A total of 8000 ground points, measured by GPS with an accuracy of better than 0.1 m, were used as checkpoints.
4.1.2. Results and analysis
In the case of large-scale BA without GCPs for optical satellite images, the number of TPs obtained by automatic matching of massive images could reach hundreds of millions, and there must be a large number of mismatch points. If these mismatch points are introduced into the BA, it will lead to the distortion of the block and affect the reliability of the final adjustment results. To address this problem, the RANSAC algorithm was used to eliminate the mismatch points in the match results and further designed a method for multi-level detection of gross error, effectively reducing the influence of mismatching points on adjustment results. Massive TPs require a huge amount of computation, and it will take a long time to complete if we follow the image-by-image matching strategy. Therefore, a parallel TPs matching strategy was designed to realize uniformly distributed high-precision tie points within 2 h by using 100 high-performance computing nodes (6-core Xeon-L7455 CPU and 128 GB internal memory for each node). After realizing the efficient and reliable TPs matching, the next step is to use the obtained TPs to construct and calculate the ultra-scale block. However, in the absence of ground control constraints, the BA model has a high degree of freedom, and directly solving the parameters to be adjusted will lead to ill-conditioned standard equations, making it difficult to guarantee the accuracy of adjustment results. The VCPs are introduced as additional observations to constrain the degree of block freedom to improve the adjustment model. As previously stated, the weight of the observation value determines the image degree of the adjustment result. In order to make use of VCPs to improve the BA model state and avoid the bad influence caused by poor prior accuracy of the image to be adjusted, this case found after many cases that the weight of VCPs could be determined according to prior accuracy of the images but to avoid “weak” tie and “strong” control, it needs to be multiplied by the number ratio of VCPs and TPs in the image where the VCPs are located. In this case, we divided each scene image into grids evenly on the image side and generated virtual control points for the center of each grid according to the above method. Each scene image generated nine virtual control points, and a total of virtual control points were generated. In this case, the unknowns to be solved are the object coordinates corresponding to the TPs and the image compensation parameters of all images. After constructing the error equation and normalizing the elimination, this case solved the storage problem of ultra-high order equations by using a sparse matrix ternary structure to record and store the non-zero elements in each row of the matrix and further realized the efficient solution of 9,158,406 unknowns by using the conjugate gradient method. It only took 15 min for two iterations on PC (8 GB internal storage) to obtain reliable adjustment results. Finally, the geometric accuracy of the DOM and DSM products produced automatically after BA was verified using approximately 8000 high-precision GCPs distributed throughout the greater Chinese mainland, with RMSE of less than 5 m in both plane and elevation. In contrast, the geometric stitching accuracy between adjacent images within the block was better than 1 pixel, meeting the requirement of seamless stitching.
4.2. Large-scale BA with Laser Altimetry Data for ZY-3 images in ShanDong
In 2003, the United States successfully launched ICESat (Schutz et al. Citation2005), the first Earth-based laser altimetry satellite, with a high-precision Geoscience Laser Altimeter System (GLAS). GLAS is the first spaceborne laser altimeter with the function of echo signal storage, processing and transmission among many spaceborne laser altimeter systems in the world. The elevation accuracy of laser altimetry data obtained by GLAS could achieve 15 cm, but its planimetric accuracy is relatively weak due to its laser spot diameter of about 70 m (Zwally et al. Citation2002).
4.2.1. Introduction of data
In this study, the experimental area in Shandong Province of China covered a region of 114°19′ to 122°43′ E and 34°22′ to 38°23′ N. The topography in this area is primarily plains and mountainous/hilly, which occupy 65.56% and 30.98% of the total land area, and the elevation range is 2–1532 m. The experimental data included 112 ZY-3 Three Linear Cameras (TLC) imagery pairs and 349,399 GLAS points. The Citation1091 GCPs in the experimental area, obtained from field surveys using GPS with an accuracy of better than 0.2 m, were used as checkpoints.
4.2.2. Results and analysis
To validate the improvement in elevation accuracy of ZY-3 without GCPs using laser altimetry data, an experiment of large-scale block in the entire area of Shandong province was conducted (Deng Citation2018). As the GLAS spot diameter range is large and the elevation reflects the average elevation within the spot, it is important to filter the GLAS data to extract laser altimetry data with good-quality measurements and less undulating terrain within the spot range. A three-stage laser point availability screening mechanism was designed to filter the available data, including coarse screening based on GLAS parameters, fine screening based on waveform data and re-screening based on stereo image pairs of TPs, through which a total of 1874 available laser points were obtained. In order to verify the improvement of the adjustment elevation accuracy of ZY-3 with the introduction of laser altimetry data without GCPs, a large-scale BA was carried out over the whole survey area of Shandong Province. After adjustment, the mean elevation error of 911 checkpoints improved from −2.297 m to 0.216 m, and RMSE improved from 3.193 m to 2.007 m. The final test results show that the introduction of spaceborne laser altimetry data as vertical control into the BA for optical stereo images could effectively eliminate systematic errors in elevation.
4.3. Large-scale urban BA of low-altitude UAV
Oblique photogrammetry plays a pivotal role in the city-level construction of real 3D of China. Typically, it involves deploying a five-lens camera mounted on a drone platform to scan the ground, generating high-overlap and multi-angle images with ground resolution better than 5 cm. These images are then utilized to produce and update high-precision base maps and 1:500 topographic maps. The oblique camera system typically comprises a downward-looking camera and four oblique-angle cameras to acquire multi-angle images of ground objects from all directions. However, the urban-level oblique image data often have volumes of hundreds of thousands or even millions due to their rich features, thereby posing a challenge to BA of large-scale block. In order to explore the potential application of massive oblique image data in BA with GCPs for large-scale block, this project performed a BA case with GCPs for large-scale block and analyzed its precision and efficiency as the key indicators.
4.3.1. Introduction of data
In a high-rise dense urban area, the oblique image data was collected by the five-lens oblique photography platform carried by DJI M600 UAV. The camera model is SONY ILCE-7RM2, the image size is 7952 × 5304, and the effective pixel is 42 million. There were 112 flights, covering 50 square kilometers, and the ground sampling distance was better than 0.03 m. At the same time, a total of 22 high-precision control points are collected for absolute position accuracy control, and 11 checkpoints are used for overall accuracy verification. In the actual acquisition process, the altitude of the test flight is 200 m, the focal length of the nadir camera is 40 mm, and the focal lengths of the other four side-looking cameras are all 56 mm, and a total of 603,735 images are collected.
4.3.2. Results and analysis
In the adjustment process, a total of 598,293 photos were accessed by the block, and 19,629,242 TPs were obtained. After the adjustment, the checkpoint’s RMSE reaches 0.045 m in the plane and 0.038 m in elevation, and the results of the adjustment are shown in and . At the same time, in order to solve the problem of huge unknowns in massive disordered images, a distributed method based on the alternating method is introduced to solve the large-scale BA. It takes 23.8 h to iteratively solve the problem on a PC (Dual-core Intel-i7 9700k, 64 GB internal storage) which has 10 nodes, and a reliable adjustment result is obtained. This case shows that the introduction of the alternating method-based solution method could effectively improve the solving efficiency and result accuracy of large-scale BA for massive unordered near-field images.
Figure 2. Distribution of residual elevation before and after the introduction of laser points in the test area of Shandong Province.
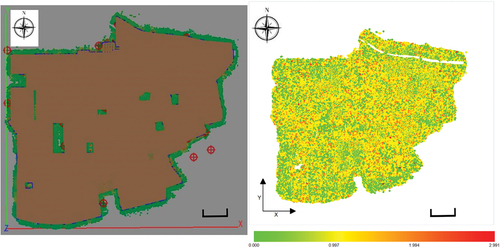
Table 1. Statistical table of checkpoint accuracy (m).
4.4. Large-scale indoor photogrammetry BA for massive disordered multi-view images
To validate the practicality of BA techniques for large-scale block that rely on high-resolution multi-view imagery obtained from massive disordered close-range photogrammetry, we conducted a study employing the alternating method to solve the BA problem for large-scale block. Our research focused on evaluating the efficiency and accuracy of the BA approach using disordered imagery for large-scale applications. Here, we present a succinct overview of the case study.
4.4.1. Introduction of test area
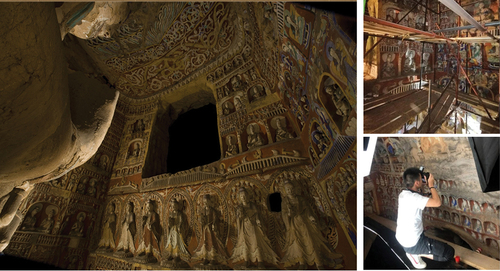
The 13th Cave of Yungang Grottoes contains a large Buddha statue with a height of more than 10 m and painted walls. At the same time, the wall of the cave contains hundreds of niches and thousands of high reliefs, which are about 11 m wide from east to west, 9 m deep and 13.6 m high, which makes it very difficult to obtain data. A total of 21 control points and 10 checkpoints were collected, and the accuracy of control point was better than 3 mm. Typically, 300 DPI resolution is required for digital archiving of cultural relics. Hence, a total of 283,431 original images (15.1TB in total) were collected by setting up scaffolding and other auxiliary photo-taking measures as shown in .
Figure 3. 13th Cave of Yungang Grottoes and data collection site.
4.4.2. Results and analysis
In the adjustment process, a total of 239,746 images were entered into the block, and 87,974,484 TPs were obtained. The RMSE of the image square after adjustment was 0.953 pixels, and the RMSE of checkpoint accuracy reached 0.009 m in the plane and 0.01 m in elevation. The results of the adjustment are shown in and . At the same time, in order to solve the problem of huge unknowns in massive disordered images, a distributed method based on the alternating method is introduced to solve the large-scale BA. It takes 8 h to iteratively solve the problem on a PC (Dual-core Intel-i7 9700k, 64 GB internal storage) which has 10 nodes, and a reliable adjustment result is obtained. This case shows that the introduction of the alternating method-based solution method could effectively improve the solving efficiency and result accuracy of large-scale BA for massive unordered near-field images.
Figure 4. Schematic diagram of aerial triangulation.
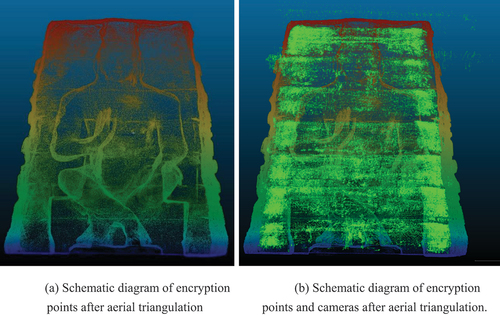
Table 2. Checkpoint accuracy.
5. Discussion
This section introduces four typical large-scale BA experiments to the readers. From the first experiment, it can be seen that with the improvement of the measurement accuracy of parameters such as satellite attitude determination, orbit determination, and timing, the original geometric accuracy of satellite images has been significantly improved. Through large-area joint adjustment, the positioning accuracy can be further improved under the condition of no control points. In the second experiment, the joint adjustment of satellite-borne high-precision laser altimetry data and optical stereo imaging satellite images was conducted. The experimental results show that under the condition of no GCPs, the use of satellite-borne laser-ranging data can improve the elevation accuracy of satellite images from an error of 3.193 m to 2.007 m. In the third experiment, with the rapid development of unmanned aerial photography technology, the overall BA method was used to provide a city digital twin base with centimeter-level accuracy under controlled conditions. In the fourth experiment, the BA method was used to provide a millimeter-level accuracy technical method for the digital archiving application of complex immovable cultural relics.
6. Conclusions
This paper presents a comprehensive review of the core techniques in BA and provides an overview of the future trends in photogrammetry. Experiments are performed with four typical BA cases for large-scale block conducted. The experimental results clearly demonstrate the significant importance of BA for detecting and compensating for systematic errors, various accidental errors, and gross errors in various photogrammetric scenarios, including space photogrammetry, UAV oblique photogrammetry, and close-range photogrammetry in complex scenes inside caves, with or without GCPS.
Photogrammetry, as an established applied discipline, has undergone momentous advancements in the past few decades, owing to the collaborative efforts of numerous scholars in the domain of theories, methods, and technologies. Its scope has expanded gradually to encompass BA without GCPs for large-scale block such as cities, countries, and even the entire globe. Moreover, mapping operations have gradually extended with GCPs and without GCPs, with a focus on fully automatic workflows. Additionally, this field has witnessed the evolution of fully automatic BA methods from sparse encryption to direct generation of DOM and DSM. Fortunately, photogrammetry, as an interdisciplinary applied science, has continuously advanced and evolved, driven by developments in sensor technology, computer technology, and relevant mathematical theories. It is moving toward intelligent and automated development, as it increasingly integrates with computer vision, machine learning, and AI.
Acknowledgments
The ZY-3 satellite data with nationwide coverage and the associated processing environment utilized in this study were provided by the China Center for Resources Satellite Data and Application (CRESDA). We express our sincere appreciation to CRESDA for their invaluable support in this case research.
Disclosure statement
No potential conflict of interest was reported by the author(s).
Data availability statement
The ZY-3 stereo imagery data that support the findings of this study are restricted in access and use, but can be queried and requested from the website of the China Centre for Resources Satellite Data and Application (CRESDA) (http://www.cresda.com/EN/) and Chinese Natural Resources Satellite Remote Sensing Cloud Service Platform (http://sasclouds.com/chinese/normal/). The GLAS/ICESat data are openly available and can be acquired from the National Snow & Ice Data Center (NSIDC) at https://nsidc.org/data/.
Additional information
Funding
Notes on contributors
Deren Li
Deren Li is a professor and chair of the Academic Committee of the State Key Laboratory for Information Engineering in Surveying, Mapping, and Remote Sensing, Wuhan University. He was selected as a member of Chinese Academy of Sciences in 1991 and a member of Chinese Academy of Engineering in 1994. He got his PhD degree from University of Stuttgart, Germany. He was awarded the title of honorary doctor from ETH, Switzerland in 2008. He has been awarded the Brock Gold Medal in recognition of outstanding contribution to photogrammetry in 2020. His research interests include photogrammetry and remote sensing, global navigation satellite system, geographic information system, and their innovation integrations and applications.
Bo Yang
Bo Yang is a professor at the State Key Laboratory of Information Engineering in Surveying, Mapping, and Remote Sensing, Wuhan University. He received the PhD degree from Wuhan University in 2014. His research interests include automatic match, change detecting, and high-precision geometric processing of remote sensing imagery.
Mi Wang
Mi Wang is a professor at the State Key Laboratory of Information Engineering in Surveying, Mapping, and Remote Sensing, Wuhan University. He received the PhD degree from Wuhan University in 2001. His research interests include high-resolution remote sensing satellite ground processing and the integration and rapid update of photogrammetry and GIS.
Taiping Wang
Mi Wang is a professor at the State Key Laboratory of Information Engineering in Surveying, Mapping, and Remote Sensing, Wuhan University. He received the PhD degree from Wuhan University in 2001. His research interests include high-resolution remote sensing satellite ground processing and the integration and rapid update of photogrammetry and GIS.
Taiping Wang received the B.Eng. and M.Sc. degrees in photogrammetry and remote sensing from Wuhan University, Wuhan, China, in 2018 and 2021, respectively. He is currently pursuing the PhD degree at the State Key Laboratory of Information Engineering in Surveying, Mapping, and Remote Sensing at Wuhan University. His research interests include high precision remote sensing image processing and the processing of spaceborne laser altimetry data.
Yunlong Gao
Yunlong Gao is a postdoc at the State Key Laboratory of Information Engineering in Surveying, Mapping and Remote Sensing (LIESMARS), Wuhan University. He received his B.E. and Ph.D. degrees in Remote Sensing and Photogrammetry from the Wuhan University in 2010 and 2017. His research interests lie in the field of photogrammetry, particularly including 3D reconstruction, image processing as well as their applications in digital twin cities, digitalization of antique and museum.
Yingdong Pi
Yingdong Pi received the B.Eng. and M.Sc. and Ph.D. degrees in photogrammetry and remote sensing from Wuhan University, Wuhan, China, in 2014, 2017, and 2021, respectively. Now, he is a Postdoctoral Fellow of the State Key Laboratory of Information Engineering in Surveying, Mapping, and Remote Sensing at Wuhan University. His research interests include high precision remote sensing image processing and deep space detection.
References
- Baarda, W. 1967. Statistical Concepts in Geodesy. Delft: Rijkscommissie voor geodesie. https://doi.org/10.54419/bjdeu2.
- Beaudet, P. R. 1978. “Rotationally Invariant Image Operators.” Proceedings of the 4th International Joint Conference Pattern Recog, Tokyo, Japan. https://doi.org/10.1587/transfun.E96.A.1376.
- Brown, D. C. 1976. “The Bundle Adjustment: Progress and Prospects.” The 13th Congress of the International Society for Photogrammetry, Helsinki, Finland. http://lear.inrialpes.fr/people/triggs/pubs/Brown-IAP76.pdf.
- Byröd, M., and K. Åström. 2010. “Conjugate Gradient Bundle Adjustment.” ECCV 6312:114–127. https://doi.org/10.1007/978-3-642-15552-9_9.
- Cantzler, H. 1981. “Random Sample Consensus (Ransac).” Institute for Perception, Action and Behaviour, Division of Informatics, University of Edinburgh, 3. https://www.cvl.iis.u-tokyo.ac.jp/~oishi/Papers/Alignment/ransac.pdf.
- Carrivick, J. L., M. W. Smith, and D. J. Quincey. 2016. Structure from Motion in the Geosciences. West Sussex, New Jersey: Wiley.
- Deng, K. 2018. Study on ZY-3 Regional Network Adjustment Method Assisted by Laser Altimetry Data GLAS. Wuhan, Hubei, China: Wuhan University.
- Ebner, H., and W. Kornus. 1991. “Point Determination Using MOMS-02/D2 Imagery.” Geoscience and Remote Sensing Symposium, 1991. IGARSS ’91. Remote Sensing: Global Monitoring for Earth Management., International 1743–1746. https://doi.org/10.1109/IGARSS.1991.579582.
- El-Hakim, S. F. 1982. “Data Snooping with Weighted Observations.” Symposium of ISP Comn. III, Helsinki.
- Fischler, M. A. 1987. “Readings in Computer Vision || Random Sample Consensus: A Paradigm for Model Fitting with Applications to Image Analysis and Automated Cartography.” Readings in Computer Vision 726–740. https://doi.org/10.1145/358669.358692.
- Förstner, W., and E. Gülch. 1987. “A Fast Operator for Detection and Precise Location of Distinct Points, Corners and Centres of Circular Features.” Paper presented at Proceedings of the ISPRS Intercommission Confe-rence on Fast Processing of Phonogrammic Data, Interlaken, 2-4 June 1987, 281–305.
- Friess, P. 1986. “A Simulation Study on the Improvement of Aerial Triangulation by Navigation Data.” Proceedings of the Symposium, Comm. III, ISPRS.
- Grodecki, J., and G. Dial. 2003. “Block Adjustment of High-Resolution Satellite Images Described by Rational Polynomials.” Photogrammetric Engineering & Remote Sensing 69 (1): 59–68. https://doi.org/10.14358/PERS.69.1.59.
- Gruen, A. 1985. “Adaptive Least Squares Correlation: A Powerful Image Matching Technique.” South African Journal of Photogrammetry, Remote Sensing and Cartography 14 (3): 175–187.
- Harris, C., and M. Stephens. 1988. “A Combined Corner and Edge Detector.” Alvey Vision Conference 15 (50). https://citeseerx.ist.psu.edu/document?repid=rep1&type=pdf&doi=88cdfbeb78058e0eb2613e79d1818c567f0920e2.
- He, H., M. Chen, T. Chen, and D. Li. 2018. “Matching of Remote Sensing Images with Complex Background Variations via Siamese Convolutional Neural Network.” Remote Sensing 10 (2): 355. https://doi.org/10.3390/rs10020355.
- Hestenes, M. R., and E. Stiefel. 1952. “Methods of Conjugate Gradients for Solving Linear Systems.” Journal of Research of the National Bureau of Standards 49 (6): 409. https://doi.org/10.6028/jres.049.044.
- Kowalczuk, J., E. T. Psota, and L. C. Perez. 2012. “Real-Time Stereo Matching on CUDA Using an Iterative Refinement Method for Adaptive Support-Weight Correspondences.” IEEE Transactions on Circuits and Systems for Video Technology 23 (1): 94–104. https://doi.org/10.1109/TCSVT.2012.2203200.
- Li, D. R. 1983. “Ein Verfahren zur Aufdeckung grober Fehler mit Hilfe der a posteriori-Varianzschätzung.” Bildmessung und Luftbildwesen 51 (5): 184–187.
- Li, D. R. 1985. Theorie und Untersuchung der Trennbarkeit von groben PaBpunktfehlernund systematischen Bildfehlern bei der photogrammetrischen Punktbestimmung. Germany: Stuttgart, Baden W ü rttemberg.
- Li, D. R. 2012. Error Processing and Reliability Theory. Wuhan: Wuhan university press.
- Li, D. R., M. Wang, and J. Jiang. 2021. “China’s High-Resolution Optical Remote Sensing Satellites and Their Mapping Applications.” Geo-Spatial Information Science 24 (1): 85–94. https://doi.org/10.1080/10095020.2020.1838957.
- Lowe, D. G. 2004. “Distinctive Image Features from Scale-Invariant Keypoints.” International Journal of Computer Vision 60 (2): 91–110. https://doi.org/10.1023/B:VISI.0000029664.99615.94.
- Lucas, J. R. 1987. “Aerotriangulation without Ground Control.” Photogrammetric Engineering and Remote Sensing 53 (3): 311–314. asprs.org/wp-content/uploads/pers/1987journal/mar/1987_mar_311-314.pdf.
- Masry, S. E. 1973. “An Automatic Method for Height Profile Determination.” Photogrammetric Record 7 (42): 728–730. https://doi.org/10.1111/j.1477-9730.1973.tb01212.x.
- Matas, J., O. Chum, M. Urban, and T. Pajdla. 2004. “Robust Wide-Baseline Stereo from Maximally Stable Extremal Regions.” Image and Vision Computing 22 (10): 761–767. https://doi.org/10.1016/j.imavis.2004.02.006.
- McGlone, J. C. 2016. Manual of Photogrammetry. 6th ed. Louisiana, USA: ASPRS.
- Morrone, M. C., and R. A. Owens. 1987. “Feature Detection from Local Energy.” Pattern Recognition Letters 6 (5): 303–313. https://doi.org/10.1016/0167-86558790013-4.
- Oppenheim, A. V., and J. S. Lim. 1981. “The Importance of Phase in Signals.” Proc IEEE 69 (5): 529–541. https://doi.org/10.1109/PROC.1981.12022.
- Rosten, E., and D. Tom. 2006. “Machine Learning for High-Speed Corner Detection.” European conference on computer vision. Springer, Berlin, Heidelberg, pp. 430–443. https://doi.org/10.1007/11744023_34.
- Schutz, B., H. Zwally, C. A. Shuman, D. Hancock, and J. P. DiMarzio. 2005. “Overview of the ICESat Mission.” Geophysical Research Letters 32 (21). https://doi.org/10.1029/2005GL024009.
- Schwarz, K. P., C. S. Fraser, and P. C. Gustafson. 1984. “Aerotriangulation without Ground Control.” International Archives of Photogrammetry and Remote Sensing 25 (A1): 237. https://www.asprs.org/wp-content/uploads/pers/1987journal/mar/1987_mar_311-314.pdf.
- Shao, Z., C. Li, D. Li, O. Altan, L. Zhang, and L. Ding. 2020. “An Accurate Matching Method for Projecting Vector Data into Surveillance Video to Monitor and Protect Cultivated Land.” ISPRS International Journal of Geo-Information 9 (7): 448. https://doi.org/10.3390/ijgi9070448.
- Tao, C. V., and Y. Hu. 2001. “A Comprehensive Study of the Rational Function Model for Photogrammetric Processing.” Photogrammetric Engineering & Remote Sensing 67 (12): 1347–1357. https://www.asprs.org/wp-content/uploads/pers/2001journal/december/2001_dec_1347-1357.pdf.
- Teo, T. A., L.-C. Chen, C.-L. Liu, Y.-C. Tung, and W.-Y. Wu. 2010. “DEM-Aided Block Adjustment for Satellite Images with Weak Convergence Geometry.” IEEE Transactions on Geoscience & Remote Sensing 48 (4): 1907–1918. https://doi.org/10.1109/TGRS.2009.2033935.
- Wang, J., R. Wang, X. Hu, and Z. Su. 2017. “The On-Orbit Calibration of Geometric Parameters of the Tian-Hui 1 (TH-1) Satellite.” Isprs Journal of Photogrammetry & Remote Sensing 124:144–151. https://doi.org/10.1016/j.isprsjprs.2017.01.003.
- Xie, J., F. Hu, Z. Wang, M. He, Y. Zhen, and H. Zhu. 2019. “Composite Geolocating of ZY-3-02 Laser Altimetry Data and Optical Satellite Stereo Imagery.” IEEE International Geoscience and Remote Sensing Symposium (IGARSS), JAPAN, July 28-August 02. https://doi.org/10.1109/IGARSS.2019.8898240.
- Yang, B., M. Wang, W. Xu, D. Li, J. Gong, and Y. Pi. 2017. “Large-Scale BA without Use of Ground Control Points Based on the Compensation of Geometric Calibration for ZY-3 Images.” ISPRS Journal of Photogrammetry and Remote Sensing 134:1–14. https://doi.org/10.1016/j.isprsjprs.2017.10.013.
- Ye, Y., and L. Shen. 2016 . “Hopc: A Novel Similarity Metric Based on Geometric Structural Properties for Multi-Modal Remote Sensing Image Matching.” 23rd ISPRS Congress, CZECH REPUBLIC 12–19. July. https://doi.org/10.5194/isprsannals-III-1-9-2016.
- Yi, K. M., E. Trulls, V. Lepetit, and P. Fua 2016. “Lift: Learned Invariant Feature Transform.” European conference on computer vision. Springer, Cham, 467–483. https://doi.org/10.1007/978-3-319-46466-4_28.
- Yuan, X., J. Fu, H. Sun, and C. Toth. 2009. “The Application of GPS Precise Point Positioning Technology in Aerial Triangulation.” ISPRS Journal of Photogrammetry and Remote Sensing 64 (6): 541–550. https://doi.org/10.1016/j.isprsjprs.2009.03.006.
- Zhang, Q., Y. Chen, Y. Zhang, and Y. Xu. 2008. “SIFT Implementation and Optimization for Multi-Core Systems.” 2008. IEEE International Symposium on Parallel and Distributed Processing. IEEE. https://doi.org/10.1109/IPDPS.2008.4536131.
- Zwally, H. J., B. Schutz, W. Abdalati, J. Abshire, C. Bentley, A. Brenner, J. Bufton, et al. 2002. “Icesat’s Laser Measurements of Polar Ice, Atmosphere, Ocean, and Land.” Journal of Geodynamics 34 (3–4): 405–445. https://doi.org/10.1016/S0264-3707(02)00042-X.