
 ?Mathematical formulae have been encoded as MathML and are displayed in this HTML version using MathJax in order to improve their display. Uncheck the box to turn MathJax off. This feature requires Javascript. Click on a formula to zoom.
ABSTRACT
The coronavirus pandemic that started in 2019 has had wide-ranging impacts on many aspects of people’s daily lives. At the peak of the outbreak, lockdown measures and social distancing changed the ways in which cities function. In particular, they had profound impacts on urban transportation systems, with public transport being shut down in many cities. Bike share systems (BSS) were widely reported as having experienced an increase in demand during the early stages of the pandemic before returning to pre-pandemic levels. However, the studies published to date focus mainly on the first year of the pandemic, when various waves saw continual relaxing and reintroductions of restrictions. Therefore, they fall short of exploring the role of BSS as we move to the post-pandemic period. To address this gap, this study uses origin-destination (O-D) flow data from London’s Santander Cycle Hire Scheme from 2019–2021 to analyze the changing use of BSS throughout the first two years of the pandemic, from lockdown to recovery. A Gaussian mixture model (GMM) is used to cluster 2019 BSS trips into three distinct clusters based on their duration and distance. The clusters are used as a reference from which to measure spatial and temporal change in 2020 and 2021. In agreement with previous research, BSS usage was found to have declined by nearly 30% during the first lockdown. Usage then saw a sharp increase as restrictions were lifted, characterized by longer, less direct trips throughout the afternoon rather than typical peak commuting trips. Although the aggregate number of BSS trips appeared to return to normal by October 2020, this was against the backdrop of continuing restrictions on international travel and work from home orders. The period between July and December 2021 was the first period that all government restrictions were lifted. During this time, BSS trips reached higher levels than in 2019. Spatio-temporal analysis indicates a shift away from the traditional morning and evening peak to a more diffuse pattern of working hours. The results indicate that the pandemic may have had sustained impacts on travel behavior, leading to a “new normal” that reflects different ways of working.
1. Introduction
The coronavirus pandemic that started in 2019 has had wide-ranging impacts on many aspects of people’s daily lives. At the peak of the outbreak, lockdown measures and social distancing changed the ways in which cities function, with many people shifting from daily commuting to working from home, leading to both short and long term changes to mobility patterns (Elarde et al. Citation2021; Shepherd et al. Citation2021). Although restrictions have now eased in many countries due to effective containment measures and the rollout of vaccines, flexible working continues at a higher level than in the pre-pandemic world, with a recent study estimating that the number of days spent working from home will rise from 0.69 to 1.29 per week (Jain, Currie, and Aston Citation2022). The impact of this change on travel and commuting patterns in cities remains to be seen and is the subject of ongoing research.
One of the positive impacts of the pandemic was the reported increase in the mode share of cycling. Cycling is a nonpolluting mode that has significant health benefits for individuals compared with alternative modes (Teixeira, Silva, and Moura e Sá Citation2021; Woodcock et al. Citation2014). With fewer cars on the road during restrictions, citizens have been more inclined to cycle and this has been matched by a concerted effort from many governments to promote cycling through short-term infrastructure changes such as “pop-up” bike lanes and low traffic neighborhoods (LTNs). In an analysis of 106 European cities, Kraus and Koch (Citation2021) found that such policies increased cycling between 11% and 48% on average. However, as more people have returned to work and schools have reopened, the level of road traffic has begun to increase, which is compounded by the fact that many people are less inclined to travel on crowded public transport, at least in the short term (Nouvellet et al. Citation2021). Furthermore, anecdotally there has been opposition to the cycling infrastructure schemes from those who claim they increase traffic congestion and are under-utilized, despite clear evidence that they reduce injuries (Aldred and Goodman Citation2021; Laverty, Aldred, and Goodman Citation2020).
For those without access to their own bicycle, cycle hire schemes are one of the most accessible ways to cycle, for utilitarian or leisure purposes (Lathia, Ahmed, and Capra Citation2012). Lovelace et al. (Citation2020) found that London’s cycle hire scheme has saw growth in lower income areas before the pandemic, particularly in the AM peak commuting time. The primary pre-pandemic use of cycle hire schemes in many cities was to fulfil the “last mile” of commuting trips (Ji et al. Citation2017), resulting in a two-peak profile on weekdays (Fishman Citation2016). For example, in London’s Santander Cycles system, the busiest locations were around the main train stations and employment centers such as the City of London. The secondary usage of the systems is for leisure trips, often linked to tourism. These trips typically take place outside the morning and afternoon peak hours, particularly on weekends, and are spatially concentrated in tourist hotspots and green spaces. It has been widely reported that the Santander Cycles scheme experienced an upsurge in demand in the early stages of the UK’s national lockdown, despite the lack of commuting trips taking place (Transport for London Citation2021). Towards the latter part of 2020 the overall usage of the system appeared to have returned to pre-pandemic levels (Heydari et al. Citation2021). However, there are two important points to note: 1) Most of the UK working population were under instruction to work from home if possible during this period; 2) International and domestic tourism was restricted during most of this period. Therefore, we can hypothesize that the total usage masked significant spatiotemporal differences in the pattern of usage compared with the pre-pandemic period. In order to fully understand the impact of the pandemic on London’s BSS, it is necessary to continue to monitor its usage as restrictions continue to be lifted.
This paper aims to provide insights into the changing usage of London’s Santander Cycles Bicycle Sharing System (BSS) for the duration of the pandemic in 2020–21, using 2019 as a baseline. In doing so, it goes beyond BSS research from the early pandemic to reveal insights into sustained changes in mobility as covid restrictions are lifted. To achieve this aim, we propose a simple method to separate the trips into different trip types using a data driven approach. We then explore the changes in the balance of these activity types in terms of temporal and spatial dimensions. The proposed approach is fast to implement and applicable to any bike sharing system that collects origin-destination (OD) flow data between docking stations, making it generalizable to other systems worldwide. The remainder of this paper is structured as follows. In Section 2 we review the literature on trip purpose estimation in cycle hire data and the impact of the coronavirus pandemic on urban transport. Section 3 presents the data and methodological framework. Section 4 presents the results, before conclusions and future directions are presented in Section 5.
2. Literature review
2.1. Impact of COVID-19 on urban transportation systems
Many empirical studies have revealed that lockdown policies implemented in response to the outbreak of COVID-19 led to significant decline in urban transport trips (Chang et al. Citation2021; De Vos Citation2020; Degli Esposti, Mortara, and Roberti Citation2021; Huang et al. Citation2020; Katrakazas et al. Citation2020; Tirachini and Cats Citation2020). In terms of public transit, ridership was found to have declined during morning and evening peaks as commuting trips reduced (Wilbur et al. Citation2020). In many cases, this reduction was between 80–90% (Apple COVID-19 mobility report Citation2021; Bucsky Citation2020; Wang et al. Citation2020). However, non-commuting trips were also impacted; a comparative study of ten countries by Barbieri et al. (Citation2021) found that usage of all transport modes reduced for all trip purposes. As the disruption caused by the pandemic eases, some of these trends are expected to continue to some extent. van Wee and Witlox (Citation2021) found that COVID-19 fostered an e-life pattern and hypothesize that this will lead to two main changes on individual mobilities; namely more diverse destinations for daily travel and lower transport demand during the peak time. Moreover, the transport system will experience a decline in number of trips but the trip duration will rise.
2.2. The role of BSS during the pandemic
The pandemic has been found to have significant impacts on the usage of BSS worldwide, which have mirrored the different stages of the pandemic. Consistent with other transport modes, usage initially fell during lockdown periods, but the subsequent recovery varied by location. For example, Chai et al. (Citation2021) found that the overall BSS usage (including Mobike, DiDi Bike, Hellobike, and Ofo) reduced by 64.8% during the early stage of the COVID-19 outbreak in Beijing, China, in January 2020. It then increased by 15.9% when restrictions eased. However, the overall usage had not recovered to pre-pandemic levels by March 2020. Hu et al. (Citation2021) observed changes in the Divvy BSS in Chicago over a longer period between January and July 2020, finding an “increase-decrease-rebound” pattern, with a decrease from January to April and recovery until July. However, a study by Li et al. (Citation2021b) on London’s BSS over a similar period from January to June 2020 found that the usage sharply declined after the UK’s first lockdown but did not recover instantly when the lockdown eased. Clearly, more research is needed over longer periods to understand how BSS usage has recovered.
While general usage statistics of BSS can reveal trends at the aggregate scale, they mask local variations at trip, spatial, and temporal scales, which may give greater insight into the nature of change. In terms of trip characteristics, longer distances or durations have been recognized as the new normal by various studies (Chai et al. Citation2021; Kraus and Koch Citation2021; Li et al. Citation2021b; Nikiforiadis, Ayfantopoulou, and Stamelou Citation2020; Teixeira and Lopes Citation2020). For example, the Divvy BSS in Chicago presents a clear pattern of longer trips (Hu et al. Citation2021), while in New York’s Citi Bike system, the average trip duration in 2020 increased from 13 min to 19 min (Teixeira and Lopes Citation2020). Pase et al. (Citation2020) found that during March 2020, short cycling trips in downtown New York become less frequent, while longer trips connecting different boroughs made up a larger share of the BSS trips.
From a temporal perspective, an increase in trips in the afternoon as well as during weekends has been observed (Chai et al. Citation2021; Huang et al. Citation2020; Li et al. Citation2021b; Mollers, Specht, and Wessel Citation2021). Li et al. (Citation2021a) found that during the first UK lockdown and subsequent easing time, the trips in the morning peak were at a lower level. Using a long term dataset, Chibwe et al. (Citation2021) studied the London BSS from 2012 to 2020, finding the daily number of trips in weekdays during COVID-19 lockdown was 21.81% lower on average than weekdays in the pre-pandemic period. A study of ten German cities by Mollers, Specht, and Wessel (Citation2021) found the pandemic increased BSS usage during midday and afternoon hours as well as during weekends, with the opposite being true in morning peak hours and weekdays. The usage of BSS during the pandemic has also been found to vary according to landuse (Chai et al. Citation2021; Doubleday et al. Citation2021; Hu et al. Citation2021; Huang et al. Citation2020; Li et al. Citation2021b), socio-economic status (Li et al. Citation2021; Pase et al. Citation2020) and ethinicity (Bi et al. Citation2022; Hu et al. Citation2021; Teixeira, Silva, and Moura e Sá Citation2022).
It is important to note that the analyses presented here were conducted using data from the first full year of the pandemic in 2020. Therefore, while they present a good account of the initial impacts of covid on BSS from various perspectives, they do not explore whether changes have taken place that persist once all restrictions have been lifted. Studies where conditions appear to have returned to “normal” needed be viewed in the context of continuing global restrictions.
2.3. Trip purpose in BSS data: survey and inference
Data on trip purpose is not routinely collected at the population level for individual journeys on BSS. Therefore, research into BSS trip purpose often uses sample surveys of registered users. For example, Buck et al. (Citation2013) used an intercept survey and online member survey in an analysis of Capital Bikeshare (CaBi) in Washington DC, finding that frequent BSS users are more likely to use the system for utilitarian purposes such as commuting, while instant users tend to use the system for leisure and tourism. Ji et al. (Citation2017) used an intercept survey to study feeder mode choice of rail users in Nanjing, China, focussed on bike share, with a sample size of 709, finding that female, older, and low-income rail commuters are less likely to use public bicycle to access rail transit. While this type of study can reveal deep insights into a focussed topic, they are expensive and not easily repeatable, which renders them insufficient for examining granular spatio-temporal patterns (Li et al. Citation2021b). For this reason, many studies attempt to infer trip purpose from large, unlabeled BSS trip data.
In docked systems, BSS trip data is usually in the form of origin-destination trips with associated travel times. To infer purpose these trips are usually combined with temporal and/or spatial factors such as time of day, day of week and surrounding land use and points of interest (POIs). Bordagaray et al. (Citation2016) developed a heuristic for classifying BSS trips on the TusBic system in Santander, Spain based on 24,664 trips across 193 bikes. Five categories are obtained: 1) round trips, which are linked to leisure or fitness purposes; 2) rental time reset, whereby a user reaches the time limit for free travel and switches to a new bike; 3) bike substitution, whereby a bike is found to be defective and immediately switched; 4) perfectly symmetrical mobility trips associated with commuting, and; 5) non-perfectly symmetrical mobility trips, also associated with commuting but likely capturing situations where the user had to search multiple docking stations either to pick up or dock the bike. The approach of Bordagaray et al. (Citation2016) requires user data, which is not typically available. Furthermore, classes 1 and 2 are specific to the BSS under analysis and difficult to generalize. However, the basic structure of categories 3, 4 and 5 can be observed from trip data without user information. Zhang et al. (Citation2018) analyzed 1.9 million cycling trips, focussing on trip chains and transition activities in Zhongshan, China. The approach requires user data to identify trips made by the same user. Furthermore, trip purpose is mentioned but is not assessed quantitatively. Li et al. (Citation2020b) employed a Continuous Hidden Markov Model (HMM) and Gaussian Mixture Model (GMM) to infer trip purposes of docked BSS trips in Nanjing, China. Four trip types are inferred; metro/bus transfer activity, flexible cycling activity, home-based commute activity and work-based commute activity.
Recent studies also have examined trip purpose in dockless BSS. Dockless BSS typically offer much more granular spatial and temporal information than docked BSS. Journeys are often tracked by GPS and pick-up and drop-off locations are not determined by the position of docking stations. Therefore, they offer a richer source of information for inferring trip purpose. Li, Huang, and Axhausen (Citation2020a) utilized a Dirichlet multinomial regression topic model on a dockless bike-sharing (Mobike) dataset in Shanghai, China. They found long-distance or duration trips are made more frequently for leisure than for commuting. Moreover, there are five main trip purposes of dockless BSS (Mobike) in Shanghai, namely dining (22.53%), transport (19.58%), shopping (19.23%), work-related (15.66%), and residential-related (10.85%) (Xing, Wang, and Lu Citation2020). However, Li et al. (Citation2021a) found that the largest share of trip purposes in Shenzhen, China is work-related activities (24.19%), followed by recreation (17.69%), home-related (17.28%), dining (11.27%), and transfer activities (11.03%). Additionally, for the trip purposes in modal transfer, Xu et al. (Citation2019) unraveled the trip purposes of dockless BSS in Singapore may be more likely as the “first-mile” to mass rapid transit (MRT).
2.4. Spatio-temporal clustering of BSS
Many studies have conducted spatio-temporal analysis of bike-sharing mobility patterns. The methods of these studies can be categorized into three types: spatio-temporal visualization (e.g. Beecham, Wood, and Bowerman Citation2014; Bi et al. Citation2022; Lovelace et al. Citation2020; Yu, Liu, and Yin Citation2021), spatio-temporal regression (e.g. Corcoran et al. Citation2014; Maas et al. Citation2021; Morton et al. Citation2021), and spatio-temporal clustering (e.g. Saberi et al. Citation2018; Yang et al. Citation2019; Zheng et al. Citation2021). As this study focusses on clustering of BSS journeys, we only review papers on spatio-temporal clustering of BSS here.
There is a wide range of clustering algorithms, which can be broadly separated into five types: partitioning clustering (PC), density-based clustering (DBC), hierarchical clustering (HC), model based clustering (MBC) and grid based clustering (GBC) (Ansari et al. Citation2020). GBC is not suitable here as it is designed to be applied to grid data structures (Giannotti et al. Citation2007). Similarly, DBC methods such as DBSCAN are not suitable because they are designed to find clusters in point data, as seen in Bao et al. (Citation2017). The BSS data used here have fixed geographic location (docking stations) so the approach would be of limited value. PC, of which k-Means (KM) is the archetype, has been applied in a number of BSS studies. For example, Borgnat et al. (Citation2011) applied the KM algorithm on the dynamic cycling trip network regarding docked BSS in space and time, finding four spatio-temporal clusters related to cycling travel patterns on peak hours and ordinary hours intra-weekdays and weekends. Hyland et al. (Citation2018) utilized KM and Fuzzy C-means clustering methods, finding three BSS clusters which are mostly interpretable with commuting rhythms (membership, weekdays, peak hours) or leisure activities (non-membership, weekends). The advantage of PC methods is their simplicity and ease of implementation. However, cluster assignment depends only on the mean vector, which prohibits different variances along different dimensions.
MBC approaches, such as Gaussian Mixture Modelling (GMM), relax the restrictions of PC methods like KM to allow each cluster to have its own covariance matrix. This has two main advantages: firstly, clusters can have different variances along different axes and arbitrary orientations, and secondly, data points are assigned a probability of cluster membership. MBC has been applied to BSS in identifying usage variances among various docked stations (Etienne and Latifa Citation2014), mining the “last-mile” effects of a new metro line (Yang et al. Citation2019), and mining trip trends of bikes among BSS stations based on their geographical location information (Jia et al. Citation2019).
HC is an approach that forms a nested hierarchy of clusters. HC is useful in cases where data may naturally form into subpopulations. For example, Froehlich, Neumann, and Oliver (Citation2009) used hierarchical clustering to cluster docked BSS stations. They split the stations into three major clusters, 1) outgoing cluster, showing low availability of bicycles during the morning peak and higher availability after morning peak; 2) incoming cluster, showing an opposite situation to the outgoing cluster; 3) flat cluster, showing an even distribution in available bicycles intra-days. Similarly, Du, Deng, and Liao (Citation2019) and Liu and Lin (Citation2019) used hierarchical clustering, finding morning/evening peak hour-related station-level usage frequency clusters. However, as the data presented in this study are two dimensional, a hierarchical approach is not required.
Alongside the aforementioned clustering methods, community detection (CD) has been widely applied to BSS. CD extracts groups of nodes in a network that are strongly connected. CD has been applied in BSS analysis in New York City (Lin, He, and Peeta Citation2018), London (Saberi et al. Citation2018), Chicago (Zhou and Chen Citation2015), and Singapore (Song et al. Citation2021). While CD is very useful in detecting patterns in graph structures, it is not considered a suitable approach here as we focus only on identifying clusters of similar trip types.
3. Data and methods
The data are sourced from London’s Santander Cycles system, which is a docked BSS launched in 2010. This BSS is concentrated in central London, with limited coverage in outer boroughs. The data are obtained from Transport for London (TfL’s) website. The data fields are shown in .
Table 1. Data fields in the santander cycles dataset.
After removing the trips without start or end stations and removing duplicated trip records, we got a BSS trip dataset with specific trip information (Yang et al. Citation2022). In 2019, there were 797 docking stations and 10,207,268 trips. In 2020, during the pandemic, the system served 10,033,213 BSS trips with 798 stations. Descriptive statistics of the BSS data can be seen in .
Table 2. Descriptive statistics of filtered BSS trips.
From , it can be seen that the BSS statistics for each year are similar. One observation is that the mean duration of trips increased in 2020, before falling again in 2021.
3.1. Clustering journeys
We make the assumption that utilitarian and leisure activities can be clustered into distinct groups based on their duration and the distance between start and end docking stations, which we henceforth refer to as distance. For utilitarian trips, which are more direct, we expect duration to increase linearly with distance, with some variation around the mean to account for differences in cycling speed between different riders. Therefore, we hypothesize that the utilitarian trips can be described by a bivariate normal distribution. We further hypothesize that leisure trips can be described by a separate bivariate normal distribution with a different mean vector and covariance matrix that captures the more circuitous nature of leisure trips. However, we note that this is an idealized situation and trips may cluster in other ways that we do not account for here. Therefore, an approach is required that can identify the distributions of different journey types within the data and estimate the probability of each journey belonging to either one. According to the literature review, KM, HC and model based clustering such as EM and GMM are suitable candidates for clustering BSS trips. As the data under study is low-dimensional and we are only interested in basic trip types, a hierarchical approach is not needed. Model based approaches and KM are similar, but the latter has fewer restrictions on the shape and orientation of the resulting clusters. Therefore, we choose a model-based approach, GMM, for this study.
3.2. Gaussian mixture modelling
Gaussian Mixture Modelling (GMM) is a probabilistic clustering method that identifies Gaussian subpopulations within a dataset, each with their own set of parameters. A GMM can be defined as a weighted sum of M Gaussian densities according to EquationEquation 1(1)
(1) (Reynolds Citation2009):
where is a
-dimensional continuous-valued data vector,
are the weights and
, are component Gaussian densities. The component densities are
-variate Gaussian functions of the following form:
with mean vector and covariance matrix
. The weights
sum to 1.
The GMM is fitted using the expectation-maximization (EM) algorithm (Dempster, Laird, and Rubin Citation1977), implemented in the scikit-learn package in Python programming language (Pedregosa et al. Citation2011). The covariance type is selected as “full”, which allows each component of the mixture to have its own general covariance matrix. In effect, this means that the resulting clusters can have different mean and variance along each axis and arbitrary orientation. This choice is made in order to provide the greatest flexibility in the obtained clusters. The number of clusters is selected by minimizing the Bayesian information criterion (BIC) (Schwarz Citation1978), which is a common method for defining the number of clusters in GMMs (McLachlan and Rathnayake Citation2014; VanderPlas Citation2016; Zeng et al. Citation2016). Steele and Raftery (Citation2009) compared BIC with three other measures for cluster number selection, finding BIC to be the most effective in discovering true clusters. BIC chooses the number of components that maximizes the likelihood of the data while also penalizing models with a large number of parameters, thus preventing overfitting (Etienne and Latifa Citation2014). The calculation of BIC is shown in EquationEquation 3(3)
(3) :
where represents the maximum likelihood estimate of
,
is the number of free parameters in the mixture model with
components, and
is the number of data points. The selection process ends when the improvement in BIC from adding more components,
, becomes negligible or when the number of components becomes impractical. Finally, the optimal number of components is determined when the BIC score reaches a balance between the model’s fit and complexity.
The purpose of the GMM model is to cluster trip types into classes and to examine changes in class membership between the pre-pandemic, pandemic and recovery periods. We assume that the fundamental properties of commuting and leisure trips will be unchanged throughout the study period. That is, we assume that a commuting trip will always be characterized by directness and a leisure trip the opposite. However, we assume that the proportion of trips in each class is variable. Therefore, it is not necessary to carry out the clustering on multiple time periods. Instead, we carry out the clustering on the pre-pandemic data in 2019 to characterize the clusters then assign new trips to the cluster that they have the highest probability of belonging to, based on their distance and duration. This allows us to see how the balance of trip types has shifted during the pandemic. It is important to note that we do not claim to correctly infer the purpose of each trip, but we use the clustering result as a reference from which to measure change. This approach is supported by recent studies. For example, Li et al. (Citation2021a) discovered that the pandemic resulted in an increase in the number of docked bicycle activities but did not significantly alter their patterns. Furthermore, Song et al. (Citation2021) assumed that cycling trip clusters were consistent before, during, and after the pandemic. They employed a community detection method to cluster cycling trips and fine-tuned the k parameter, representing the number of nearest stations of each trip, using pre-pandemic cycling trips. This same parameter was then applied to cluster trips during and after the pandemic.
4. Results
In this section, we first explore the basic temporal trends in the data at the global level to give an overview of the context in Section 4.1. Following this, we present the results of the clustering analysis in Section 4.2. We then use the clustering results to illustrate the local spatio-temporal variations that are masked in these global performance indicators in Section 4.3.
4.1. Global temporal analysis
In this section we conduct an exploratory temporal analysis at the global (system) level to illustrate the dominant trends in the London BSS in 2020 and 2021, compared with 2019. To give context to the results, shows the timeline of the pandemic between March 2020 and December 2021.
Table 3. Time periods for analysis based on London’s lockdown timeline.
From , it can be seen that there was a reduction in trips in March and April 2020 during the lockdown period, then a rebound to higher than 2019 levels between May and September. From October onwards the pattern appeared to return to “normal”. However, it should be noted that this period coincided with a gradual re-imposition of restrictions. From 6th January 2021, the UK entered its third national lockdown, which caused the trips to reduce until March, when a phased reduction in restrictions began. The summer months of 2021 followed a similar pattern to 2020 until October, when the 2021 counts were markedly higher than 2019 and 2020 and remained so until December, when further restrictions were announced due to the outbreak of the Omicron variant. These differences can be clearly seen in .
Figure 1. Daily temporal trend of bike share usage from 2019 to 2021.
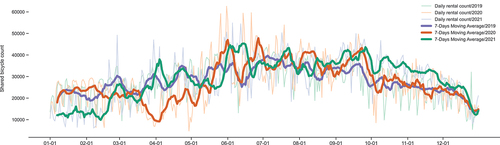
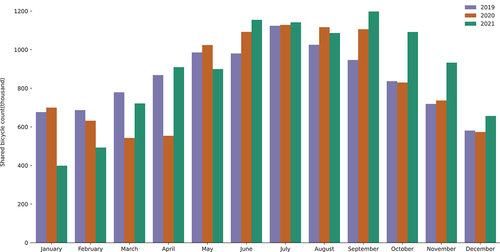
Figure 2. Monthly temporal trend of bike share usage from 2019 to 2021.
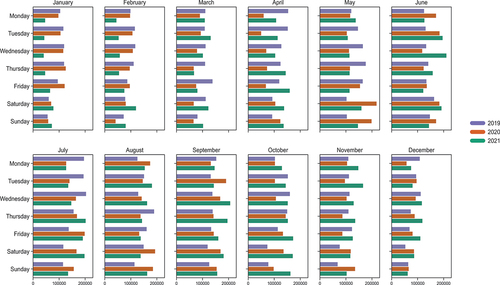
shows the breakdown of the trip counts by month and day of the week. It can be seen that January and February 2019 and 2020 (before the first lockdown) had very similar weekday patterns. The weekday counts are noticeably lower in the first national lockdown in March-April 2020 and the third lockdown in January-February 2021. From April to November in both 2020 and 2021, the trip count on Saturdays and Sundays was higher than 2019, indicating a sustained change in usage. An interesting observation is that from September 2021, the weekday counts started to match or exceed 2019 levels, which, combined with the higher weekend counts, explains the higher overall usage in 2021 to an extent.
Figure 3. The total number of bike hire trips by day of the week in each month from 2019 to 2021.
4.2. Clustering results
shows the BIC score for different values of k from 1 to 7. It can be seen that the BIC score drops sharply from 1 to 3 clusters, before leveling off. This indicates that the GMM model’s estimating performance is not significantly improved beyond a cluster size of three. Therefore, as a result of the intuitive explanation of the clusters and the creation of a stable model, we choose k = 3 as the number of clusters. shows the result of the GMM clustering procedure. The three identified clusters can be described as follows:
Figure 4. BIC score of GMM model selection.
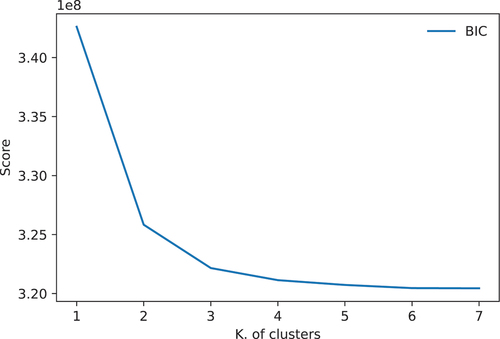
Figure 5. The scatter plot of overall 2020 trips with the pre-trained GMM model.
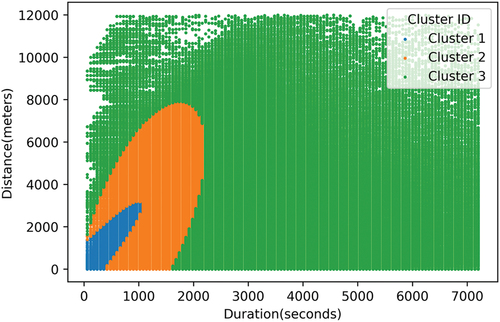
Cluster 1 (C1): This cluster represents trips of short duration and distance. On initial inspection, these may represent last mile journeys and are expected to mainly be comprised of utilitarian trips between transport hubs and work locations. They also reflect the pricing structure of Santander cycles, in which unlimited journeys of under 30 minutes may be made for £2 per day. The mean distance within this cluster is 1509.5 meters, while the mean duration is 527.2 seconds.
Cluster 2 (C2): This cluster represents trips that are longer but still direct. It can be hypothesized that this cluster contains a mix of longer utilitarian trips and leisure trips connecting leisure facilities within the city. The mean distance within this cluster is 2983.78 meters, while the mean duration is 1246.43 seconds.
Cluster 3 (C3): This cluster represents trips that have longer duration and generally shorter distance, indicating less direct trips. It can be hypothesized that these mainly represent leisure trips. The mean distance within this cluster is 2649.89 meters, while the mean duration is 3165.17 seconds.
4.3. Spatiotemporal analysis of clusters
In this section, we carry out spatial and temporal analyses of the clustering results presented in section 4.2. In doing so, we reveal deeper insights into the nature of the changes in usage of the BSS.
4.3.1. Temporal analysis
To investigate the temporal characteristics, we divide the data into five time periods: 1) Morning Peak (AMP) from 07:00 to 09:59; 2) Inter Peak (IP) from 10:00–15:59; 3) Afternoon Peak (PMP) from 16:00 to 18:59; 4) Evening period (EP) from 19:00–23:59; and 5) Overnight period (OP) from 00:00–06:59.
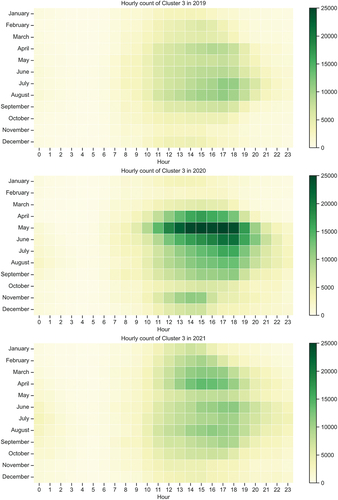
show the monthly average count of trips by hour in each cluster between 2019 and 2021. It can be clearly seen that C1 exhibits the typical two peak commuting profile in 2019, but this disappears during the first lockdown. By September 2021 the two peak profiles have returned, but with a smaller morning peak than 2019, and a longer afternoon peak. C2 also shows a two-peak profile in 2019, representing commuting trips of longer distance and duration. In the summer months of May to September, there is evidence that the afternoon peak extends from early afternoon to evening. This pattern becomes more pronounced in 2020, indicating a greater number of trips in this cluster. Given that more people were working from home during this period, it’s likely that this cluster contains a mixture of commuting and leisure trips. It is also possible that users in C2 were substituting trips that would have been taken by other transport modes such as buses or the London Underground. By late 2021, the pattern of trips in this cluster was similar to 2019. However, there is still evidence of the afternoon peak starting earlier, consistent with the pattern of C1. C3 saw the widest variation between 2019 and 2021. The temporal profile of this cluster matches the leisure trip purpose, with more trips in the summer months and in the afternoon and evening. 2020 saw a large increase in trips in this cluster from April to September, peaking in May, which was the period when lockdown restrictions eased but very few people were working in Central London. People using the BSS benefited from very low traffic levels. In 2021 the pattern returned to similar levels to 2019.
Figure 6. Total hourly trip counts in Cluster 1 per month of 2019, 2020, and 2021.
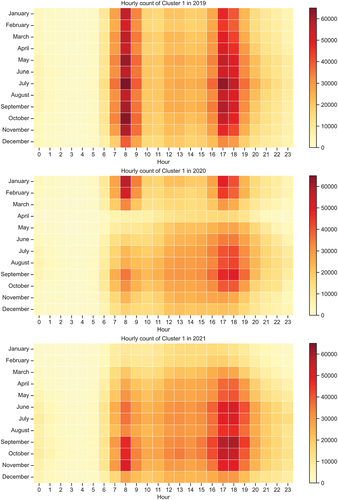
Figure 7. Total hourly trip counts in Cluster 2 per month of 2019, 2020, and 2021.
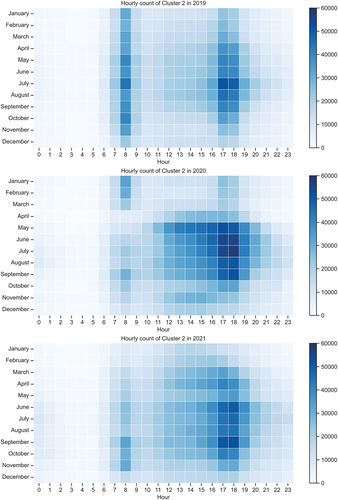
Figure 8. Total hourly trip counts in Cluster 3 per month of 2019, 2020, and 2021.
shows the percentage change in the number of trips in each cluster during each phase of the pandemic, as shown in , compared with the same period in 2019. The changes are further broken down by period of the day. Positive changes indicate an increase in trips in that cluster, and negative changes the opposite. It can be seen that C3 showed large increases in each of the lockdown periods across most time periods, further supporting the hypothesis that citizens made use of the BSS for leisure purposes while vehicle traffic was reduced and public transport was restricted. The second national lockdown was the peak for usage in this cluster.
Figure 9. Change ratios (%) in the trips of each cluster among each period compared with 2019.
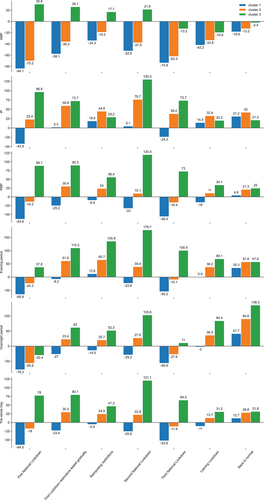
C1 showed the largest decrease in the first lockdown and did not recover in the intervening periods. The reductions were particularly sharp in the AMP, with 84.1%, 52.6% and 73.9% decreases in the first, second and third national lockdowns, respectively. By the “back to normal” period in late 2021, C1 was still 18.6% down on 2019 levels in the AMP. Conversely, C1 levels were higher than 2019 in all other periods, with the largest increases outside the traditional peaks (AMP and PMP). This could indicate that the short-term changes to commuting patterns caused by the pandemic are being sustained: fewer people are working regular office hours. C2, which represents direct trips of a longer distance and duration than C1, also saw large decreases in the AMP throughout the pandemic, which were sustained in the “back to normal” period. The greatest increases in this cluster were in the IP period in the second national lockdown and in the EP in the “back to normal” period. In fact, similar to C1 and C3, this cluster showed increases in all time periods in the “back to normal” period except the AMP. This represents a change in the way the system is used, which is masked by aggregate statistics.
4.3.2. Spatial analysis
To investigate the spatial characteristics, we separate the inflows and outflows of each station into their corresponding clusters. Because the volume of C1 and C2 is higher than C3, we extract the top 1% of flows for C1 and C2 and the top 5% for C3 to show indicative patterns.
show the top 1% of OD flows in C1 and C2 and the top 5% of flows in C3. 2019, 2020 and 2021 flows are shown in yellow, blue and red, respectively.
Figure 10. Spatial patterns of top 1% of OD flows in the Cluster 1 (a) C1-amp (b) C1-IP (c) C1-PMP.
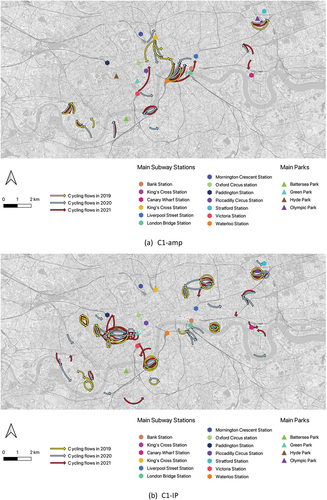
Figure 10. (Continued).
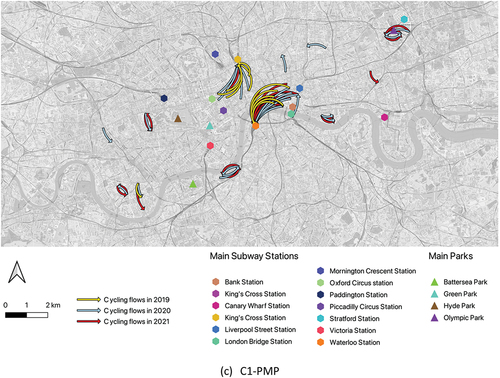
Figure 11. Spatial patterns of top 1% of OD flows in the Cluster 2 (a) C2-AMP (b) C2-IP (c) C2-PMP.
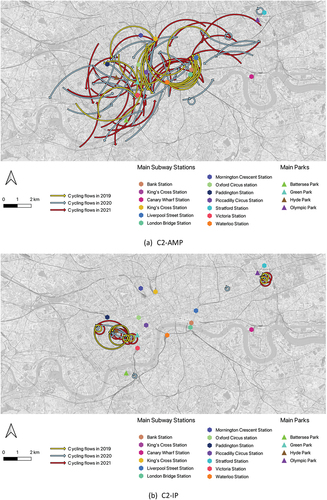
Figure 11. (Continued).
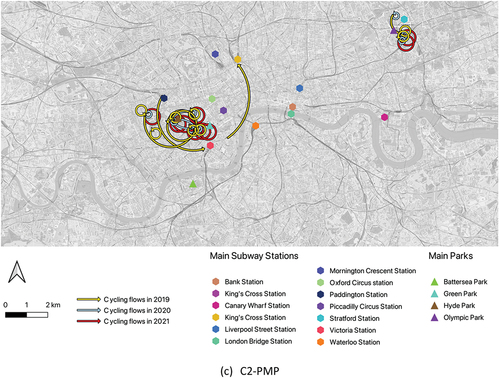
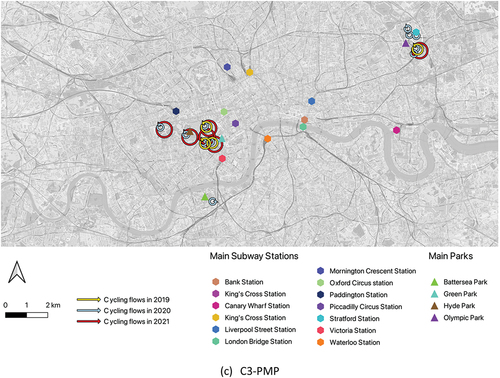
Figure 12. Spatial patterns of top 5% of OD flows in the Cluster 3 (a) C3-AMP (b) C3-IP (c) C3-PMP.
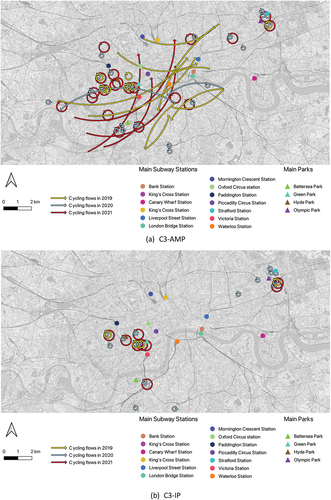
Figure 12. (Continued).
shows cluster C1, which represents trips of short duration and distance. It can be seen that in 2019 in the AMP, these comprised of trips between the main train stations of Waterloo and King’s Cross and nearby work locations in Central London and the City of London. The situation was reversed in the PMP, with commuters making the return trip to the train stations. The pattern for 2020 and 2021 is similar in this cluster, with a concentration around the same stations in the AMP and PMP. However, the flows are spatially more dispersed, with flows in the Olympic Park to the North East and Battersea and Chelsea to the West. Given that each map shows the top 1% of trips, this indicates that the flows are less dominated by the two main stations.
From , we can see that C2 mainly comprises longer, direct trips, which could have a mixed commuting and leisure purpose. In 2019 C2 AM peak these trips originated mainly at Waterloo and Kings Cross/St Pancras stations, with destinations in the City of London and Westminster, respectively. These trips most likely represent commuters completing the last portion of their journey using BSS. This spatial concentration of trips disappears from the AM peak in 2020, with the top OD pairs being distributed across the whole of Central London. In the inter-peak in 2019, 2020 and 2021, the C2 trips are centered on Hyde Park/Kensington Gardens and the Olympic Park. These trips are typically shorter distance or circular trips of longer duration, indicating leisure purpose. The PM peak shows the same pattern as the inter peak. The fact that the AM peak pattern does not reverse in 2019 suggests two things: 1) in 2019, people were more likely to perform longer last mile commuting trips in the morning than the evening; 2) the PM peak commuting patterns in this cluster are obscured by the greater number of leisure trips taking place in the PM peak compared with the AM peak. This latter point is supported by the fact that the 2020 pattern also changes between the AM and PM peaks.
shows the top 5% of OD pairs in C3 for each time period. The AM peak in 2019 was characterized by long distance trips, indicating that some commuters were traveling long distances to complete their trips. This pattern was replaced by circular trips in 2020, representing leisure trips in which users hire a bike for an extended period and return it to the same docking station. The pattern in 2021 was similar to 2019, representing a return to longer commuting trips, albeit with different origins and destinations. The IP and PMP in this cluster were characterized by circular trips concentrated in Hyde Park and the Olympic park in all three years. However, it should be noted that the absolute number of trips in this cluster varied considerably throughout the pandemic.
5. Discussion and conclusions
The COVID-19 pandemic and its ensuing countermeasures have re-shaped mobility patterns in urban areas. BSS are an important component of many urban transportations systems, facilitating green “last-mile” trips that contribute to reductions in traffic congestion and environmental pollution, while improving the health of the individuals that use them (Shamshiripour et al. Citation2020; Teixeira, Silva, and Moura e Sá Citation2021). Furthermore, during the pandemic BSS provided a way to travel in cities that did not involve taking public transportation and reduced exposure to COVID-19 (Kim Citation2021; Li et al. Citation2021a; Xin et al. Citation2022).
This study aims to explore how the pandemic has changed the way London’s BSS is used. A simple, data-driven approach was adopted to analyze the spatiotemporal patterns of the BSS usage during the pandemic 2019–21, from lockdown to recovery. The approach has enabled examination of both the short-term impacts and the sustained changes that may reflect societal adaptations to new ways of working, or a “new normal”.
The GMM model identified three clusters in the London BSS data, which we loosely associate with commuting, mixed commuting/leisure and leisure. These classes provide a reference from which to measure spatial and temporal variation and change during the various stages of the pandemic.
The results confirm the findings of similar studies on patterns of BSS usage in response to lockdown and initial recovery (Heydari et al. Citation2021; H.; Li et al. Citation2021a; Teixeira, Silva, and Moura e Sá Citation2022). There was a near 30% decline in BSS usage during the first lockdown between March and April 2020. Following this period, trip counts increased, reaching higher levels than the corresponding period in 2019 between May and September. This increase occurred despite many citizens working remotely and significant restrictions to international travel. One explanation for this could be that cycling was considered as one of the best transport modes for maintaining social distancing (De Vos Citation2020; Li et al. Citation2021a) and thus the London BSS performed an important role in transmission mitigation during the pandemic. However, the results indicate that commuting trips, particularly those in the AMP, were substituted by a greater number of leisure trips, reflected in the increase in the size of C3 and increases in the number of weekend, IP and EP trips. This hypothesis is supported by the results of the spatial analysis, which show that the AMP and PMP trips between the main train stations and work locations were replaced by a more diffuse pattern and a concentration around London’s parks. Therefore, although London’s BSS appeared to be back to normal after the first waves of the pandemic in 2020, the overall usage statistics masked significant spatial and temporal changes in usage patterns.
Examination of the results from 2021 provides further insights as London’s citizens became more accustomed to living with the virus. All restrictions on social distancing were lifted between July and December 2021, so this period can be seen as “back to normal” from the perspective of government policy. During this time, BSS usage was consistently higher than the 2019 baseline, suggesting a sustained change in usage. The clustering results indicate that “last mile” commuting activities resumed during this period. However, there was a shift in the time at which these activities took place. All three clusters showed reductions in AMP activity despite the rise in the total number of BSS trips. Conversely, all other time periods showed increases for each cluster. It can be observed that the PMP extended from the IP to the EP during the “back to normal” phase. This change likely reflects the adaptation to remote working and a greater acceptance of flexible working patterns. As van Wee and Witlox (Citation2021) anticipate, workers may have greater flexibility in when they travel post-covid and could, for example: “first work online for one or a few hours and then travel to work after the morning rush hour traffic subsided”. The likelihood of this behavior may be higher for BSS users due to the perceived risk of cycling during rush hour.
There are a number of limitations of the approach that must be acknowledged. Firstly, by using a simple data representation, the approach can easily be replicated in other BSS to carry out comparison studies. However, data on the characteristics of docking stations has not been incorporated. Using POI data in the clustering approach would allow for deeper insights into trip purpose. Secondly, the data used do not contain user information, so socio-demographic characteristics of BSS users are not considered. Should such data become available, future research could focus on the shared cycling mobilities of individuals or demographic groups. Thirdly, this study only considered the national or city-level lockdown measures and hence some local (e.g. borough-level) lockdown measures were not accounted for. Finally, while this study examines the impact of the pandemic on BSS, there is scope for further research into the role that BSSs play in the wider transport system during extreme events. As stated earlier, BSSs do not exist in isolation and often cater for the first and last mile of public transport trips. Users who are unable to fulfil those trips because of a lack of available bikes or docking places face disruption and must seek alternatives; a lack of journey time reliability can undermine trust in a transport mode. Recent research has begun to examine the resilience of BSSs when faced with sudden changes in patterns of demand. For example, Yang et al. (Citation2019) explored the impact of tube strikes on London’s BSS. Integration of multi-modal datasets is crucial in this regard.
Disclosure statement
No potential conflict of interest was reported by the author(s).
Data availability statement
The cycling data that support the findings of this study are openly available in Transport for London at https://cycling.data.tfl.gov.uk/.
Additional information
Notes on contributors
Xiaowei Gao
Xiaowei Gao is a PhD student in professor in SpaceTimeLab, Department of Civil, Environmental and Geomatic Engineering, UCL. Xiaowei is supervised by James and Huanfa. His research interests include spatial-temporal traffic risk data mining, urban computing on cycling related mobility, and bicycle share systems.
Huanfa Chen
Huanfa Chen is a lecturer in Centre for Advanced Spatial Analysis, Faculty of the Built Environment, UCL. Huanfa’ research interests lie in GIS, machine learning, and spatio-temporal optimisation to address contemporary challenges in the planning and operations of urban services, incl. police, healthcare, and transport.
James Haworth
James Haworth is an associate professor in SpaceTimeLab, Department of Civil, Environmental and Geomatic Engineering, UCL. James’ research interests lie in spatio-temporal modelling and analytics, in particular applications of machine learning, deep learning and computer vision to the geoinformation sciences.
References
- Aldred, R., and A. Goodman. 2021. “The Impact of Low Traffic Neighbourhoods on Active Travel, Car Use, and Perceptions of Local Environment during the COVID-19 Pandemic.” Findings 21390. https://doi.org/10.32866/001c.21390.
- Ansari, M. Y., A. Ahmad, S. S. Khan, G. Bhushan, and Mainuddin. 2020. “Spatiotemporal Clustering: A Review.” Artificial Intelligence Review 53 (4): 2381–2423. https://doi.org/10.1007/s10462-019-09736-1.
- Apple COVID-19 mobility report. 2021.
- Bao, J., C. Xu, P. Liu, and W. Wang. 2017. “Exploring Bikesharing Travel Patterns and Trip Purposes Using Smart Card Data and Online Point of Interests.” Networks and Spatial Economics 17 (4): 1231–1253. https://doi.org/10.1007/s11067-017-9366-x.
- Barbieri, D. M., B. Lou, M. Passavanti, C. Hui, I. Hoff, D. A. Lessa, G. Sikka, et al. 2021. “Impact of COVID-19 Pandemic on Mobility in ten Countries and Associated Perceived Risk for All Transport Modes.” PLOS ONE 16 (2): e0245886. https://doi.org/10.1371/journal.pone.0245886.
- Beecham, R., J. Wood, and A. Bowerman. 2014. “Studying Commuting Behaviours Using Collaborative Visual Analytics.” Computers, Environment and Urban Systems 47:5–15. https://doi.org/10.1016/j.compenvurbsys.2013.10.007.
- Bi, H., Z. Ye, Y. Zhang, and H. Zhu. 2022. “A Long-Term Perspective on the COVID-19: The Bike Sharing System Resilience Under the Epidemic Environment.” Journal of Transport & Health 26:101460. https://doi.org/10.1016/j.jth.2022.101460.
- Bordagaray, M., L. Dell’olio, A. Fonzone, and Á. Ibeas. 2016. “Capturing the Conditions That Introduce Systematic Variation in Bike-Sharing Travel Behavior Using Data Mining Techniques.” Transportation Research Part C: Emerging Technologies 71:231–248. https://doi.org/10.1016/j.trc.2016.07.009.
- Borgnat, P., P. Abry, P. Flandrin, C. Robardet, J.-B. Rouquier, and E. Fleury. 2011. “Shared Bicycles in a City: A Signal Processing and Data Analysis Perspective.” Advances in Complex Systems 14 (03): 415–438. https://doi.org/10.1142/S0219525911002950.
- Buck, D., R. Buehler, P. Happ, B. Rawls, P. Chung, and N. Borecki. 2013. “Are Bikeshare Users Different from Regular Cyclists?: A First Look at Short-Term Users, Annual Members, and Area Cyclists in the Washington, D.C., Region.” Transportation Research Record: Journal of the Transportation Research Board 2387 (1): 112–119. https://doi.org/10.3141/2387-13.
- Bucsky, P. 2020. “Modal Share Changes Due to COVID-19: The Case of Budapest.” Transportation Research Interdisciplinary Perspectives 8:100141. https://doi.org/10.1016/j.trip.2020.100141.
- Chai, X., X. Guo, J. Xiao, and J. Jiang. 2021. “Analysis of Spatiotemporal Mobility of Shared-Bike Usage During COVID-19 Pandemic in Beijing.” Transactions in GIS 25 (6): 2866–2887. https://doi.org/10.1111/tgis.12784. ArXiv200412340 Phys.
- Chang, H.-H., B. Lee, F.-A. Yang, and Y.-Y. Liou. 2021. “Does COVID-19 Affect Metro Use in Taipei?” Journal of Transport Geography 91:102954. https://doi.org/10.1016/j.jtrangeo.2021.102954.
- Chibwe, J., S. Heydari, A. Faghih Imani, and A. Scurtu. 2021. “An Exploratory Analysis of the Trend in the Demand for the London Bike-Sharing System: From London Olympics to COVID-19 Pandemic.” Sustainable Cities and Society 69:102871. https://doi.org/10.1016/j.scs.2021.102871.
- Corcoran, J., T. Li, D. Rohde, E. Charles-Edwards, and D. Mateo-Babiano. 2014. “Spatio-Temporal Patterns of a Public Bicycle Sharing Program: The Effect of Weather and Calendar Events.” Journal of Transport Geography 41:292–305. https://doi.org/10.1016/j.jtrangeo.2014.09.003.
- De Vos, J. 2020. “The Effect of COVID-19 and Subsequent Social Distancing on Travel Behavior.” Transportation Research Interdisciplinary Perspectives 5:100121. https://doi.org/10.1016/j.trip.2020.100121.
- Degli Esposti, P., A. Mortara, and G. Roberti. 2021. “Sharing and Sustainable Consumption in the Era of COVID-19.” Sustainability 13 (4): 1903. https://doi.org/10.3390/su13041903.
- Dempster, A. P., N. M. Laird, and D. B. Rubin. 1977. “Maximum Likelihood from Incomplete Data via the EM Algorithm.” Journal of the Royal Statistical Society: Series B (Methodological) 39 (1): 1–22. https://doi.org/10.1111/j.2517-6161.1977.tb01600.x.
- Doubleday, A., Y. Choe, T. Busch Isaksen, S. Miles, N. A. Errett, and J. P. Stimpson. 2021. “How Did Outdoor Biking and Walking Change During COVID-19?: A Case Study of Three U.S. Cities.” PLOS ONE 16 (1): e0245514. https://doi.org/10.1371/journal.pone.0245514.
- Du, Y., F. Deng, and F. Liao. 2019. “A Model Framework for Discovering the Spatio-Temporal Usage Patterns of Public Free-Floating Bike-Sharing System.” Transportation Research Part C: Emerging Technologies 103:39–55. https://doi.org/10.1016/j.trc.2019.04.006.
- Elarde, J., J.-S. Kim, H. Kavak, A. Züfle, T. Anderson, and I. Benenson. 2021. “Change of Human Mobility During COVID-19: A United States Case Study.” PLOS ONE 16 (11): e0259031. https://doi.org/10.1371/journal.pone.0259031.
- Etienne, C., and O. Latifa. 2014. “Model-Based Count Series Clustering for Bike Sharing System Usage Mining: A Case Study with the Vélib’ System of Paris.” ACM Transactions on Intelligent Systems and Technology 5 (3): 1–21. https://doi.org/10.1145/2560188.
- Fishman, E. 2016. “Bikeshare: A Review of Recent Literature.” Transport Reviews 36 (1): 92–113. https://doi.org/10.1080/01441647.2015.1033036.
- Froehlich, J., J. Neumann, and N. Oliver. 2009. “Sensing and Predicting the Pulse of the City Through Shared Bicycling.” Proceedings of 21st International Joint Conference on Artifical Intelligence, 7, Pasadena, California, USA
- Giannotti, F., M. Nanni, D. Pedreschi, and F. Pinelli. 2007. “Trajectory Pattern Mining.” KDD 07 Proceedings of the 13th ACM SIGKDD International Conference on Knowledge Discovery and Data Mining 10. https://doi.org/10.1145/1281192.1281230.
- Heydari, S., G. Konstantinoudis, A. W. Behsoodi, and Y. Adulyasak. 2021. “Effect of the COVID-19 Pandemic on Bike-Sharing Demand and Hire Time: Evidence from Santander Cycles in London.” PLOS ONE 16 (12): e0260969. https://doi.org/10.1371/journal.pone.0260969.
- Hu, S., C. Xiong, Z. Liu, and L. Zhang. 2021. “Examining Spatiotemporal Changing Patterns of Bike-Sharing Usage During COVID-19 Pandemic.” Journal of Transport Geography 91:102997. https://doi.org/10.1016/j.jtrangeo.2021.102997.
- Huang, J., H. Wang, M. Fan, A. Zhuo, Y. Sun, and Y. Li. 2020. “Understanding the Impact of the COVID-19 Pandemic on Transportation-Related Behaviors with Human Mobility Data.” In Proceedings of the 26th ACM SIGKDD International Conference on Knowledge Discovery & Data Mining. Association for Computing Machinery, New York, NY, USA, 3443–3450.
- Hyland, M., Z. Hong, H. K. R. de Farias Pinto, and Y. Chen. 2018. “Hybrid Cluster-Regression Approach to Model Bikeshare Station Usage.” Transportation Research Part A: Policy & Practice 115:71–89. Smart urban mobility. https://doi.org/10.1016/j.tra.2017.11.009.
- Jain, T., G. Currie, and L. Aston. 2022. “COVID and Working from Home: Long-Term Impacts and Psycho-Social Determinants.” Transportation Research Part A: Policy & Practice 156:52–68. https://doi.org/10.1016/j.tra.2021.12.007.
- Ji, Y., Y. Fan, A. Ermagun, X. Cao, W. Wang, and K. Das. 2017. “Public Bicycle as a Feeder Mode to Rail Transit in China: The Role of Gender, Age, Income, Trip Purpose, and Bicycle Theft Experience.” International Journal of Sustainable Transportation 11 (4): 308–317. https://doi.org/10.1080/15568318.2016.1253802.
- Jia, W., Y. Tan, L. Liu, J. Li, H. Zhang, and K. Zhao. 2019. “Hierarchical Prediction Based on Two-Level Gaussian Mixture Model Clustering for Bike-Sharing System.” Knowledge-Based Systems 178:84–97. https://doi.org/10.1016/j.knosys.2019.04.020.
- Katrakazas, C., E. Michelaraki, M. Sekadakis, and G. Yannis. 2020. “A Descriptive Analysis of the Effect of the COVID-19 Pandemic on Driving Behavior and Road Safety.” Transportation Research Interdisciplinary Perspectives 7:100186. https://doi.org/10.1016/j.trip.2020.100186.
- Kim, K. 2021. “Impact of COVID-19 on Usage Patterns of a Bike-Sharing System: Case Study of Seoul.” Journal of Transportation Engineering, Part A: Systems 147 (10): 05021006. https://doi.org/10.1061/JTEPBS.0000591.
- Kraus, S., and N. Koch. 2021. “Provisional COVID-19 Infrastructure Induces Large, Rapid Increases in Cycling.” Proceedings of the National Academy of Sciences 118 (15): 118. https://doi.org/10.1073/pnas.2024399118.
- Lathia, N., S. Ahmed, and L. Capra. 2012. “Measuring the Impact of Opening the London Shared Bicycle Scheme to Casual Users.” Transportation Research, Part C: Emerging Technologies 22:88–102. https://doi.org/10.1016/j.trc.2011.12.004.
- Laverty, A., R. Aldred, and A. Goodman. 2020. The Impact of Introducing Low Traffic Neighbourhoods on Road Traffic Injuries. Findings January. https://doi.org/10.32866/001c.18330.
- Li, A., Y. Huang, and K. W. Axhausen. 2020a. “An Approach to Imputing Destination Activities for Inclusion in Measures of Bicycle Accessibility.” Journal of Transport Geography 82:102566. https://doi.org/10.1016/j.jtrangeo.2019.102566.
- Li, A., P. Zhao, H. Haitao, A. Mansourian, and K. W. Axhausen. 2021a. “How Did Micro-Mobility Change in Response to COVID-19 Pandemic? A Case Study Based on Spatial-Temporal-Semantic Analytics.” Computers, Environment and Urban Systems 90:101703. https://doi.org/10.1016/j.compenvurbsys.2021.101703.
- Li, H., Y. Zhang, M. Zhu, and G. Ren. 2021b. “Impacts of COVID-19 on the Usage of Public Bicycle Share in London.” Transportation Research Part A: Policy & Practice 150:140–155. https://doi.org/10.1016/j.tra.2021.06.010.
- Li, S., C. Zhuang, Z. Tan, F. Gao, Z. Lai, and Z. Wu. 2021. “Inferring the Trip Purposes and Uncovering Spatio-Temporal Activity Patterns from Dockless Shared Bike Dataset in Shenzhen, China.” Journal of Transport Geography 91:102974. https://doi.org/10.1016/j.jtrangeo.2021.102974.
- Li, W., Y. Ji, X. Cao, and X. Qi. 2020b. “Trip Purpose Identification of Docked Bike-Sharing from IC Card Data Using a Continuous Hidden Markov Model.” IEEE Access 8:189598–189613. https://doi.org/10.1109/ACCESS.2020.3026685.
- Lin, L., Z. He, and S. Peeta. 2018. “Predicting Station-Level Hourly Demand in a Large-Scale Bike-Sharing Network: A Graph Convolutional Neural Network Approach.” Transportation Research Part C: Emerging Technologies 97:258–276. https://doi.org/10.1016/j.trc.2018.10.011.
- Liu, H.-C., and J.-J. Lin. 2019. “Associations of Built Environments with Spatiotemporal Patterns of Public Bicycle Use.” Journal of Transport Geography 74:299–312. https://doi.org/10.1016/j.jtrangeo.2018.12.010.
- Lovelace, R., R. Beecham, E. Heinen, E. Vidal Tortosa, Y. Yang, C. Slade, and A. Roberts. 2020. “Is the London Cycle Hire Scheme Becoming More Inclusive? An Evaluation of the Shifting Spatial Distribution of Uptake Based on 70 Million Trips.” Transportation Research Part A: Policy & Practice 140:1–15. https://doi.org/10.1016/j.tra.2020.07.017.
- Maas, S., P. Nikolaou, M. Attard, and L. Dimitriou. 2021. “Spatial and Temporal Analysis of Shared Bicycle Use in Limassol, Cyprus.” Journal of Transport Geography 93:103049. https://doi.org/10.1016/j.jtrangeo.2021.103049.
- McLachlan, G. J., and S. Rathnayake. 2014. “On the Number of Components in a Gaussian Mixture Model: Number of Components in a Gaussian Mixture Model.” Wiley Interdisciplinary Reviews Data Mining and Knowledge Discovery 4 (5): 341–355. https://doi.org/10.1002/widm.1135.
- Mollers, A., S. Specht, and J. Wessel. 2021. “The Impact of the COVID-19 Pandemic and Government Intervention on Active Mobility (No. Working Paper NO.34).” Münster, Germany: University of Münster, Institute for Transport Economics.
- Morton, C., S. Kelley, F. Monsuur, and T. Hui. 2021. “A Spatial Analysis of Demand Patterns on a Bicycle Sharing Scheme: Evidence from London.” Journal of Transport Geography 94:103125. https://doi.org/10.1016/j.jtrangeo.2021.103125.
- Nikiforiadis, A., G. Ayfantopoulou, and A. Stamelou. 2020. “Assessing the Impact of COVID-19 on Bike-Sharing Usage: The Case of Thessaloniki, Greece.” Sustainability 12 (19): 8215. https://doi.org/10.3390/su12198215.
- Nouvellet, P., S. Bhatia, A. Cori, K. E. C. Ainslie, M. Baguelin, S. Bhatt, A. Boonyasiri, et al. 2021. “Reduction in Mobility and COVID-19 Transmission.” Nature Communications 12 (1): 1090. https://doi.org/10.1038/s41467-021-21358-2.
- Pase, F., F. Chiariotti, A. Zanella, and M. Zorzi. 2020. “Bike Sharing and Urban Mobility in a Post-Pandemic World.” IEEE Access 8:187291–187306. https://doi.org/10.1109/ACCESS.2020.3030841.
- Pedregosa, F., G. Varoquaux, A. Gramfort, V. Michel, B. Thirion, O. Grisel, M. Blondel, et al. 2011. “Scikit-Learn: Machine Learning in Python.” Journal of Machine Learning Research 12:2825–2830.
- Reynolds, D. 2009. “Gaussian Mixture Models.” In Encyclopedia of Biometrics, edited by S. Z. Li and A. Jain, 659–663. Boston: Springer US. https://doi.org/10.1007/978-0-387-73003-5_196.
- Saberi, M., M. Ghamami, Y. Gu, M. H. Shojaei (Sam), and E. Fishman. 2018. “Understanding the Impacts of a Public Transit Disruption on Bicycle Sharing Mobility Patterns: A Case of Tube Strike in London.” Journal of Transport Geography 66:154–166. https://doi.org/10.1016/j.jtrangeo.2017.11.018.
- Schwarz, G. 1978. “Estimating the Dimension of a Model. Ann.” Annals of Statistics 6 (2). https://doi.org/10.1214/aos/1176344136.
- Shamshiripour, A., E. Rahimi, R. Shabanpour, and A. Mohammadian (Kouros). 2020. “How is COVID-19 Reshaping Activity-Travel Behavior? Evidence from a Comprehensive Survey in Chicago.” Transportation Research Interdisciplinary Perspectives 7:100216. https://doi.org/10.1016/j.trip.2020.100216.
- Shepherd, H. E. R., F. S. Atherden, H. M. T. Chan, A. Loveridge, and A. J. Tatem. 2021. “Domestic and International Mobility Trends in the United Kingdom During the COVID-19 Pandemic: An Analysis of Facebook Data.” International Journal of Health Geographics 20 (1): 46. https://doi.org/10.1186/s12942-021-00299-5.
- Song, J., L. Zhang, Z. Qin, and M. A. Ramli. 2021. “A Spatiotemporal Dynamic Analyses Approach for Dockless Bike-Share System.” Computers, Environment and Urban Systems 85:101566. https://doi.org/10.1016/j.compenvurbsys.2020.101566.
- Steele, R. J., and A. E. Raftery. 2009. Performance of Bayesian Model Selection Criteria for Gaussian Mixture Models (Technical Report No. 559). Department of Statistics, University of Washington.
- Teixeira, J. F., and M. Lopes. 2020. “The Link Between Bike Sharing and Subway Use During the COVID-19 Pandemic: The Case-Study of New York’s Citi Bike.” Transportation Research Interdisciplinary Perspectives 6:100166. https://doi.org/10.1016/j.trip.2020.100166.
- Teixeira, J. F., C. Silva, and F. Moura e Sá. 2021. “The Motivations for Using Bike Sharing During the COVID-19 Pandemic: Insights from Lisbon.” Transportation Research Part F, Traffic Psychology and Behaviour 82:378–399. https://doi.org/10.1016/j.trf.2021.09.016.
- Teixeira, J. F., C. Silva, and F. Moura e Sá. 2022. “The Strengths and Weaknesses of Bike Sharing as an Alternative Mode During Disruptive Public Health Crisis: A Qualitative Analysis on the users’ Motivations During COVID-19.” Transport Policy 129:24–37. https://doi.org/10.1016/j.tranpol.2022.09.026.
- Tirachini, A., and O. Cats. 2020. “COVID-19 and Public Transportation: Current Assessment, Prospects, and Research Needs.” Journal of Public Transportation 22 (1): 22. https://doi.org/10.5038/2375-0901.22.1.1.
- Transport for London. 2021. “Santander Cycles Welcomes Record New Users During Its Tenth Anniversary Year [WWW Document].” Transport for London. Accessed March 3, 2022. https://tfl.gov.uk/info-for/media/press-releases/2021/january/santander-cycles-welcomes-record-new-users-during-its-tenth-anniversary-year.
- VanderPlas, J. 2016. “In Depth: Gaussian Mixture Models.” In Python Data Science Handbook.
- van Wee, B., and F. Witlox. 2021. “COVID-19 and Its Long-Term Effects on Activity Participation and Travel Behaviour: A Multiperspective View.” Journal of Transport Geography 95:103144. https://doi.org/10.1016/j.jtrangeo.2021.103144.
- Wang, D., F. Zuo, J. Gao, Y. He, Z. Bian, S. D. Bernardes, C. Na, et al. 2020. “Agent-Based Simulation Model and Deep Learning Techniques to Evaluate and Predict Transportation Trends Around COVID-19.” ArXiv201009648 Phys.
- Wilbur, M., A. Ayman, A. Ouyang, V. Poon, R. Kabir, A. Vadali, P. Pugliese, D. Freudberg, A. Laszka, and A. Dubey. 2020. “Impact of COVID-19 on Public Transit Accessibility and Ridership.” ArXiv200802413 Phys.
- Woodcock, J., M. Tainio, J. Cheshire, O. O’Brien, and A. Goodman. 2014. “Health Effects of the London Bicycle Sharing System: Health Impact Modelling Study.” BMJ 348 (feb13 1): g425. https://doi.org/10.1136/bmj.g425.
- Xin, R., T. Ai, L. Ding, R. Zhu, and L. Meng. 2022. “Impact of the COVID-19 Pandemic on Urban Human Mobility - A Multiscale Geospatial Network Analysis Using New York Bike-Sharing Data.” Cities 126:103677. https://doi.org/10.1016/j.cities.2022.103677.
- Xing, Y., K. Wang, and J. J. Lu. 2020. “Exploring Travel Patterns and Trip Purposes of Dockless Bike-Sharing by Analyzing Massive Bike-Sharing Data in Shanghai, China.” Journal of Transport Geography 87:102787. https://doi.org/10.1016/j.jtrangeo.2020.102787.
- Xu, Y., D. Chen, X. Zhang, W. Tu, Y. Chen, Y. Shen, and C. Ratti. 2019. “Unravel the Landscape and Pulses of Cycling Activities from a Dockless Bike-Sharing System.” Computers, Environment and Urban Systems 75:184–203. https://doi.org/10.1016/j.compenvurbsys.2019.02.002.
- Yang, Y., R. Beecham, A. Heppenstall, A. Turner, and A. Comber. 2022. “Understanding the Impacts of Public Transit Disruptions on Bikeshare Schemes and Cycling Behaviours Using Spatiotemporal and Graph-Based Analysis: A Case Study of Four London Tube Strikes.” Journal of Transport Geography 98:103255. https://doi.org/10.1016/j.jtrangeo.2021.103255.
- Yang, Y., A. Heppenstall, A. Turner, and A. Comber. 2019. “A Spatiotemporal and Graph-Based Analysis of Dockless Bike Sharing Patterns to Understand Urban Flows Over the Last Mile.” Computers, Environment and Urban Systems 77:101361. https://doi.org/10.1016/j.compenvurbsys.2019.101361.
- Yu, S., G. Liu, and C. Yin. 2021. “Understanding Spatial-Temporal Travel Demand of Free-Floating Bike Sharing Connecting with Metro Stations.” Sustainable Cities and Society 74:103162. https://doi.org/10.1016/j.scs.2021.103162.
- Zeng, S., R. Huang, H. Wang, and Z. Kang. 2016. “Image Retrieval Using Spatiograms of Colors Quantized by Gaussian Mixture Models.” Neurocomputing 171:673–684. https://doi.org/10.1016/j.neucom.2015.07.008.
- Zhang, Y., M. J. G. Brussel, T. Thomas, and M. F. A. M. van Maarseveen. 2018. “Mining Bike-Sharing Travel Behavior Data: An Investigation into Trip Chains and Transition Activities.” Computers, Environment and Urban Systems 69:39–50. https://doi.org/10.1016/j.compenvurbsys.2017.12.004.
- Zheng, Z., Y. Chen, D. Zhu, H. Sun, J. Wu, X. Pan, and D. Li. 2021. “Extreme Unbalanced Mobility Network in Bike Sharing System.” Physica a Statistical Mechanics & Its Applications 563:125444. https://doi.org/10.1016/j.physa.2020.125444.
- Zhou, X., and Y. Chen. 2015. “Understanding Spatiotemporal Patterns of Biking Behavior by Analyzing Massive Bike Sharing Data in Chicago.” PLOS ONE 10 (10): e0137922. https://doi.org/10.1371/journal.pone.0137922.