
ABSTRACT
Mobility restriction measures were the main tools to control the spread of COVID-19, but the extent to which the mobility has decreased remained unsure. We investigated the change in local population mobility and its correlation with COVID-19 infections, using 1185 billion aggregated mobile phone data records in nine main cities in China from 10 January to 24 February 2020. The mobility fell by as much as 79.57% compared to the normal days in 2020 and by 58.13% compared to the same lunar period in 2019. The daily incidence of COVID-19 was significantly correlated with local daily mobility (R2 = 0.77, P < 0.001). The instantaneous reproduction number R(t) declined by 3% when mobility was reduced by 10% in the GLM analysis (P < 0.05). Our study indicated that the decreased mobility level, driven by a mixture effect of holiday and public health interventions, could substantially reduce the transmission of COVID-19 to a low level. Our study could provide evidence of mobility restriction to control local transmission for other places facing COVID-19 outbreaks or potential next waves.
1. Introduction
Mobility restriction measures are preliminary tools to control the spread of COVID-19 in the absence of vaccine and effective treatments, especially when there was a large fraction of asymptomatic infections (Li et al. Citation2020) and around 60% of undetected cases (Pullano et al. Citation2020). Many countries have implemented mobility restriction measures, and some have been successful at reducing the number of COVID-19 cases (Hartley and Perencevich Citation2020; Kraemer et al. Citation2020; Lemaitre et al. Citation2020). These mobility restriction measures include social distancing, community containment measures for reducing public transport and public gathering, work at home, school closures, and telecommuting where possible, etc. (Fong et al. Citation2020). However, so far, the extent to which these public health measures have resulted in local population mobility reduction has not been quantified, so the appropriate proportional response of mobility reduction for controlling the community transmission of COVID-19 is unsure.
Tracing population movement is of great importance in the context of COVID-19 outbreak to modify the public health measures and predict the spread of COVID-19. Several public datasets provided mobility data for human beings during the pandemic including safegraphy, Google moblility, Apple mobility, Baidu, Qianxi, etc. (Safegraphy, www.safegraph.com/; Google mobility, www.google.com/covid19/mobility/; Apple mobility, https://covid19.apple.com/mobility/; Baidu Qianxi, https://qianxi.baidu.com/; Zhang et al. Citation2020). Italy has a severe local outbreak with 210,000 reported COVID-19 cases and reported a 50% reduction in citizens’ mobility within and between provinces using anonymized location data following the nationwide lockdown (Pepe et al. Citation2020; Niu et al. Citation2021), is beginning to have a decrease in the reported new cases (Financial Times, https://www.ft.com/content/a26fbf7e-48f8-11ea-aeb3-955839e06441). The US had over 1,200,000 reported COVID-19 cases in the local outbreak and has experienced a reduction of approximately 50% in total commutes for 16 Combined Statistical Areas (Klein et al. Citation2020). China has controlled the local outbreak within 1 month with a total reported COVID-19 cases of around 80,000 by strict mobility restriction measures after the travel ban of Wuhan city. The travel restriction from Wuhan was sufficient to stop population flow from Wuhan and helped to control the spread of COVID-19 to the other cities in China (Chinazzi et al. Citation2020). Some studies estimated the higher or lower than expected infections in other cities in China based on the population flow from Wuhan, which indicated the effect of local public health measures on the community transmission (Jia et al. Citation2020; Pei, Kandula, and Shaman Citation2020). The declining ratio of mobility averaged 58% for all cities with more than 50 cases and the maximum mobility reduction (81%) occurred in Wuhan when the Level 1 response was launched (Xi et al. Citation2020). Therefore, mobility reduction may vary in different regions of China during the pandemic. The impact of mobility reduction on COVID-19 transmission was proven in 73% of the 52 countries (Nouvellet et al. Citation2021). In addition, pre-pandemic studies provided evidence about the high degree of heterogeneity for mobility exists within age groups (Masso, Silm, and Ahas Citation2019; Paez et al. Citation2021) and gender groups (Citation2021Silm, Ahas, and Nuga Citation2013; Chakrabarti et al. Citation2021). The regional demographic density could explain the spatial infection rate in South India (Arif et al. Citation2021) and mortality rate differences in the Global South (Mansour et al. Citation2021). Therefore, it is necessary to monitor local human mobility by demographic groups and explore the association between the mobility level and local outbreak of COVID-19 in Guangdong-Hong Kong-Macao Greater Bay Area of China (GBA), which is one of the regions with the most active mobility and the strongest economic vitality in China.
In this study, we used 1185 billion aggregated mobile phone position data records to describe the extent to which mobility patterns have changed under the health threat of COVID-19 in nine cities in GBA. Major novelties and contributions include 1) exploring the time-lags-correlation between mobility and transmission of COVID-19 (daily incidence of COVID-19 and the instantaneous reproduction number R(t)) in the first wave of COVID-19 pandemic in GBA and 2) quantifying how human mobility changes in space (different regions), time (different pandemic stages), purpose (work, shopping, etc.) and demographic groups (gender, age, etc.) in responding GBA COVID-19 controls. It is the first time to describe the situation of human mobility before the pandemic and the during the pandemic, which could improve the understanding of mobility structure of human in GBA area and provide the base for further research of human mobility in the area. Our study could provide the detailed change of mobility reduction in the GBA area and the effect of mobility reduction on the COVID-19 transmission, which could be applied for reference in the similar areas of other countries which are facing the challenge and also for preparedness for the potential waves.
2. Method
2.1. Study area and data
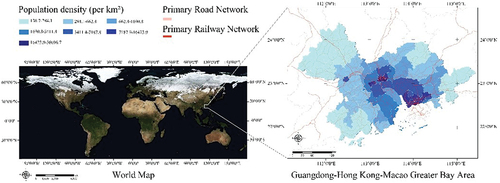
The GBA area is a world-class megacity region with a total area of 56,000 km2, a total population of 70 million and 10.8% of the total national GDP. The road traffic facilities in GBA are mainly the intercity road network centered on the two main axes of Guangzhou-Shenzhen-Hong Kong and Guangzhou-Zhuhai-Macao. Compared with other urban agglomerations in China, the per capita density and population of GBA are dominant, and the population is mainly concentrated in several core cities such as Shenzhen and Guangzhou (). Mobile phone data was provided by one of the three leading mobile phone service providers in Guangdong province covering approximately 20% of the total GBA population. The mobile phone usage rate among the population aged 15 to 65 is almost 100% so such mobile phone users are representative of the whole population of this age based on the prior estimates (Deloitte Citation2018; Pew Research Center Citation2017). A user only had to have their phone on (and not necessarily use it) for their locations to be noted (Yue et al. Citation2017). The frequency of signal observations for every mobile phone device is at “second level”. The location accuracy of the data is related to the density of mobile phone towers. For urban areas of GBA with high tower density, the location error can usually be controlled within hundred meters. We used the anonymized, aggregated position data between 1 January and 24 February 2020 and data from the same lunar period in 2019 for this study. We retrieved data on official estimated population sizes for 2020 from the government website (Shenzhen Statistics Department Citation2018).
Figure 1. The population density and traffic network in GBA.
2.2. Ethics
China Unicom mobile phone service provider has a protocol for users to opt-out and also provides a protocol for users to voluntarily contribute their pseudonymized trajectories to research. In this study, we only used anonymized and aggregated mobile phone data instead of individual travel or behavior patterns for the strict protection of personal privacy. The information has been aggregated in space (500 × 500-m grids) and time (30 min). From the perspective of this research, mobility information is anonymously aggregated, and only population-level mobility changes can be analyzed.
2.3. COVID-19 data and public health interventions
The sources of COVID-19 cases are mainly official reports from the government of each city. Data included the number of cases each day for each city. We obtained the key timings and details for public health interventions according to the literature and online government websites. The information included the types of interventions such as an announcement of outbreak, response level from the government, mobility restrictions, and the date of intervention implementation.
2.4. Definition of Chunyun
The Spring Festival is a 7-day holiday during the Lunar New Year in China. The Spring Festival travel season (Chunyun) is a period in China with an extremely big change of mobility before and after the Lunar New Year. During the 15 days before the Lunar New Year’s Day, people usually go back to less developed regions from developed cities such as Shenzhen and Guangzhou in GBA. The population flow direction is reversed after the Spring Festival and lasted for 40 days. Chunyun 2019 was from 21 January 2019 to 1 March 2019, while Chunyun 2020 starts from 10 January 2020 and ends on 18 February 2020.
2.5. Baidu Qianxi mobility data
Since there is no ground truth mobility dataset in GBA, we extract human mobility data from Baidu Qianxi website to improve the reliability of our analysis. Different from the mobile phone dataset, Baidu Qianxi mobility dataset is a public dataset to represent the index of travels between cities instead of the exact number of population travel (Baidu 2020). The index of travel could represent the mobility changing trend of each city. We extracted the index data for GBA cities from 23 January to 14 February 2020 after the Guangdong level 1 response. Based on this data, we could compare the mobility data from Baidu and mobile phone position data to provide a data quality measure (detailed in Section 3).
2.6. Mobile phone data processing and statistical analysis
Mobility data extracted from mobile phone are based on the coordinate signaling trajectories. Based on the signaling trajectories, stay points (defined as a moving object stays somewhere for a certain period of time) were extracted using a threshold approach (Fu et al. Citation2016; Torres, Torres-Huitzil, and Galeana-Zapién Citation2016). In our study, the spatial threshold is 500 m and the temporal threshold is 30 min. Finally, a travel is defined as the movement between two continuous stay points. The population mobility volume (abbreviated as population mobility or mobility volume) is defined as the number of total travels in a specific region. For example, the population mobility volume in GBA is the sum of all travels within GBA (travels between GBA and non-GBA regions are not included).
Based on this process, the total number of identified travels from 10 January to 18 February 2020 is 484,936,658. As for the same period in 2019 (lunar calendar), the total number of identified travels was 664,836,562. It is important to note that individual-level trajectories are strictly protected by Chinese user privacy regulations. Therefore, the aforementioned data processing is conducted on the mobile phone service provider server-side. After that, the information was aggregated in space (500 × 500-m grids) and time (30 min), and only aggregated-level data are accessed. Detailed data processing workflow is demonstrated in ppendix 1.
The travel radius is measured by calculating the Euclidean travel distance between travel origin-grid to travel destination-grid. The travel purposes were inferred by overlapping travel destination with the functional land use of travel distribution (e.g. workplace, school, recreation, etc.). For example, if a person travels to a shopping mall, this trip will be inferred as “shopping”. The limitation of current travel purposes inferring is detailed in the discussions. The socio-demographic information (gender and age group) of travels can be retrieved by linking the user ID with mobile phone ID at the mobile phone service provider side, which is also aggregated in space (500 × 500-m grids) and time (30 min) so that user
In the primary analysis, we compared the population mobility during the COVID-19 pandemic with the normal days in 2020, defined as days before Chunyun. We delineated distinctions between mobility after public health interventions during the pandemic and mobility in the same lunar period in 2019. The Pearson’s correlation coefficient between daily population mobility and the daily incidence of COVID-19 in GBA. The reported cases of COVID-19 are potentially affected by delays in both consulting and reporting and thus may lag behind the true community incidence of infection. Different day lags between the daily mobility and daily incidence were tested in the analysis. The change in population mobility pattern during the pandemic compared with the same lunar period in 2019 was measured in aspects of total volume, spatial distribution, temporal distribution, sex and age distribution, and mobility location distribution. The potential relationship between the mobility and COVID-19 transmission (measured as the instantaneous reproduction number R(t)) was investigated by the generalized linear model (GLM) with different time lags. In the GLM analysis, the dependent variable is R(t), and the independent variable is the mobility volume. The link function in this GLM analysis is identity link (Zuur et al. Citation2009). We used the Akaike information criterion (AIC) to choose the appropriate time lag between the mobility and R(t). The optimal parameter is chosen by minimizing the AIC so that the estimated information loss can be minimized. The estimation of R(t) was consistent with our previous study (Zhou et al. Citation2020). All statistical analysis was performed using R package, version 3.6.3 (R Foundation for Statistical Computing, Vienna, Austria).
3. Results
3.1. COVID-19 transmission in GBA and its time-lags- correlation to human mobility
Our analysis indicated that from 9 the population mobility volume had gradually decreased and on 27 January it fell by around 79.57% compared with normal mobility volume in 2020. At this time, the cumulative number of infections reached around 150 in GBA. Around 79.57% of mobility reduction lasted for approximately 2 weeks including the Spring Festival, extended festival and workplace closure period, and then it increased slowly after work resumption on 9 February 2020 (). The first COVID-19 case was imported from Wuhan to GBA on 19 January 2020 and at that time the mobility of local people started to decrease because of Chunyun. The reported daily incidence of COVID-19 in GBA increased during the Spring Festival, became stable in the first week after the Spring Festival, and decreased in the second week after the Spring Festival. Mobility in 2020 remained at a higher level than in 2019 until the Guangdong level 1 response began to be implemented on 23 January 2020. After that, there was a substantial drop in the population mobility compared with 2019 and a larger drop during the 2 weeks after Spring Festival.
Figure 2. Daily population mobility and daily incidence of COVID-19 in GBA, 2020.
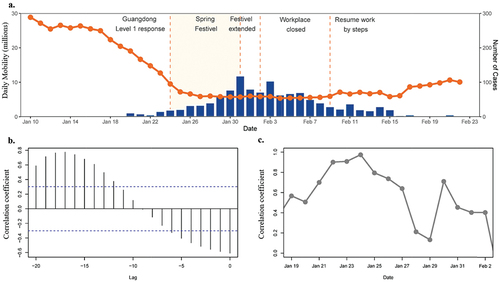
A) Daily mobility based on the mobile phone position data and daily incidence of COVID-19 from January to February in 2020; B) the correlations between daily mobility and daily incidence of COVID-19 at the different time lag (Cross-correlation); and C) the Pearson correlation between daily mobility and daily incidence of COVID-19 at the different date
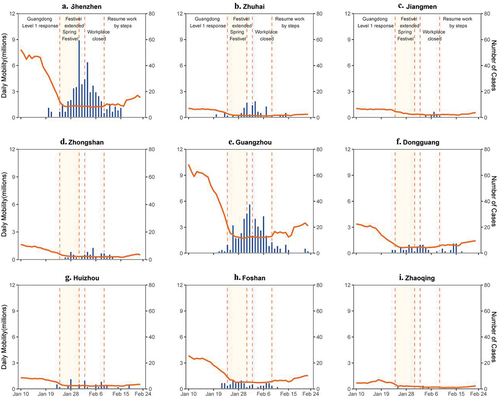
In general, population mobility interventions may impact COVID-19 transmission with time lags. To explore this time lag for the first wave COVID-19 pandemic in GBA, time lag analyses were conducted. In the cross-correlation analysis (), we calculated the correlations between local population mobility and COVID-19 daily incidence under different time-lags (from 0 to 20 days). High correlations can be detected at time-lags of 12 to 19 days. The results () also show that the local population mobility has the highest correlation with the 17-day delayed daily incidence of COVID-19 (R2 = 0.775, p < 0.001). Consistent with our hypothesis, shows that the daily number of infections is highly correlated with aggregate population mobility. The correlation increases over time from r = 0.57 on 19 January to 0.70 on 21 January, and further to 0.97 on 24 January (p < 0.001 for all). To further explore the potential relationship between mobility reduction and COVID-19 transmission reduction, we adopted the generalized linear model (GLM) because it can provide flexible generalizations of ordinary linear regression between response and predictors even though they are not normally distributed. We modeled the impact of mobility on instantaneous reproduction number R(t) in Shenzhen city, China with GLM. The result showed that the R(t) declined by 3% when mobility was reduced by 10% in the GLM model. Overall, a similar onset and magnitude of change in population mobility across all nine cities in GBA can be observed ().
Figure 3. The correlation between daily population mobility and daily incidence of COVID-19 with different time lags.
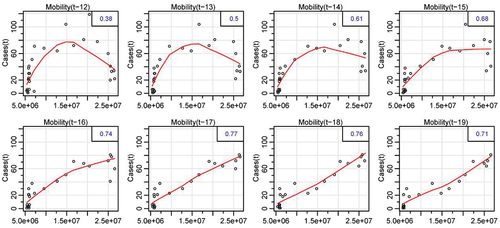
Figure 4. Mobility of 2020 and daily incidence of COVID-19 in nine cities of GBA (mobility volume of a specific city is calculated by the sum of intra-city travels, outflow travels between this city to other GBA cities, and inflow travels between other GBA cities to this city).
This significant mobility decrease was largely impacted by GBA mobility interventions. Detailed interventions in different pandemic stages are shown in .
Table 1. Major mobility interventions in different pandemic stages in GBA.
3.2. Spatiotemporal structural changes of GBA human mobility
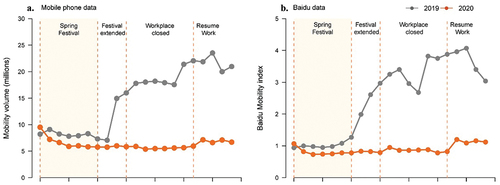
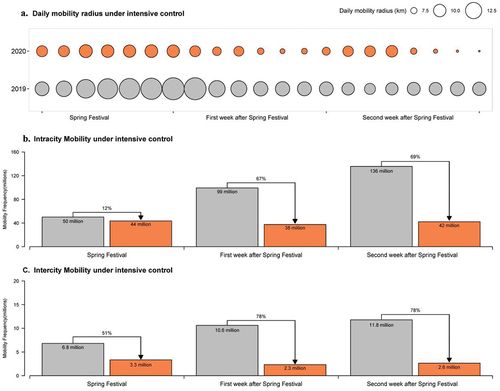
During the 3 weeks after the Guangdong level 1 response on 23 January, the average volume of population mobility was reduced by 58.13% (95% CI: 58.12%–58.13%) compared with the same lunar period of 2019. The mobility reduction in 2020 was 17.58% (95% CI: 17.57%–17.59%), 63.75% (95% CI: 63.74%–63.76%), and 69.60% (95% CI: 69.59%–69.60%) in the Spring Festival week (24–30 January), the first week after the Spring Festival week (31 January–6 February) and the second week after the Spring Festival week (7–13 February) separately (). To improve the reliability of our analysis, we also verified our mobility data with one of the most widely used open mobility data in China (Baidu Qianxi index, ) for quality measurements.
Figure 5. Daily mobility of 2020 after Guangdong level 1 response compared with 2019 in nine cities of GBA.
demonstrates the change of travel radius during the pandemic in 2020 compared with 2019. The average active radius for the 3 weeks after the Guangdong level 1 response was 8.63 km in 2020, with a mean radius reduction of 30.87% compared with 2019. The average active radius was 9.85 km and 15 km during the Spring Festival in 2020 and 2019, which was a reduction of 33.78%. In the first week after the Spring Festival, the average active radius was 8.03 km in 2020, with a reduction of 36.61% compared with 2019; while in the second week after the Spring Festival was 8.02 km, with a reduction of 21.84%. For intra-city mobility under the intensive control, it was reduced by 13.01% during the Spring Festival week and drastically decrease by 62.23% in the first week after Spring Festival, and also 68.90% in the second week after Spring Festival, while the inter-city mobility had a more obvious change by 51.07% reduction in the Spring Festival week and 77.98% and 77.60% in the second and third week after Spring Festival.
Figure 6. Mobility changes in travel radius after Guangdong level 1 response in 2020 compared with mobility in 2019.
3.3. Mobility changes in different demographic groups
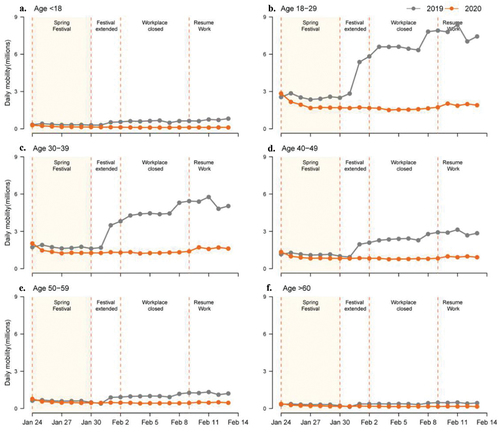
The ratio of men to women was 1014:1000 in 2018, while the mobility volume of men to women after the Spring Festival in 2019 was 2527:1000, which indicated that the mobility volume of men is substantially higher than females (). During the 2 weeks after the Spring Festival, the mean daily mobility volume for males was decreased by 65.45% (95% CI: 65.43%–65.46%) in 2020 compared with 2019, while the mean daily mobility volume for females was reduced by 69.55% (95% CI: 69.53%–69.56%). The magnitude of the decrease in mobility volume was slightly higher for females than males. The difference between age groups in the mobility change compared with 2019 is illustrated in . The age group of <18 had the biggest change proportion of 79.03% among all age groups as they were on the winter holiday during the study period. The age of 18–29 had the biggest change with 71.87%, followed by the age groups of 30–39, 40–49 with 66.15% and 60.96% separately. For the age group of 50–59 and over 60, the mobility decreased by 49.38% and 48.44%.
Figure 7. Daily population mobility changes by sex based on the mobile phone position data after Guangdong level 1 response for males in 2020 compared with the same lunar period of 2019.
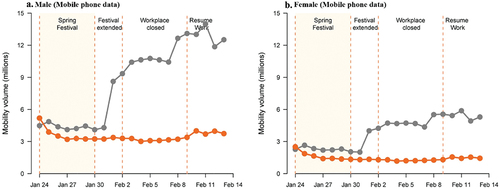
Figure 8. Change of mobility in 2020 compared with 2019 by age groups.
3.4. Mobility changes for inferred travel purposes
demonstrates the changes of different inferred travel purpose from the 19th day of Lunar December 2019. During the first wave of COVID-19 pandemic in 2020, the mobility was maintained at a substantively low level, and there was no obvious trend of increase or decrease in mobility between weekdays and weekends in Shenzhen city. Reductions in mobility were detected across all six different travel purposes, with a decrease from 75.00% to 85.00% in the workplace, school, recreation, shopping, and traffic locations. There was no obvious difference between the various travel purposes, which indicates the mobility interventions in GBA 2020 had a consistent impact on different travel purposes. We further explored the detailed spatial distributions of different travel purposes. The types of working land are mainly distributed in Nanshan, Longhua, Baoan, and Luohu districts. It is more in line with the daily commuting in Shenzhen, that is, from Longhua District and other places of residence to Nanshan District and other places of work. Entertainment and schools are mainly distributed in Futian and Nanshan districts, which are also the best developed area in Shenzhen ().
Figure 9. Mobility changes for inferred travel purposes.
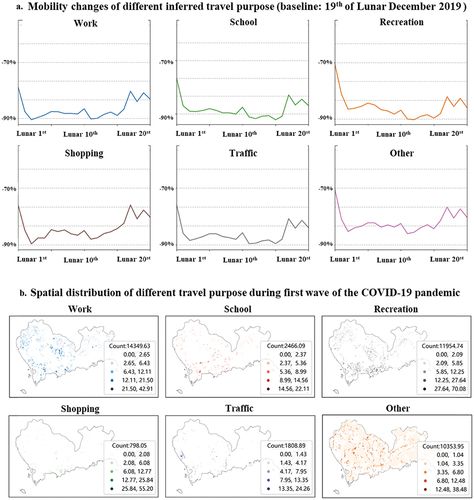
A) Mobility changes of different inferred travel purpose (baseline: 19th of Lunar December 2019; calculated by the sum of travels ending in specific land use); B) Spatial distribution of different travel purpose during first wave of the COVID-19 pandemic (count by thousands)
4. Discussion and conclusion
In this study, we used anonymized mobile phone position data to quantify the mobility reduction under the health threat of COVID-19 including the voluntary changes in behaviors and mobility restriction measures from the government. We detected around 79.57% of mobility reduction during the pandemic compared with the normal days in 2020 and around 58.13% mobility reduction compared with the same lunar period in 2019. The daily incidence of COVID-19 was significantly highly correlated with the local population mobility. The mobility reduction was significantly associated with the decrease in COVID-19 transmission. There was a substantial change in population mobility in spatiotemporal distribution, sex, and age groups. The mobility to the workplace, school, recreation, shopping areas, and traffic location sharply decreased after the Guangdong level 1 response.
We have taken an important step by tracing human mobility by using anonymized mobile phone position data, which could provide an opportunity to assess the human mobility pattern with an unprecedented level of detail (Gonzalez, Hidalgo, and A-LJn Citation2008; Wesolowski et al. Citation2015). In this pandemic of COVID-19, the aggregated level of population mobility patterns has played an important role in epidemic modeling and contact tracing (Ferretti et al. Citation2020). Various data sources including mobile apps (Shaw and Tsou Citation2016; Wu et al. Citation2014), social media (Huang and GIS Citation2016), and mobile phone call records (Song et al. Citation2010) have been applied to assess human mobility pattern and would only capture a snapshot of the subpopulation. The principle of mobile phone position data is that a user only had to have their phone on (and not necessarily use it) for their locations to be noted per hour per day. This kind of information that could provide a more precise description of human mobility, when combined with the public health data, may probably revolutionize the epidemiology (Finger et al. Citation2016).
In our study, the quick control of local transmission of COVID-19 infections in GBA to a low level (<10 cases per day) in the middle of February 2020 indicated that the reduction extent of population mobility was sufficient to change the course of the pandemic. Around 79.57% of local mobility reduction was maintained for about 2 weeks which greatly helped the decrease and finally the elimination of infections. We could be able to distinguish the extent to which the decrease is driven by the public health measures or the Spring Festival on the basis of the mobile phone position data during the same lunar period in 2019 and 2020. The 79.57% reduction of normal mobility in 2020 was possibly caused by a mixture of both the Chunyun and public health interventions, while about 58.13% reduction compared with the same lunar period of 2019 might be driven by the public health interventions for controlling the COVID-19. From the start date of Chunyun to 23 January 2020, the mobility in 2020 remained higher than that in 2019 (Baidu Qianxi data). After the Guangdong level 1 response to COVID-19, the mobility in 2020 became lower than in 2019, which indicated the substantial effect of a public health intervention on population mobility. The effect of the Spring Festival together with the public health interventions may explain the remarkably higher mobility reduction in GBA than in Italy and USA (Klein et al. Citation2020; Pepe et al. Citation2020). The first imported cases from Wuhan to GBA areas were confirmed on 19 January when Chunyun started and population mobility has already declined. Our study was consistent with the previous study indicating that early case detection and mobility reduction seem to be most effective (Lai et al. Citation2020).
Consistent with our hypothesis, the daily number of infections is highly correlated with local population mobility. We found the highest correlation between the local mobility and reported cases with a time lag of 17 days. Although there was a positive correlation between human mobility and daily incidence, we believe that daily incidence could not be affected by the change of human mobility at the same day (lag of 0). Based on the potential incubation period of 5.2 days (95% CI: 4.1–7.0 days) (Li et al. Citation2020), mainly 1–3-day delay between respiratory symptom onset and medical consultation (Zhang et al. Citation2020), and 2–10 day from hospitalization to confirmation before 14 February 2020 (Shenzhen Government Citation2020), we believe that the lag day of 17 between daily reported cases of COVID-19 and population mobility could be reasonable. Data collected from mobile phone positions which are highly correlated with COVID-19 infections could be used for epidemiological models that make projections of transmission of COVID-19 (Song Gao et al. Citation2020; Tian et al. Citation2020). The impact of mobility reduction on the R(t) was investigated in our study, which was consistent with the previous studies in other countries (Noland Citation2021; Nouvellet et al. Citation2021). Such data collected in real-time could be helpful to stem the progress of the COVID-19 transmission and monitor the public health measures (Klein et al. Citation2020). Our study could provide the evidence for the question about how to choose the extent of mobility change considering the potential positive effect on public health and the negative impact on the economy and society (Queiroz et al. Citation2020; Warren and Skillman Citation2020).
The mobility of males accounted for the major part of the local mobility compared with females, but the extent of change was quite similar for both. For age groups younger than 18 years, the frequency of children going out was reduced by 81.63% during the winter holidays probably for protection purposes by their parents under the health threat of COVID-19. For young people of 18–29 years who accounted for the majority of mobility, the reduction reached 74.10% after the Spring Festival. For age groups of 30–49, the reduction of mobility was 65.03%, while the reduction of mobility was 55.69% for older age groups over 50 years.
The spatiotemporal change in population mobility was quantified in our study. The peak times in the morning and afternoon are always associated with the daily commute and have faded after the Spring Festival because of the extended holiday until 2 February and no work resumption until 9 February. During the Spring Festival, people may like to take holiday travels, but the majority of the individuals in GBA moved most within less than 8 km of their initial position during the pandemic. The probable reason that the average mobility radius was substantially smaller in 2020 was that people may be more willing to stay at home rather than taking travel due to the health threat of COVID-19, especially during the Spring Festival. The fact that the inter-city mobility reduction was substantially higher than the intra-city mobility also indicated the people’s willingness to reduce long-distance travel during the pandemic.
There are several limitations in our study. Firstly, it is important to note that the mobile phone data used in our analysis covered about 20% of the GBA population. It is not representative of the whole population in GBA and causes sampling bias (Li et al. Citation2019). However, we think it could reflect the extent of population mobility change due to the significantly high correlation between mobility and COVID-19 cases. Secondly, we did not include the mobility of the population from the other provinces or other countries to GBA in our analysis, which may underestimate the real effects of mobility restrictions. Thirdly, current analysis of mobility changes for inferred travel purposes is still very limited because individual-level mobility data and behavioral context are not accessible. For example, we cannot distinguish between employees and customers for a mall travel. As a result, the analysis could include bias of the travel classification. Fourthly, the mobility change after the implementation of public health interventions may be underestimated in this study as the mobility volume in 2020 was higher than in 2019 before the public health interventions and may keep higher during the Spring Festival which may lead to a higher extent of mobility change. However, the possible mobility in these cities without COVID-19 in 2020 is hard to be estimated.
In our study, we have demonstrated a 79.57% of mobility reduction during the COVID-19 pandemic compared with the normal days in 2020, and around 58.13% of reduction compared with the same lunar period in 2019. Such a low level of population mobility lasting for about 2 weeks could be sufficient for controlling the local outbreak together with the case isolation. The local population mobility was highly correlated with the COVID-19 infections in GBA. Our study could provide evidence for other places to control the local spread of COVID-19 or even the potential next waves and could provide parameters for epidemiological models to predict the potential number of COVID-19.
Author contributions
Jizhe Xia extracted the data, analyzed and interpreted data, and obtained funding for the study. Ying Zhou ran the study, analyzed and interpreted data, wrote the paper, and obtained funding for the study. Zhaoyang Yu participated in the mobile phone data processing and analysis. Erzhen Chen participated in discussions. Yang Yue participated in discussions on the undertaking of the study. Zhen Li analyzed and interpreted the data. All authors reviewed the paper for content and approved the final report.
Data and codes availability statement
The codes that support the findings of this study are available at github.com with the identifier [https://github.com/UISZU/MPDAChina]. We purchased the mobile phone signaling data from 2019 to 2020 from the service provider (China Unicom). Our data purchase agreement with China Unicom prohibits us from sharing these data with third parties, but interested parties can contact China Unicom to make the same data purchase.
Acknowledgements
We thank Zhucheng Zhang, Shuting Yang, and Jia Xu for their assistance with the data collection and technical assistance.
Disclosure statement
The authors declare no conflict of interest.
Additional information
Funding
Notes on contributors
Jizhe Xia
Jiizhe Xia is currently an associate professor in the Department of Urban Spatial Information Engineering, School of Architecture and Urban Planning, Shenzhen University. He received the PhD degree from George Mason University. His research interests are spatially intelligent computing and spatiotemporal big data.
Taicheng Li
Taicheng Li is currently a master student at Shenzhen University. His research interests focus on geographic big data mining and infectious disease modeling.
Zhaoyang Yu
Zhaoyang Yu received his bachelor degree from Shenzhen University. His research interests focus on geographic big data mining.
Erzhen Chen
Erzhen Chen is currently a professor and doctoral supervisor of Ruijin Hospital Affiliated to Shanghai Jiao Tong University School of Medicine. His research interests focus on Clinical and basic research of sepsis, severe acute pancreatitis and multiple organ dysfunction syndrome.
Yang Yue
Yang Yue is currently a professor in the Department of Urban Spatial Information Engineering, School of Architecture and Urban Planning, Shenzhen University. She received the PhD degree from the University of Hong Kong. Her research interests is trajectory data analysis and mining.
Zhen Li
Zhen Li received her master degree from Shenzhen University. Her research interests focus on health system accessibility and taxi trajectories data.
Ying Zhou
Ying Zhou received the PhD degree from the University of Hong Kong. Her research interests focus on the epidemiology of respiratory infectious diseases and the epidemiology of obesity and related chronic diseases.
References
- Arif, M., M. Hasan, S. M. Alawi, and M. A. Naeem. 2021. “COVID-19 and Time-Frequency Connectedness Between Green and Conventional Financial Markets.” Global Finance Journal 49: 100650. https://doi.org/10.1016/j.gfj.2021.100650.
- Chakrabarti, S., L. C. Hamlet, J. Kaminsky, and S. V. Subramanian. 2021. “Association of Human Mobility Restrictions and Race/ethnicity–Based, Sex-Based, and Income-Based Factors with Inequities in Well-Being During the COVID-19 Pandemic in the United States.” JAMA Network Open 4 (4): e217373. https://doi.org/10.1001/jamanetworkopen.2021.7373.
- Chinazzi, M., J. T. Davis, M. Ajelli, C. Gioannini, M. Litvinova, S. Merler, A. Pastore y Piontti, et al. 2020. “The Effect of Travel Restrictions on the Spread of the 2019 Novel Coronavirus (COVID-19) Outbreak.” Science 368 (6489): 395–400. https://doi.org/10.1126/science.aba9757.
- Deloitte. 2018. “Chinese Consumers at the Forefront of Digital Technologies: China Mobile Consumer Survey 2018.” Accessed April 26, 2020. https://www2.deloitte.com/content/dam/Deloitte/cn/Documents/technology-mediatelecommunications/deloitte-cn-2018-mobile-consumer-survey-en-190121.pdf.
- Ferretti, L., C. Wymant, M. Kendall, L. Zhao, A. Nurtay, D. G. Bonsall, C. F. C. Fraser, et al. 2020. “Quantifying Dynamics of SARS-CoV-2 Transmission Suggests That Epidemic Control and Avoidance is Feasible Through Instantaneous Digital Contact Tracing.” medRxiv. https://doi.org/10.1101/2020.03.08.20032946.
- Finger, F., T. Genolet, L. Mari, G. C. de Magny, N. M. Manga, A. Rinaldo, and E. Bertuzzo. 2016. “Mobile Phone Data Highlights the Role of Mass Gatherings in the Spreading of Cholera Outbreaks.” PNAS 113 (23): 6421–6426. https://doi.org/10.1073/pnas.1522305113.
- Fong, M. W., H. Gao, J. Y. Wong, J. Xiao, E. Y. Shiu, S. Ryu, and B. J. Cowling. 2020. “Nonpharmaceutical Measures for Pandemic Influenza in Nonhealthcare Settings—Social Distancing Measures.” Emerging Infectious Diseases 26 (5): 976–984. https://doi.org/10.3201/eid2605.190995.
- Fu, Z., Z. Tian, Y. Xu, and C. Qiao. 2016. “A Two-Step Clustering Approach to Extract Locations from Individual GPS Trajectory Data.” ISPRS International Journal of Geo-Information 5 (10): 166. Pérez. https://doi.org/10.3390/ijgi5100166.
- Gonzalez, M. C., C. A. Hidalgo, and Barabasi A-L. 2008. “Understanding Individual Human Mobility Patterns.” Nature 453 (7196): 779–782. https://doi.org/10.1038/nature06958.
- Hartley, D. M., Perencevich, E. N. 2020. “Public Health Interventions for COVID-19: Emerging Evidence and Implications for an Evolving Public Health Crisis.” JAMA 323 (19): 1908. https://doi.org/10.1001/jama.2020.5910.
- Huang, Q., and D. W. S. Wong. 2016. “Activity Patterns, Socioeconomic Status and Urban Spatial Structure: What Can Social Media Data Tell Us?” International Journal of Geographical Information Science 30 (9): 1873–1898. https://doi.org/10.1080/13658816.2016.1145225.
- Jia, J. S., X. Lu, Y. Yuan, G. Xu, J. Jia, and Christakis N. A. 2020. “Population Flow Drives Spatio-Temporal Distribution of COVID-19 in China.” Nature 582 (7812): 389–394. https://doi.org/10.1038/s41586-020-2284-y.
- Klein, B., T. LaRocky, S. McCabey, L. Torresy, F. Privitera, B. Lake, et al. “Assessing Changes in Commuting and Individual Mobility in Major Metropolitan Areas in the United States During the COVID-19 Outbreak.” Accessed April 26, 2020. https://uploads-ssl.webflow.com/5c9104426f6f88ac129ef3d2/5e8374ee75221201609ab586_Assessing_mobility_changes_in_the_United_States_during_the_COVID_19_outbreak.pdf.
- Kraemer, M. U., C.-H. Yang, B. Gutierrez, C.-H. Wu, B. Klein, D. M. Pigott, L. Du Plessis, N. R. Faria, R. Li, and W. P. Hanage. 2020. “The Effect of Human Mobility and Control Measures on the COVID-19 Epidemic in China.” Science 368 (6490): 493–497. https://doi.org/10.1126/science.abb4218.
- Lai, S., N. W. Ruktanonchai, L. Zhou, O. Prosper, W. Luo, J. R. Floyd, and A. Wesolowski. 2020. “Effect of Non-Pharmaceutical Interventions for Containing the COVID-19 Outbreak: An Observational and Modelling Study.” medRxiv. https://doi.org/10.1101/2020.03.03.20029843.
- Lemaitre J. C., J. Perez-Saez, Azman A. S., A. Rinaldo, and J. Fellay. 2020. “Assessing the Impact of Non-Pharmaceutical Interventions on SARS-CoV-2 Transmission in Switzerland.” Swiss Medical Weekly 150 (2122): 100650. 49. https://doi.org/10.4414/smw.2020.20295.
- Li, M., S. Gao, F. Lu, H. J. C. Zhang, and Environment, Systems U. 2019. “Reconstruction of Human Movement Trajectories from Large-Scale Low-Frequency Mobile Phone Data.” Computers, Environment and Urban Systems 77: 101346. https://doi.org/10.1016/j.compenvurbsys.2019.101346.
- Li, Q., X. Guan, P. Wu, X. Wang, L. Zhou, Y. Tong, R. Ren, et al. 2020. “Early Transmission Dynamics in Wuhan, China, of Novel Coronavirus–Infected Pneumonia.” The New England Journal of Medicine 382 (13): 1199–1207. 10.1056/NEJMoa2001316.
- Li, R., S. Pei, B. Chen, Y. Song, T. Zhang, W. Yang, J. Shaman, et al. 2020. “Substantial Undocumented Infection Facilitates the Rapid Dissemination of Novel Coronavirus (SARS-CoV-2).” Science 368 (6490): 489–493. https://doi.org/10.1126/science.abb3221.
- Mansour, S., A. Abulibdeh, M. Alahmadi, and E. Ramadan. 2021. “Spatial Assessment of COVID-19 First-Wave Mortality Risk in the Global South.” The Professional Geographer 74 (3): 1–19. https://doi.org/10.1080/00330124.2021.2009888.
- Masso, A., S. Silm, and R. Ahas. 2019. “Generational Differences in Spatial Mobility: A Study with Mobile Phone Data.” Population, Space and Place 25 (2): e2210. https://doi.org/10.1002/psp.2210.
- Niu, B., R. Liang, S. Zhang, H. Zhang, X. Qu, Q. Su, L. Zheng, and Q. Chen. 2021. “Epidemic Analysis of COVID‐19 in Italy Based on Spatiotemporal Geographic Information and Google Trends.” Transboundary and Emerging Diseases 68 (4): 2384–2400. https://doi.org/10.1111/tbed.13902.
- Noland, R. B. 2021. “Mobility and the Effective Reproduction Rate of COVID-19.” Journal of Transport & Health 20: 101016. https://doi.org/10.1016/j.jth.2021.101016.
- Nouvellet, P., S. Bhatia, A. Cori, K. E. C. Ainslie, M. Baguelin, S. Bhatt, A. Boonyasiri, et al. 2021. “Reduction in Mobility and COVID-19 Transmission.” Nature Communications 12 (1): 1–9. https://doi.org/10.1038/s41467-021-21358-2.
- Paez, A., F. A. Lopez, T. Menezes, R. Cavalcanti, and M. G. D. R. Pitta. 2021. “A Spatio‐Temporal Analysis of the Environmental Correlates of COVID‐19 Incidence in Spain.” Geographical Analysis 53 (3): 397–421. https://doi.org/10.1111/gean.12241.
- Pei, S., S. Kandula, and J. Shaman. 2020. “Differential Effects of Intervention Timing on COVID-19 Spread in the United States.” Science Advances 6 (49): eabd6370. https://doi.org/10.1126/sciadv.abd6370.
- Pepe, E., P. Bajardi, L. Gauvin, F. Privitera, B. Lake, C. Cattuto, and M. Tizzoni. 2020. “COVID-19 Outbreak Response: A First Assessment of Mobility Changes in Italy Following National Lockdown.” medRxiv. https://doi.org/10.1101/2020.03.22.20039933.
- Pew Research Center. 2017. “China Outpaces India in Internet Access, Smartphone Ownership.” Accessed April 5, 2020. https://www.pewresearch.org/fact-tank/2017/03/16/china-outpaces-india-in-internet-access-smartphone-ownership.
- Pullano, G., F. Pinotti, E. Valdano, P.-Y. Boëlle, C. Poletto, and V. J. E. Colizza. 2020. “Novel Coronavirus (2019-nCov) Early-Stage Importation Risk to Europe, January 2020.” Eurosurveillance 25 (4): 2000057. https://doi.org/10.2807/1560-7917.ES.2020.25.4.2000057.
- Queiroz, L., A. Ferraz, J. L. Melo, G. Barboza, A. H. Urbanski, A. Nicolau, S. Oliva, and H. Nakaya. 2020. “Large-Scale Assessment of Human Mobility During COVID-19 Outbreak.” OSF Preprints. https://doi.org/10.31219/osf.io/nqxrd.
- Shaw, S.-L., and M.-H. Tsou. 2016. “Human Dynamics in the Mobile and Big Data Era.” International Journal of Geographical Information Science 30 (9): 1687–1693. Ye XJIJoGIS. https://doi.org/10.1080/13658816.2016.1164317.
- Shenzhen Government. 2020. “Data About COVID-19.” Accessed April 16, 2020. https://opendata.sz.gov.cn/data/dataSet/toDataDetails/29200_01503668.
- Shenzhen Statistics Department. “2018. Bulletin of Main Statistics from the National Census in Shenzhen.” Accessed March 3, 2020. http://tjj.sz.gov.cn/ztzl/zt/sjfb/.
- Silm, S., R. Ahas, and M. Nuga. 2013. “Gender Differences in Space—Time Mobility Patterns in a Postcommunist City: A Case Study Based on Mobile Positioning in the Suburbs of Tallinn.” Environment & Planning B: Planning & Design 40 (5): 814–828. e2210. https://doi.org/10.1068/b38068.
- Song Gao, J. R., Y. Kang, Y. Liang, J. Kruse, D. Doepfer, A. K. Sethi, J. Francisco Mandujano Reyes, J. Patz, and B. S. Yandell. 2020. “Mobile Phone Location Data Reveal the Effect and Geographic Variation of Social Distancing on the Spread of the COVID-19.” epidemic. arXiv preprint arXiv. https://arxiv.org/pdf/2004.11430.pdf.
- Song, C., Z. Qu, N. Blumm, and A.-L. Barabási. 2010. “Limits of Predictability in Human Mobility.” Science 327 (5968): 1018–1021. https://doi.org/10.1126/science.1177170.
- Tian, H., Y. Liu, Y. Li, C.-H. Wu, B. Chen, M. U. Kraemer, B. Li. 2020. “An Investigation of Transmission Control Measures During the First 50 Days of the COVID-19 Epidemic in China.” Science 368 (6491): 638–642. https://doi.org/10.1126/science.abb6105.
- Torres, R., C. Torres-Huitzil, and H. Galeana-Zapién. 2016. “Full On-Device Stay Points Detection in Smartphones for Location-Based Mobile Applications.” Sensors 16 (10): 1693. https://doi.org/10.3390/s16101693.
- Warren, M. S., and S. W. Skillman. 2020. “Mobility Changes in Response to COVID-19.” arXiv preprint arXiv. https://arxiv.org/abs/2003.14228.
- Wesolowski, A., C. J. E. Metcalf, N. Eagle, J. Kombich, B. T. Grenfell, O. N. Bjørnstad, J. Lessler, A. J. Tatem, and C. O. Buckee. 2015. “Quantifying Seasonal Population Fluxes Driving Rubella Transmission Dynamics Using Mobile Phone Data.” Proceedings of the National Academy of Sciences 112 (35): 11114–11119. https://doi.org/10.1073/pnas.1423542112.
- Wu, L., Y. Zhi, Z. Sui, Y. Liu, and V. Colizza. 2014. “Intra-Urban Human Mobility and Activity Transition: Evidence from Social Media Check-In Data.” PloS one 9 (5): e97010. https://doi.org/10.1371/journal.pone.0097010.
- Xi, W., T. Pei, Q. Liu, C. Song, Y. Liu, X. Chen, J. Ma, and Z. Zhang. 2020. “Quantifying the Time-Lag Effects of Human Mobility on the COVID-19 Transmission: A Multi-City Study in China.” IEEE Access 8:216752–216761. https://doi.org/10.1101/2020.07.13.20148668.
- Yue, Y., Y. Zhuang, A. G. Yeh, J.-Y. Xie, C.-L. Ma, and Li Q-QJIJoGIS. 2017. “Measurements of POI-Based Mixed Use and Their Relationships with Neighbourhood Vibrancy.” International Journal of Geographical Information Science 31 (4): 658–675. https://doi.org/10.1080/13658816.2016.1220561.
- Zhang, Q., S. Feng, I. O. Wong, D. K. Ip, B. J. Cowling, and L. EHJBph. 2020. “A Population-Based Study on Healthcare-Seeking Behaviour of Persons with Symptoms of Respiratory and Gastrointestinal-Related Infections in Hong Kong.” BMC Public Health 20 (1): 1–10. https://doi.org/10.1186/s12889-020-08555-2.
- Zhou, Y., R. Xu, D. Hu, Y. Yue, Q. Li, and J. Xia. 2020. “Effects of Human Mobility Restrictions on the Spread of COVID-19 in Shenzhen, China: A Modelling Study Using Mobile Phone Data.” Lancet Digital Health 2 (8): e417–e424. https://doi.org/10.1016/S2589-7500(20)30165-5.
- Zuur, A. F., E. N. Ieno, N. J. Walker, A. A. Saveliev, and G. M. Smith. 2009. Mixed Effects Models and Extensions in Ecology with R, Vol. 574. New York: Springer New York. https://doi.org/10.1007/978-0-387-87458-6.
Appendix 1.
Data and data processing flow
Figure A1. Data and data processing flow.
The data and data processing flow of this research is shown in Appendix . The general data and data processing flow in this research involves both research side and China Unicom Side:
Step 1: We proposed the general needs to China Unicom regarding human mobility analysis in GBA during the first wave of the COVID-19 pandemic.
Step 2: China Unicom returned its current data capabilities and limitations: a) China Unicom supports mobile phone signaling data is used in this research instead of Call Detail Record (CDR), b) Due to the Chinese user privacy regulations, individual level mobility information cannot be transferred, c) Current market penetration rate of China Unicom in GBA is about 20% of the population, d) raw data formats is individual level trajectories (coordinate links). It is important to note that the research side can only know the raw data format instead of the individual raw data.
Step 3: Based on the raw data format, we defined stay points and travels/OD and their identification process. Based on user trajectories, user stay points were extracted using a threshold approach (500-m buffer & 30+ min stay area). A user travel is defined as the movement between two continuous stay points (origin and destination).
Step 4: We transferred the algorithms/codes of Step 3 to China Unicom.
Step 5: China Unicom extracted individual level travels with defined algorithms in Step 3 and individual level signal dataset. It is important to note that all these individual level signal datasets can only be accessed by China Unicom.
Step 6: China Unicom aggregated the individual level travel data into 500 × 500-m grids with a 30-min temporal resolution. Appendix provides an example of the aggregated mobility data format. For every 30 min, it contains aggregated numbers of user travel between every two geo-grids (Origin Grid and Destination Grid). In this data format, no individual-level information can be accessed, while population-level mobility patterns can be analyzed with a 500-m spatial resolution and 30-min temporal resolution. From our perspective, mobility information is anonymously aggregated, and population-level mobility changes can be analyzed.
Figure A2. The data format of aggregated mobility data.
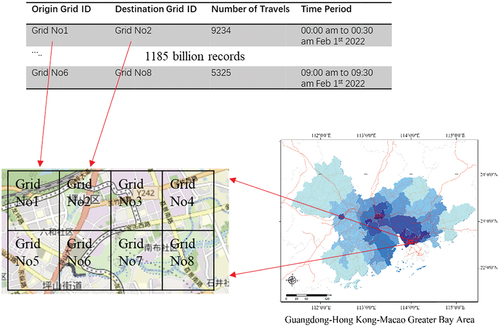
Step 7: The aggregated mobility dataset was transferred to the research side. The total number of data records in aggregated mobility dataset is 1185 billion (Format as Appendix ).
Step 8: With aggregated mobility dataset, a series of spatiotemporal analyses regarding human mobility change in GBA during the first wave of the COVID-19 pandemic was conducted. For example, the mobility volumes in GBA can be calculated by the sum of all travels in Appendix .