
 ?Mathematical formulae have been encoded as MathML and are displayed in this HTML version using MathJax in order to improve their display. Uncheck the box to turn MathJax off. This feature requires Javascript. Click on a formula to zoom.
ABSTRACT
Artificial impervious surface, as the hallmark of urbanization, contributes to urban development but simultaneously leads to urban PM2.5 pollution. However, how artificial impervious surface affected PM2.5 at the intra-urban scale was rarely investigated. By using remote-sensing techniques to derive PM2.5 concentrations and dividing urban areas into two categories with different urban development situation (areas with drastic expansion of artificial impervious surface (DEA) and areas with slight or no changes of artificial impervious surface (SNCA)), we provided a new perspective for investigating the effects of spatial patterns of artificial impervious surface on PM2.5. First, based on multi-source predictors, a two-staged XGBoost model was adopted to derive PM2.5 concentrations. Then, after delineating DEA and SNCA based on the variations of artificial impervious surface and selecting indicators, the overall and local effects of spatial patterns of artificial impervious surface were respectively explored by Original Least Square regression (OLS) and Geographically Weighted Regression (GWR). The results demonstrated that, compared with in SNCA, population and economic development contributed to higher levels of PM2.5 concentrations in DEA. Additionally, in DEA, high PM2.5 concentrations tended to occur in areas with artificial impervious surfaces exhibiting high coverage, complex shape, and uncompact distribution. In SNCA, among all landscape spatial patterns, the effect of artificial impervious surface coverage was the strongest. Spatially, artificial impervious surface coverage and economic development had much more significant impacts on PM2.5 than other indicators. Among these two indicators, the exacerbating effect of artificial impervious surface coverage on PM2.5 pollution was more pronounced in SNCA, while economic development notably brought high PM2.5 concentrations in the suburban districts of DEA. In general, the framework proposed in this study advanced the understanding of the effects of artificial impervious surface on PM2.5 and the findings are valuable for the mitigation of PM2.5 pollution at the intra-urban scale.
1. Introduction
Air pollution has become a severe global threat and was identified as a major cause of human mortality by World Health Organization (WHO) (World Health Organization Citation2018). Among all air pollutants, PM2.5 (particulate matter aerodynamic with diameters smaller than 2.5 μm) has posed significantly negative effect on human health. It has been reported that high-concentration PM2.5 can cause a range of respiratory and cardiovascular diseases including asthma, stroke, bronchitis, heart disease and lung cancer (Brook et al. Citation2010; Dominici et al. Citation2006; Liu, Saari et al. Citation2021). In 2015, PM2.5–related deaths reached 4.2 million globally, with a large proportion occurring in developing countries such as China (Forouzanfar et al. Citation2016; Liu, Saari et al. Citation2021). Moreover, in China, diseases associated with PM2.5 resulted in 100 billion US dollars of medical costs per year, accounting for 0.91% of national Gross Domestic Production (GDP) (Maji et al. Citation2018).
In urban areas, PM2.5 pollution is particularly severe, primarily due to the presence of artificial impervious surface. Artificial impervious surface, including buildings, roads and other artificial hard surface, is the primary component of urban built-up areas and frequently harbors areas with severe air pollution (Mo et al. Citation2021; Qi et al. Citation2022). In the process of urbanization, the transformation from forest, cropland and many other natural surfaces to urban artificial impervious surface weakened the mitigating effect of ecological spaces on PM2.5 (Chen et al. Citation2019a; Fan et al. Citation2022; Zhan, Yang, and Liu Citation2024). Simultaneously, high-intensity urban expansion brought numerous urban construction activities, resulting in high emission of air pollutants (Lim et al. Citation2020; Shi et al. Citation2020). Besides, accompanied with urban construction activities, the growth of urban residents and economic production in artificial impervious surface lead to significant energy consumption, releasing a substantial amount of traffic and industrial emissions into the urban atmospheric environment (Leffel et al. Citation2022; Pérez et al. Citation2010). In fact, with the expansion of artificial impervious surface, many cities in China and other developing countries are experiencing severe PM2.5 pollution (Larkin et al. Citation2016; Wei et al. Citation2021). Therefore, understanding how artificial impervious surface affects PM2.5 is crucial for mitigating urban PM2.5 pollution and creating a sustainable living environment.
Urban areas with well-planned landscape spatial patterns of artificial impervious surface can exert a promoting effect on PM2.5 pollution mitigation. Commonly, most of existing studies used landscape metrics to measure the landscape spatial patterns of artificial impervious surface or similar study objects, such as urban built-up areas (Gao et al. Citation2023; Liu, He et al. Citation2021; Shi et al. Citation2019). Size (coverage), shape, compactness, and many other spatial attributions of artificial impervious surface or built-up areas were quantified through landscape analysis and related influencing mechanism regarding to PM2.5 has been preliminarily investigated. For example, it has been suggested that cities with compact urban built-up areas are beneficial for the mitigation of PM2.5 pollution (Fan et al. Citation2018; Gao et al. Citation2023; Tao et al. Citation2020). In addition, Zhao et al. found that urban size played a more important role than other landscape metrics in China and larger cities tended to suffer from severer PM2.5 pollution (Zhao et al. Citation2022). Certainly, it also should be pointed out that most studies were mainly conducted at large spatial scales such as national or urban-agglomeration scales, with one single city being viewed as a basic unit. Consequently, these studies tended to explore the effect of urban built-up areas rather than urban artificial impervious surface on PM2.5 (Li and Zhou Citation2019; She et al. Citation2017). Nevertheless, intra-urban scale is closer to urban residents and how landscape spatial patterns of artificial impervious surface or urban built-up areas affect PM2.5 at the intra-urban scale is still unclear. Moreover, it may be more meaningful to investigate the effect of landscape spatial patterns of artificial impervious surface rather than the whole urban built-up areas at the intra-urban scale. This is because urban built-up areas have clear and continuous ranges and contain many natural green and blue spaces such as trees and lakes, which can introduce some uncertainty to the investigation concerning the influencing mechanism of urban development on PM2.5 (Kuang et al. Citation2013). Given that both population and economic activities are mainly distributed in artificial impervious surface (Wang and Gai Citation2021), for more reasonably demonstrating the effect of urban development on PM2.5, focusing on artificial impervious surface is more appropriate at the intra-urban scale.
Apart from landscape spatial metrics, population and economic factors are also viewed as the essential parts of spatial patterns of artificial impervious surface. They are directly related with urban development and some studies have explored the effects of them on PM2.5 at large spatial scales. It was found that there were “inversed-U” relationships between population and economic factors and PM2.5 in many cities (Han et al. Citation2016; Zhao et al. Citation2019). This is because urban population and economic development initially tended to aggravate PM2.5 pollution and then advanced its mitigation as the advancement of society and technology. In addition, Wu et al. found that the relationship between PM2.5 and economy demonstrated an “inversed-N” shape in the eastern cities of China while an “inversed-U” shape in central China (J. Wu et al. Citation2018).
Even though the effects of spatial patterns of artificial impervious surface on PM2.5 have been investigated to some extent, how they affect PM2.5 at the intra-urban scale still remained to explore. From the perspective of urban development, urban areas can be broadly categorized into two typical classes: areas with drastic expansion of artificial impervious surface (DEA) and areas with slight or no changes of artificial impervious surface (SNCA) (Jiao, Mao, and Liu Citation2015). DEA is dominated by incremental planning and is undergoing rapid urban expansion, with most areas located in new towns. Dominated by inventory planning, SNCA generally exhibits low urban expansion intensity, as most urban constructions and road networks have already been built. The characteristics of landscape spatial metrics, population and economic development in these two types of areas are distinct (Zuo, Li, and Dong Citation2018), so the influence of spatial patterns of artificial impervious surface on PM2.5 pollution may also be different. Considering these differences, for better guiding the PM2.5 pollution mitigation at the intra-urban scale, it is worth focusing on these two typical areas with different urban development patterns and exploring the influence of the spatial patterns of artificial impervious surface on PM2.5.
Additionally, artificial impervious surface, population and economic activities vary spatially (Krehl et al. Citation2016), which may lead to the effects of spatial patterns of artificial impervious surface on PM2.5 within DEA or SNCA also vary spatially. To identify where the spatial patterns of artificial impervious surface affect PM2.5 significantly, exploring local effects is also necessary. However, given the sparse distribution of ground monitoring sites of PM2.5 at the intra-urban scale (Fan et al. Citation2020; Zhan, Yang, and Liu Citation2024), PM2.5 concentration observations are insufficient for exploring the local effects of spatial patterns of artificial impervious surface. Fortunately, by applying remote sensing technique, spatially varied PM2.5 concentrations can be derived and they can provide more information compared with disperse PM2.5 ground sites (Li et al. Citation2020; Yin et al. Citation2022). Hence, deriving spatially varied PM2.5 concentrations at the intra-urban scale and further investigating the spatially local effects of spatial patterns of artificial impervious surface on PM2.5 is essential.
In this study, by using Wuhan, a megacity in China, as the study area, a comprehensive investigation to explore the effects of spatial patterns of artificial impervious surface on PM2.5 were conducted. Specifically, this study aimed to 1) derive intra-urban PM2.5 concentration maps for further investigation; 2) explore how spatial patterns of artificial impervious surface generally affect PM2.5 in DEA and SNCA; 3) explore the local effects of spatial patterns of artificial impervious surface on PM2.5 within DEA and SNCA.
2. Materials and methods
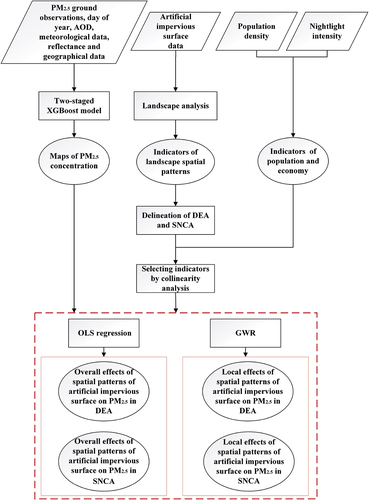
To achieve our goals, a research framework was developed (as shows). First, based on multi-source predictors, spatially varied PM2.5 concentrations during 2015–2019 were derived based on a two-staged machine learning model. The reason for selecting the time span of 2015–2019 is that the “new urbanization strategies” of Wuhan was developed in 2014. It proposed the requirement for high-quality urban development (Zeng, Zhang, and Xu Citation2016). Different from the rapid development mode of the past two decades, the recent development of artificial impervious surface in Wuhan has significantly shifted its focus toward urban environmental protection, which is also aligned with China’s future urban development goals (Guan et al. Citation2018). Hence, selecting the time span of 2015–2019 can better represent the practical situation of the urban development in Wuhan. Then, by utilizing the data extracted from a land-use/cover dataset, annual landscape spatial patterns of artificial impervious surface were calculated by landscape analysis. Both DEA and SNCA were delineated according to the variations of artificial impervious surface coverages. Furthermore, to eliminate collinearity as much as possible, we selected appropriate influencing indicators by collinearity analysis with using Variation Inflation Factor (VIF) for measuring. Finally, Original Least Square (OLS) regression and Geographically Weighted Regression (GWR) were respectively used to explore the overall and local effects of spatial patterns of artificial impervious surface on PM2.5 in both DEA and SNCA.
Figure 1. Flow chart of this study.
2.1. Study area
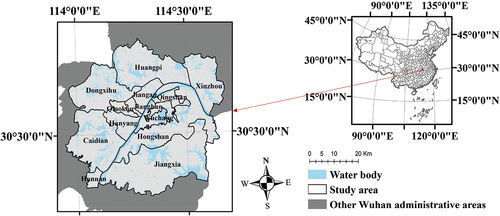
Wuhan, a megacity located in the middle of China, was selected as the study area (). Wuhan has built-up areas of 885 km2, population of over 10 million, and annual GDP of over 1800 billion yuan. With the development of social economy, urban air pollution has been a concern for this city and the annual mean PM2.5 concentration of Wuhan has exceeded 100 μg/m3 in 2013 (Zhang et al. Citation2015). To address this issue, Wuhan adopted some measures such as industrial upgrades, resulting in the annual mean PM2.5 concentration decreasing to 49 μg/m3 by 2018. However, this value was still much higher than the new guiding concentration (5 μg/m3), advised by WHO. Moreover, among all monitoring pollutants, the number of days when PM2.5 was the primary urban pollutant was still the most in Wuhan. In our study, for focusing on the effects of urban artificial impervious surface on PM2.5, Wuhan Urban Development Area was further selected as the study area because it contains the main urban built-up areas of Wuhan.
Figure 2. The study area of Wuhan.
2.2. PM2.5 concentration derivation
Ground site-based PM2.5 concentration observations cannot accurately depict the spatial variation of PM2.5 concentrations, which can introduce some uncertainty into the investigation at the intra-urban scale. To obtain spatially varied PM2.5 concentrations, we employed a two-staged XGBoost model that incorporated multi-source predictors and ground PM2.5 concentration observations.
2.2.1. Data for PM2.5 concentrations derivation
To derive PM2.5 concentration maps, ground PM2.5 concentration observations from 26 national sites during 2015–2019 and the data of 19 predictors were used. For increasing sampling density, in addition to the data from the 10 national sites in our study area, we also used the data from other 16 national sites located in neighboring cities with similar geographical and meteorological conditions to Wuhan. Daily mean PM2.5 concentrations of each site were further calculated for model construction. The locations of these ground sites are shown in Figure S1. As for predictors, many temporal predictors were applied. Specifically, day of year, remote sensing predictors including Aerosol Optical Depth (AOD) and surface reflectance, meteorological predictors including relative humidity, temperature, pressure, east-west direction wind speed, north-south direction wind speed, and planetary boundary layer height were utilized. In addition, geographical predictors including elevation, road density, nightlight intensity and population density were also utilized. Among all predictors, AOD is an important property of aerosol and the main carrier of PM2.5. It has been proved to be closely related with PM2.5 and was also used in many previous studies for deriving PM2.5 concentrations (Fan et al. Citation2020; Kahn, Banerjee, and McDonald Citation2001; Li et al. Citation2017). Multi‐Angle Implementation of Atmospheric Correction (MAIAC) AOD, an open-source AOD product with high spatial resolution of 1 km was used. In addition, PM2.5 is also affected by meteorological conditions and land surface, so meteorological predictors, surface reflectance and some geographical predictors were also used for deriving PM2.5 concentrations. Here, for better establishing the relationship between PM2.5 and land surface and considering the spatiotemporal variation of land surface (Yang, Yuan, and Li Citation2022), 8-day averaged Moderate Resolution Imaging Spectroradiometer (MODIS) surface reflectance with 500 m spatial resolution was applied. This dataset is of relatively high spatial and temporal resolution, which can provide sufficient spatio-temporal information for PM2.5 concentration deriving. For decreasing uncertainty, reflectance with cloud covering rate less than 5% were used. Moreover, the spatial grids of reflectance were exploited for deriving PM2.5 concentrations given that 500 m is fine enough for the investigation at the intra-urban scale. Details about the predictors are shown in Table S1.
2.2.2. Two-staged XGBoost model
Two-staged XGBoost, a machine learning model with two stages, was applied for PM2.5 concentration deriving (Fan et al. Citation2020, Citation2022). It contains two sub-XGBoost models for AOD gap-filling and PM2.5 concentration deriving, respectively. Due to the contamination of clouds, there are some absences in AOD data. This can render many PM2.5 concentration observations corresponding to the AOD absences unusable and has significantly negative effect on the model construction of PM2.5 concentration derivation (Li et al. Citation2023; Park et al. Citation2020; Yu et al. Citation2015). To minimize the negative effect, the first sub-model of the two-staged XGBoost integrated original AOD, day of year, meteorological predictors and geographical predictors to fill the gaps in original AOD (Fan et al. Citation2020). Then, with using the gap-filled AOD, ground PM2.5 concentration observations, day of year, meteorological predictors and geographical predictors, the second sub-model derived spatially varied daily PM2.5 concentration maps. Annual mean PM2.5 concentration maps were further calculated. In addition, sample-based (assessing overall accuracy) and site-based (assessing spatial generalized ability) 10-fold cross-validation (CV) were used to assess the model performance (Fan et al. Citation2022; Gong et al. Citation2020). Root Mean Square Error (RMSE), Mean Predicted Error (MPE), and coefficient of determination (R2) were used as the metrics for model assessment. Details about the main tuning hyper parameters of the two-staged XGBoost model are shown in Table S2. Both the construction and assessment of the two-staged XGBoost were conducted in Python 3.7.
2.3. Analysis regarding to the spatial patterns of artificial impervious surface
2.3.1. Data for obtaining spatial patterns of artificial impervious surface
(1) Impervious surface
The artificial impervious surface data was obtained from the China’s Land-use/Cover Datasets (CLCD, https://zenodo.org/record/5816591) (Yang and Huang Citation2021). The dataset contains annual land cover data of China from 1990 to 2019 with spatial resolution of 30 m, which is beneficial for the investigation at the intra-urban scale. In addition, after testing more than 5000 visual interpretation samples and 5000 third-party test samples (Yang and Huang Citation2021), the overall classification accuracy of this dataset can reach about 80%, with high reliability. Hence, given high requirement of spatio-temporal accuracy and temporal continuity on artificial impervious surface, the CLCD dataset is suitable for the investigation.
The dataset includes eight land cover types and the data of impervious surface from 2015 to 2019 was used for the investigation of influencing mechanism. Furthermore, to explore the influence of artificial impervious surface on PM2.5, natural impervious surfaces such as beach and bare land were removed manually.
(2) Population and economic data
In addition to impervious surface, population density and nightlight intensity were also used as the indicators for the investigation. In the process of urban development, after the expansion of artificial impervious surface, population and economic activities will increase, resulting in air pollutants emitted to urban atmosphere. Therefore, both population and economy are also the important attributes of artificial impervious surface spatial patterns (Han Citation2018). For depicting the economic development in artificial impervious surface, night intensity with spatial resolution of about 500 m was obtained from NPP-VIIRS satellite and downloaded in Google Earth Engine (https://earthengine.google.com/). Annual mean nightlight intensity during 2015–2019 was further calculated. Additionally, annual population with spatial resolution of 1 km was downloaded from the world population database (https://www.worldpop.org/).
(3) Meteorological data
In the derivation of PM2.5 concentrations, measured by variable importance, temperature, relative humidity and wind speed were found to have the most significant impact on deriving PM2.5 concentrations among all meteorological factors (Figure S2). In addition, these three indicators were also commonly used in previous studies for investigating the influencing mechanism regarding PM2.5 (Fan et al. Citation2018; Gao et al. Citation2023; Zhao et al. Citation2021). Hence, they were used as the auxiliary indicators for investigating the influencing mechanism. In the investigation of influencing mechanism, wind speed is the root of the arithmetically squared sum of the east-west wind speed and the north-south wind speed, which were used in PM2.5 concentration deriving. The annual average values of these three meteorological factors were calculated for the investigation.
2.3.2. Landscape analysis
Landscape spatial patterns of artificial impervious surface have been proved to be related with PM2.5 concentrations at national or urban-agglomeration scales. To reduce information redundancy, we selected candidate indicators from three aspects: size, shape and aggregation after referring some existing studies (Liang and Gong Citation2020; Shi et al. Citation2019). Specifically, they contain: Percentage of Landscape (PLAND, size), Area-weighted Mean Shape Index (AWMSI, shape), Area-weight Perimeter-area Fractal Dimension Index (AWFRAC, shape), Contagion (CO, aggregation), Aggregation Index (AI, aggregation), Dispersion Index (DI, aggregation).
Among them, PLAND represents the coverage of artificial impervious surface and its equation is EquationEquation (1)(1)
(1) . Here,
is the area of artificial impervious surface in the ith grid and
is the area of a grid.
AWMSI and AWFRAC can represent the shape complexity of artificial impervious surface. The larger the two indicators, the more complex and irregular the shape of artificial impervious surface is. The range of AWMSI and AWFRAC are (1,+∞) and (1, 2) respectively. The equations of AWMSI and AWFRAC are EquationEquation (2)(2)
(2) and EquationEquation (3)
(3)
(3) , respectively. Here,
is the area of the jth artificial impervious surface patch in the ith grid, and
is the perimeter of the jth artificial impervious surface patch in the ith grid.
CO, AI and DI can represent the aggregation of artificial impervious surface. Higher levels of CO and AI or lower levels of DI represent more compact artificial impervious surface. The equations of CO and AI are EquationEquation (4)(4)
(4) and EquationEquation (5)
(5)
(5) , respectively. In EquationEquation (4)
(4)
(4) ,
is the percentage of the ith patch,
is the number of adjacent edges among all artificial impervious surface patches in a grid, and m is the number of patches. In EquationEquation (5)
(5)
(5) ,
is the number of the adjacent edges between two patches,
is the maximum value of the number of adjacent edges, and n is the number of all patches. DI is the combination of the number of patches (NP) and the Largest Patch Index (LPI), which can represent the fragmentation and integrity of patches respectively (Taubenböck et al. Citation2019). NP is the number of artificial impervious surface patches, and LPI is the proportion of the largest patch’s area in the total artificial impervious surface area. The combination of them can represent the aggregation of artificial impervious surface patches. The equation of DI is EquationEquation (6)
(6)
(6) . Here,
and
are the normalized NP and LPI, respectively. The ranges of them and DI are all in [0,100] and lower DI can depict more compact artificial impervious surface. More details about DI are represented in the supplementary file.
2.3.3. Delineation of DEA and SNCA
This study focused on the investigation at the intra-urban scale and explored how spatial patterns of artificial impervious surface affected PM2.5 in two typical urban areas, i.e. DEA and SNCA. To characterize these two abstract concepts, we made definitions for them based on the spatiotemporal coverages of artificial impervious surface during 2015–2019. For DEA, the definition is: from 2015 to 2019, the coverage of artificial impervious surface remained unchanged or was higher than that in the previous year, and the increase of artificial impervious surface coverage from 2015 to 2019 exceeded a certain threshold. For SNCA, the definition is: from 2015 to 2019, the inter-annual variations of artificial impervious surface coverages were less than 1%, and the artificial impervious surface coverage in 2015 exceeded a certain threshold. These two definitions are represented by EquationEquation (7)(8)
(8) and EquationEquation (8)
(8)
(8) , respectively. Here,
and
represent the type of DEA and SNCA respectively,
is the increase of artificial impervious surface coverage in the ith grid from 2015 to 2019,
is the artificial impervious surface coverage in the ith grid in a year,
is the artificial impervious surface coverage in the ith grid in the previous year,
is the artificial impervious surface coverage in the ith grid in 2015, and
and
are the thresholds to identify DEA and SNCA respectively. Additionally, for focusing on the investigation within urban built-up areas, the identified areas outside the urban built-up areas would be removed.
2.3.4. Indicators selection
Although the candidate indicators comprehensively reflected the spatial patterns of artificial impervious surface, the information they contained still had some redundancy. Therefore, before data analysis, we conducted collinearity analysis by adopting Variation Inflation Factor (VIF) to detect the collinearity among all indicators in both DEA and SNCA, and removed the indicators with high collinearity. The higher the VIF value is, the greater the collinearity between the corresponding indicator and other explanatory variables. The indicator with the highest VIF was removed in every VIF calculation until all VIFs of the remaining indicators were lower than a threshold. After referring some studies related to the influencing mechanism of PM2.5 (Chen et al. Citation2019b; G. Gao et al. Citation2023), the threshold was set as 10 in our study.
2.4. Statistical methods
2.4.1. Correlation analysis
Pearson Correlation Coefficient was used to measure the relationships between the spatial patterns of artificial impervious surface and PM2.5 concentrations. Its equation is EquationEquation (9)(9)
(9) . Here,
represented one indicator of artificial impervious surface spatial patterns,
represented PM2.5 concentration, and
is the correlation coefficient between them, with value ranging from
1 to 1. If the value is closer to 1, it indicates a stronger positive correlation. While if it is closer to
1, it suggests a stronger negative correlation.
2.4.2. OLS regression
To investigate the overall effects of spatial patterns of artificial impervious surface on PM2.5 concentrations, OLS regression was used. Compared with correlation analysis, which only examines the correlation between one single indicator and PM2.5 concentration, OLS regression can simultaneously explore the effects of multiple indicators on PM2.5 concentration. The equation of OLS regression is EquationEquation (10)(10)
(10) . Here, X is the indicator of the spatial patterns of artificial impervious surface,
is the corresponding regression coefficient,
is the intercept, Y is PM2.5 concentration, and ε is the random error. In addition, to facilitate the comparison between different years and between DEA and SNCA, all indicators of each year were normalized.
2.4.3. GWR
GWR was applied to investigate the local effects of spatial patterns of artificial impervious surface on PM2.5 concentrations. It constructs many OLS regression models in different locations and the local coefficients can represent the local effects of indicators on PM2.5 concentrations (Brunsdon, Fotheringham, and Charlton Citation1998; Fotheringham, Brunsdon, and Charlton Citation2003). Its equations are EquationEquations (11)(11)
(11) –(Equation13
(13)
(13) ), respectively. Here, EquationEquation (11)
(11)
(11) is similar with EquationEquation (10)
(10)
(10) but all parameters have their own locations. By EquationEquation (12)
(12)
(12) , GWR can estimate the local coefficients.
is the weighted matrix that considers the relationship between neighboring samples and the local sample. In this study, we used Bi-square function (EquationEquation (13)
(13)
(13) ) to generate the weighted matrix.
is the distance between the ith sample and the jth sample and
is the bandwidth in the ith sample.
3. Results
3.1. PM2.5 concentration deriving
The two-staged XGBoost performed well to derive PM2.5 concentrations. Both sample-based and site-based assessment represented great performance with R2, RMSE, MPE of 0.94, 7.88 μg/m3, 5.26 μg/m3 and 0.90, 10.55 μg/m3, 7.40 μg/m3 respectively. High R2 values in both sample-based and site-based assessment indicated good ability of the two-staged XGBoost among all samples and spatially for PM2.5 concentration deriving.
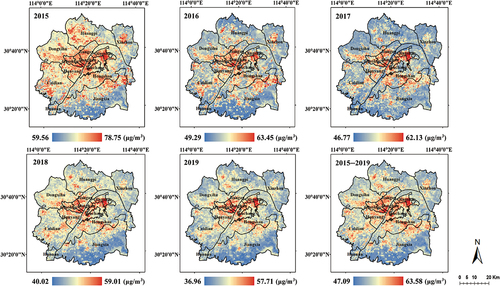
Annual mean PM2.5 concentration maps were further derived and were as shows. It was demonstrated that Wuhan suffered from the most serious PM2.5 pollution in 2015, with concentrations ranging from 59.56 μg/m3 to 78.75 μg/m3. Then, by 2019, PM2.5 concentrations generally decreased, ranging from 39.96 μg/m3 to 57.71 μg/m3. Additionally, it is worth noting that the decline rate slowed down during 2016–2019. Spatially, the distributions of all annual mean PM2.5 concentration maps represented similar patterns, with high PM2.5 concentrations in some urban central areas such as Jianghan district, and low PM2.5 concentrations in some suburban areas such as Jiangxia district. Moreover, some areas with numerous industrial parks, such as Qingshan district, also suffered from serious PM2.5 pollution.
Figure 3. Annual mean PM2.5 concentration maps.
3.2. Extractions of DEA and SNCA and indicators selection
3.2.1. Extraction of DEA and SNCA
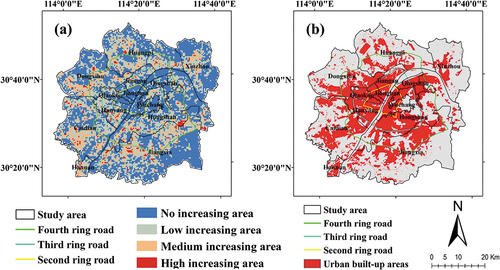
The spatial distribution of artificial impervious surface coverages during 2015–2019 and the increasing rates of artificial impervious surface in each administrative district of the study area are shown in and respectively. Based on the natural breaks (Jenks), artificial impervious surface coverages in each year were divided into three levels: low coverage, medium coverage and high coverage. In general, it can be seen that high artificial impervious surface coverages were mainly located in the urban central areas within the third ring road and low coverages were mainly found in suburban areas. From the perspective of administrative districts, as shown in , the artificial impervious surface coverages in urban central districts were very high, with values exceeding 50%. The artificial impervious surface coverages in suburban districts were about 20%. However, from 2015 to 2019, the increasing rates of artificial impervious surface in suburban districts were much higher than those in urban central districts. Except for Hongshan District and Hanyang District, the increasing rates of artificial impervious surface in urban central districts were less than 3%, while suburban districts experienced increasing rates exceeding 15%.
Figure 4. Coverages of artificial impervious surface.
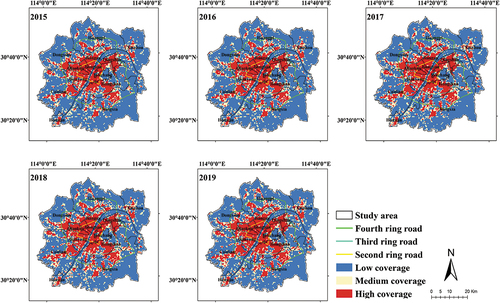
Table 1. Coverages and increasing rates of artificial impervious surface in administrative districts of the study area.
DEA was extracted mainly based on the variations of artificial impervious surface (as EquationEquation (7)(8)
(8) shows). The spatial variations of artificial impervious surface are shown in . It can be found that most high increasing rates of artificial impervious surface were located in areas near to the fourth ring road and areas between the third and fourth ring road. Identified by Jenks, the threshold in EquationEquation (7)
(8)
(8) was set as 7.3%, which was the threshold between “low increasing area” and “medium increasing area”. By setting this threshold, we can not only filter out the areas with low increasing rates but also capture rapidly expanding urban areas. In addition, for ensuring that the final results can more accurately represent the situation of urban context, few areas that were not located within the urban built-up areas (as shown in were excluded from DEA. The data of urban built-up area was obtained from the Globeland30 product in 2020 (http://www.globallandcover.com).
Figure 5. (a) Spatial variations of artificial impervious surface during 2015.
The extraction of SNCA was mainly based on the coverages of artificial impervious surface in 2015 and the variations of artificial impervious surface during 2015–2019 (as EquationEquation (8)(8)
(8) shows). Since SNCA already had high artificial impervious surface coverages in 2015, the threshold in EquationEquation (8)
(8)
(8) was set as 55% by Jenks, which was between “Medium coverage” and “High coverage” (as shows). Also, similar with the extraction of DEA, areas that were located outside the boundaries of urban built-up areas were also excluded from SNCA.
Final extracted DEA and SNCA are as shows. DEAs were mainly distributed in some new urban areas outside the third ring road, while SNCAs were mainly distributed in the urban central areas within the third ring road and some industrial parks in suburban areas. These two types of areas basically contained the majority of urban built-up regions, thereby providing benefits for the comprehensive investigation at the intra-urban scale. Furthermore, some statistical metrics of PM2.5 concentrations in both DEA and SNCA were calculated and are shown in . All mean PM2.5 concentrations in DEA were lower than that in SNCA during 2015–2019. Moreover, both the maximum and variance of PM2.5 concentrations in DEA were the highest in 2015 and subsequently decreased, representing a reduction of PM2.5 pollution in DEA after 2015. However, it is also noteworthy that the mean PM2.5 concentration in DEA was gradually approaching that in SNCA, indicating that the mitigation of PM2.5 pollution in DEA were weakening.
Figure 6. The spatial distribution of DEA and SNCA.
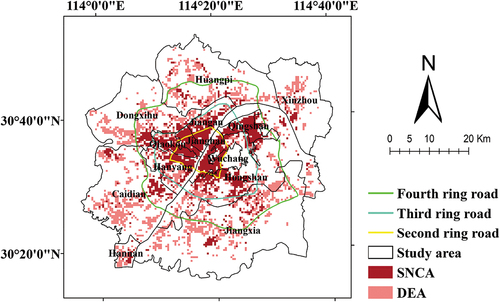
Table 2. Statistical values of PM2.5 concentrations in DEA and SCNA.
3.2.2. Indicators selection
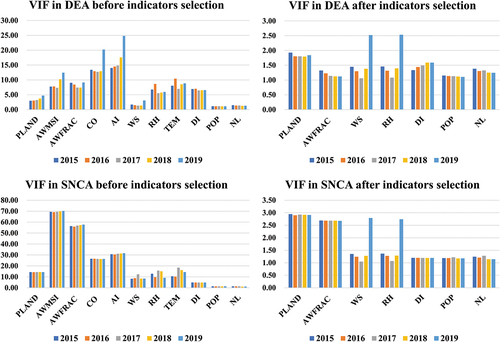
After extracting DEA and SNCA, we conducted a collinearity analysis by using VIF to select influencing indicators for the further investigation. The results are shown in . Compared with the indicators in DEA, the indicators in SNCA exhibited stronger collinearity, with many VIFs exceeding 10. Therefore, we selected indicators according to the result of SNCA first. The indicators with the highest VIF for each year were sequentially removed, including AI, AWMSI, CO and temperature. Then, a collinearity detection was conducted again after the selection, and it was found that all VIFs of the remaining indicators were less than 10, which met the requirements. Similarly, in DEA, after removing AI, AWMSI, CO and temperature, it was found that all VIFs of the remaining indicators were also less than 10. Therefore, the remaining indicators, i.e. PLAND, AWFRAC, wind speed, relative humidity, DI, population density and nightlight intensity, were applied to explore the influencing mechanism. Among them, PLAND, AWFRAC, and DI represented the size, shape and aggregation of the artificial impervious surface, respectively. Population density and nightlight intensity represented population and economy, respectively.
Figure 7. VIFs in DEA and SNCA before and after indicators selection. Here, PLAND represents the percentage, AWMSI represents the area-weighted mean shape index, AWFRAC represents the area-weight perimeter-area fractal dimension index, CO represents the contagion, AI represents the aggregation index, WS represents the wind speed, RH represents the relative humidity, TEM represents the temperature, DI represents the dispersion index, POP represents the population density, NL represents the nightlight intensity.
3.3. Effects of artificial impervious surface spatial patterns in DEA and SNCA
3.3.1. Overall effects in DEA and SNCA
The overall correlation relationships between spatial patterns of artificial impervious surface and PM2.5 in DEA were explored by correlation analysis and the results are shown in . It can be found that the PLAND of artificial impervious surface exhibited a strong positive correlation with PM2.5 concentrations. Among other patterns, DI showed a negative correlation with PM2.5 concentrations. In terms of population and economic factors, both population density and nightlight intensity showed positive correlations with PM2.5 concentrations. Moreover, the positive correlation between nightlight intensity and PM2.5 concentration was the strongest among all spatial patterns, indicating that in DEA, economic development may have the strongest association with PM2.5 pollution. Two meteorological factors showed negative correlations with PM2.5 concentrations, indicating that higher wind speed and relative humidity may provide benefits for decreasing PM2.5 concentrations in DEA.
Figure 8. The correlation coefficients between spatial patterns of artificial impervious surface and PM2.5 in DEA (a) and SNCA (b). The blank indicates that the coefficient didn’t pass the significance level test of p < 0.05. Here, PLAND represents the percentage, AWFRAC represents the area-weight perimeter-area fractal dimension index, WS represents the wind speed, RH represents the relative humidity, DI represents the dispersion index, POP represents the population density, NL represents the nightlight intensity.
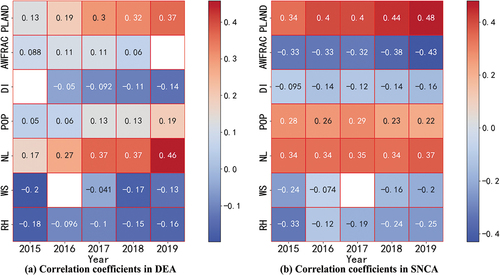
In comparison, the correlations between the spatial patterns of artificial impervious surface and PM2.5 concentrations in SNCA are stronger than that in DEA (). The positive correlation between the PLAND of artificial impervious surface and PM2.5 concentration was the strongest. As for other landscape spatial patterns, AWFRAC displayed a significantly negative correlation with PM2.5 concentrations, which was different from the situation in DEA. In SNCA, when the edges of artificial impervious surface are complex, there are usually some irregular natural water bodies or woodlands around artificial impervious surface, and they can contribute to PM2.5 pollution mitigation. In addition, DI also had a negative correlation with PM2.5. In terms of meteorological factors, wind speed and relative humidity, similar to the correlations in DEA, showed negative associations with PM2.5 concentrations in most years.
To analyze the overall effects of the influencing indicators on PM2.5, OLS was applied. showed the results of model assessment and regression coefficients in DEA. The metrics of model assessment contain R2, adjusted R2 (Adj.R2) and RMSE. Higher R2, adjusted R2 and lower RMSE represent better model performance. It can be found that both R2 and adjusted R2 increased and RMSE decreased during 2015–2019, indicating an improvement temporally. Among all spatial patterns, economy (represented by NL, nightlight intensity) had the greatest effect on aggravating PM2.5 pollution, which was similar with the results in correlation analysis. The regression coefficient of NL did not consistently increase but displayed a trend of initially increasing, then decreasing, and finally slowly increasing during 2015–2019. In addition, the aggravating effect of population on PM2.5 pollution became stronger and stronger after 2016. In comparison, the coefficients of landscape spatial patterns demonstrated decreasing trends and the effects of them on PM2.5 were weaker than that of population after 2016. This indicated that after the drastic expansion of artificial impervious surface, accompanied increasing population may bring serious PM2.5 pollution. The regression coefficients of PLAND, AWFRAC and DI were all positive, indicating that the artificial impervious surface with large coverage, complex shape and uncompact distribution can aggravate PM2.5 pollution in DEA. Also, it should be noted that the regression coefficients of DI were positive but the corresponding coefficients in correlation analysis were negative. This suggested that correlation analysis may not accurately reflect the practical impact when multiple indicators were considered. In terms of meteorological factors, except for the wind speed in 2015, both high wind speed and relative humidity can mitigate PM2.5 pollution. The reason for the positive coefficient of wind speed in 2015 May be related with the extensive construction of buildings and roads in 2015 and wind speed generally promoted the spread of PM2.5 from construction sites to atmospheric environment (Xie et al. Citation2022).
Table 3. The OLS coefficients of spatial patterns of artificial impervious surface in DEA.
The overall effects of spatial patterns of artificial impervious surface on PM2.5 in SNCA were also explored by OLS and the results were as shows. All OLS models performed better than those in DEA during 2015–2019. Temporally, the changed trends of the effects of PLAND, population and economy were basically the same as those in DEA and the effect of economy was also the strongest. However, the regression coefficients of economy in SNCA were much lower than those in DEA, indicating that the economic development in SNCA had weaker effect on PM2.5 pollution. A similar phenomenon was also reflected in population. In terms of the landscape spatial patterns of artificial impervious surface, the coefficients of PLAND in SNCA were significantly higher than those of other landscape spatial patterns and were also higher than those of the PLAND in DEA. This indicated that artificial impervious surface coverage was more important than other landscape attributes in affecting PM2.5 in SNCA. AWFRAC had negative impacts on PM2.5 concentrations in some years, which were much weaker than that of PLAND (lower absolute values). In addition, DI had no significant effect on PM2.5 in most years. In terms of meteorological factors, higher wind speed and relative humidity could bring stronger effects on mitigating PM2.5 pollution when compared with those in DEA.
Table 4. The OLS coefficients of spatial patterns of artificial impervious surface in SNCA.
3.3.2. Local effects in DEA and SNCA
By GWR, the local effects of spatial patterns of artificial impervious surface on PM2.5 were explored. Compared to OLS, GWR performed better, with both R2 and Adj.R2 exceeding 0.5 in most years (). To ensure the validity of the investigation, only the local coefficients passing the significance level test of p < 0.05 were retained and the proportions were as shows. It can be found that, compared with those of AWFRAC, DI and POP, much more local coefficients of PLAND and NL passed the significance level test. This indicated that the PLAND and economic factor of artificial impervious surface may play more important roles in affecting local PM2.5 concentrations. Therefore, in the further analysis, we would focus on the local effects of PLAND and NL on PM2.5.
Table 5. The performance of GWR.
Table 6. Proportions that the local coefficients passed the significance level test of p < 0.05.
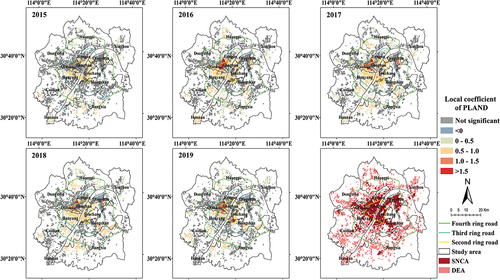
The local coefficients of PLAND are shown in and their spatial variations were demonstrated. In general, the significant coefficients showed similar spatial patterns during 2015–2019 and most of them were positive, indicating that the increase of PLAND led to more serious PM2.5 pollution in these areas. Spatially, most coefficients with high values were found in the SNCA within the second ring road, especially in the boundary region between Jianghan district and Qiaokou district, which contains many urban villages and industrial parks with dense buildings. In these areas, though urban construction intensity was lower than that in DEA and industrial activities were less than those in some large industrial parks located in suburban areas, densely distributed buildings can block air flow and make it difficult for PM2.5 to disperse (Yuan et al. Citation2019; Y. Zhou et al. Citation2019). In addition, some DEAs were near to these SNCAs and the intensive construction activities from the DEAs may also bring some air pollutants.
Figure 9. The local coefficients of PLAND.
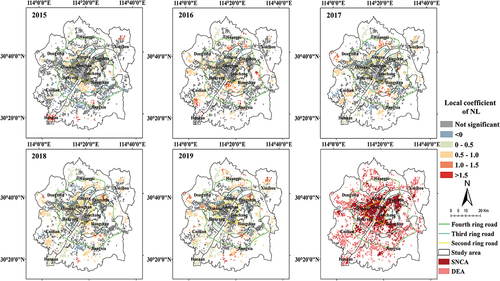
The local coefficients of NL were depicted in . Temporally, the spatial distributions of the local coefficients of NL in these 5 years were similar. Spatially, the spatial distribution of the local coefficients of NL were quite different from that of PLAND. Most local coefficients within the second ring road were insignificant and high NL local coefficients were more prevalent in the DEAs outside or near the third ring road. Most of these DEAs were distributed in suburban districts such as Caidian, Jiangxia and Huangpi, which are suffering from relatively rapid urban expansion. Compared with the districts in urban central areas, these areas had more factories with high emissions, making them more susceptible to PM2.5 pollution. In addition, given lower standards and attention, air pollution control related with economic activities in these areas was still not as strict as that in urban central areas. Certainly, it should be noted that in some areas of SNCA, economic develop also brought negative effects on the mitigation of PM2.5 pollution. For example, there were many high local coefficients in the Qingshan industrial park, located in Qingshan district. This industrial park is an important heavy industrial base for steel and chemical manufacturing and has been established for decades. The economic activities here have resulted in significant emissions and serious PM2.5 pollution.
Figure 10. The local coefficients of NL.
4. Discussion
4.1. The effects of artificial impervious surface on PM2.5 at the intra-urban scale
The effects of the spatial patterns of artificial impervious surface on PM2.5 at the intra-urban scale were explored in this study. Many previous studies have extensively discussed how artificial impervious surface affected PM2.5 at large scales such as within a country or an urban agglomeration (Gao et al. Citation2023; Shi et al. Citation2020; Wang and Gai Citation2021), while neglecting the influencing mechanism at the intra-urban scale. In this study, we provided a new perspective from DEA and SNCA to explore the effects of spatial patterns of artificial impervious surface. In fact, they represented two types of urban environment. DEA just underwent the transformation from “rural areas” to “urban areas” and consisted of many urban construction activities. In addition, given ample land availability and low rental costs, many industrials tended to gather here (Gao, Liu, and Dunford Citation2014). As for SNCA, after many years of urban development, it typically had fewer activities of industrial production and urban construction but more population and traffic activities. Therefore, because of the differences in urban environment, distinct effects of spatial patterns of artificial impervious surface on PM2.5 at the intra-urban scale can be found.
For landscape spatial patterns of artificial impervious surface, the coverage of artificial impervious surface played a more significant role than other landscape attributes in affecting the PM2.5 in SNCA while the influencing degrees of all landscape spatial patterns were almost at a same level in DEA. In some previous studies, scholars have found that both urban size and compactness were important in affecting PM2.5 pollution (Fan et al. Citation2018; Gao et al. Citation2023) at national and urban-agglomeration scales. In our study, at the intra-urban scale, the important role of the coverage of artificial impervious surface was also confirmed. However, we found that compactness brought significant effects on PM2.5 only in DEA but had insignificant effects in SNCA. There are many intensive urban construction activities in DEA. Compact artificial impervious surface can not only limit the spread of these construction activities (Jabareen Citation2006), but also reduce urban traffic commuting intensity, thus reducing PM2.5 emission (Fan et al. Citation2018). However, the artificial impervious surface in SNCA contains higher and denser buildings. Although compact artificial impervious surface can mitigate traffic air pollution to some extent, it can also weaken the dispersion of PM2.5 (Yang et al. Citation2020), thus rendering the overall effects of artificial impervious surface compactness in SNCA insignificant.
Population and economic factors are also the essential parts of the spatial patterns of artificial impervious surface. Both of them caused more PM2.5 pollution in DEA than in SNCA, indicating that the PM2.5 emission from human economic activities in SNCA was lower. On one hand, this is because many factories with high-energy consumption have relocated from urban central areas to the suburbs in recent years. On the other hand, urban residents in SNCA are mainly involved in industries with low energy consumption, such as service and high-tech industry, which generate lower PM2.5 emissions. Hence, the industries with high-energy consumption in DEA still require more attention in air pollution control.
Temporally, this study analyzed the effects of artificial impervious surface during 2015–2019. It can be seen from that the aggravating effect of most artificial impervious surface spatial patterns on PM2.5 pollution had weakened since 2016 in both SNCA and DEA. This may be linked with the intensified measures proposed by Wuhan government in 2016, which enhanced the supervision of highly polluted industries thus contributing to PM2.5 pollution mitigation. However, the aggravating effects of population and economy slightly increased during 2018–2019. Such a temporal change demonstrated that although Wuhan can reduce the PM2.5 emissions in a short time period by adopting strong temporary measures, population and economic development may still aggravate PM2.5 pollution in a long run (Chinese Academy of Science Citation2021). Hence, the quality of urban development in Wuhan still needs improvement and some fundamental measures regarding energy consumption should be further developed.
4.2. Local effects on PM2.5
PLAND and NL, representing the coverage of artificial impervious surface and economic development respectively, demonstrated the most significant local effects on PM2.5 in many areas. In essence, these two factors are directly related with the emission and dispersion of PM2.5 pollutants, thus significantly impacting PM2.5 concentrations (Li et al. Citation2016; D. Zhang, Zhou, and He Citation2022). In addition, it can be found that there are some similarities between the overall effects and local effects. In these two effects, the coverage of artificial impervious surface significantly affected the PM2.5 in SNCA while economic development had more significant effects in DEAs. Meanwhile, some specific and significant effects that were neglected by overall investigation can further be discovered by local investigation. For instance, in our overall investigation, economic development resulted in higher PM2.5 concentrations in DEA than in SNCA. However, in some SNCAs such as the Qingshan industrial park, economic development was also found to cause serious PM2.5 pollution. Therefore, local effects are not only the projections of overall effects in space but also can disclose some distinct results (Lu et al. Citation2022). These findings are crucial for the precise mitigation of PM2.5 pollution, and local investigation using spatial regression approaches such as GWR, are highly recommended to be applied at the intra-urban scale for exploring the effects of artificial impervious surface on PM2.5.
4.3. Implication for urban PM2.5 pollution mitigation
By exploring the effects of landscape spatial patterns of artificial impervious surface on PM2.5 in DEA and SNCA, measures for optimizing artificial impervious surface can be considered. In DEA, high PM2.5 concentrations tended to occur in areas with high-coverage and uncompact artificial impervious surface. Generally, DEA consists of many new urban areas, usually surrounded by some rural areas with high-quality ecological environment. Therefore, delineating ecological controlling lines and prohibiting drastic urban construction activities occurring outside the controlling lines can effectively hinder the extension of the artificial impervious surface. After controlling the range of urban constructions, planning large green parks is also worth being conducted. It can not only make the configuration of artificial impervious surface in DEA more compact but also decrease PM2.5 concentrations by the “depositing effect” of vegetation (Abhijith and Kumar Citation2020). For SNCA, the coverage of artificial impervious surface played the most significant role among all landscape spatial patterns in affecting PM2.5. However, most SNCAs have been constructed for many years and it is not practical to eliminate existing artificial impervious surface. Hence, some urban renewal measures such as the greening of roofs and roads can be considered for decreasing the PM2.5 concentrations in SNCA. Also, exploiting urban street canyon as the wind tunnel can enhance the dispersion of PM2.5, which is also beneficial for the mitigation of PM2.5 pollution in the areas with high-density buildings (He, Ding, and Prasad Citation2019; Wu et al. Citation2021).
From the perspective of population and economic factors, some measures can also be considered. It can be found from Section 3.3.2 that the local effects of both population and economic factors on PM2.5 in many SNCAs were insignificant. Hence, relocating industries with high emissions from urban central areas can be an effective way to reduce the PM2.5 pollution in SNCA. For some industrial base that can’t be moved, such as the Qingshan park in our study, it is crucial to emphasize the increased use of clean energy and the phased-out of energy-intensive processes in industrial production. For DEA, increasing population density and economic activities can individually lead to jobs-housing imbalance as well as low-quality industrial development, both of which can exacerbate PM2.5 pollution (Atash Citation2007). For satisfying the commuting needs of residents and further reducing traffic emissions caused by congestion, it is necessary to construct convenient public transportation networks in DEA (Lu et al. Citation2021). Moreover, developing green economy and high-tech industrials can also bring benefits to the air pollution mitigation in DEA.
4.4. Limitations
Some works can further be conducted to investigate the effects of spatial patterns of artificial impervious surface on PM2.5 at the intra-urban scale. First, we only analyzed the effects during 2015–2019 while the long-term overall and local effects are also worth being explored, which may be helpful for understanding more comprehensive spatiotemporal effects of the spatial patterns of artificial impervious surface on PM2.5. In the future, with the derivation of PM2.5 concentrations and the obtainment of artificial impervious surface in a long period, more annual and seasonal findings are expected to be found. Second, different types of cities, such as small and medium-sized cities, have not been discussed in this study. They own different development modes (Cai et al. Citation2024), which may cause varied effects on PM2.5. Therefore, in the future, we will select more cities, compare different models for PM2.5 concentration deriving and investigate how the spatial patterns of artificial impervious surface affect PM2.5 pollution among them.
5. Conclusion
In this study, by using Wuhan as a case, the effects of the spatial patterns of artificial impervious surface on PM2.5 at the intra-urban scale were explored. We provided a new perspective from urban development and divided urban areas into areas with drastic expansion of artificial impervious surface and areas with slight or no changes of artificial impervious surface for investigating the effects of artificial impervious surface on PM2.5. The findings are as follows: (1) By the two-staged XGBoost model, the annual spatial distribution of PM2.5 concentrations during 2015–2019 were derived with good performance. PM2.5 pollution was the most serious in 2015 with concentrations ranging from 59.56 μg/m3 to 78.75 μg/m3 and PM2.5 concentrations gradually decreased after 2015 with declining rate slowing down. (2) Based on the variations of artificial impervious surface during 2015–2019, both DEA and SNCA were delineated and appropriate influencing indicators were selected by collinearity analysis. DEAs were mainly distributed in the new urban areas outside the third ring road, while SNCAs were mainly distributed in the urban central areas within the third ring road and some suburban industrial zones. (3) Overall, population and economic factors caused more serious pollution in DEA than that in SNCA. Among all landscape spatial patterns, artificial impervious surface with high coverage, complex shape and uncompact distribution can bring high PM2.5 concentrations in DEA. While in SNCA, the coverage of artificial impervious surface (represented by PLAND) dominantly affected the aggravation of PM2.5 pollution. (4) Spatially, PLAND and economic development affected PM2.5 more significantly. PLAND had more significant effects on aggravating the PM2.5 pollution in SNCA, especially in the boundaries between Jianghan district and Qiaokou district. Whereas, economic development played a more important role in aggravating the PM2.5 pollution in DEA, especially in some suburban districts such as Caidian, Jiangxia and Huangpi, which are suffering from relatively rapid urban expansion. In general, this study developed a new perspective to investigate the effect of artificial impervious surface on PM2.5 at the intra-urban scale and the findings can provide differentiated guidance for the mitigation of intra-urban PM2.5 pollution.
Supplemental Material
Download MS Word (4.4 MB)Disclosure statement
No potential conflict of interest was reported by the author(s).
Supplementary material
Supplemental data for this article can be accessed online at https://doi.org/10.1080/10095020.2024.2350179
Additional information
Funding
Notes on contributors
Zhiyu Fan
Zhiyu Fan received his PhD degree at Wuhan University and is currently a postdoctoral fellow at Wuhan Natural Resources Conservation and Utilization Center. His research interests include urban ecological pattern and effect, urban sustainability and the application of remote sensing and GIS in urban planning.
Qingming Zhan
Qingming Zhan is a professor at Wuhan University. His research interests include digital and smart cities, the application of spatial information in urban planning and planning support systems.
Yun Wang
Yun Wang is a professorate senior engineer at Wuhan Natural Resources Conservation and Utilization Center. Her interest includes ecological planning and practice of urban planning and management.
Zhenfeng Shao
Zhenfeng Shao is a professor at Wuhan University. His research interest includes high-resolution remote sensing image processing and analysis, key technologies and applications of digital and smart cities.
Yuli Fan
Yuli Fan is an assistant professor at China University of Geosciences. His research interest includes urban wind and thermal environment, urban air pollution and regional development research.
Yifeng Zhang
Yifeng Zhang is working at Wuhan Natural Resources Conservation and Utilization Center. Her interest includes urban governance and practice of urban planning and management.
References
- Abhijith, K. V., and P. Kumar. 2020. “Quantifying Particulate Matter Reduction and Their Deposition on the Leaves of Green Infrastructure.” Environmental Pollution 265:114884. https://doi.org/10.1016/j.envpol.2020.114884.
- Atash, F. 2007. “The Deterioration of Urban Environments in Developing Countries: Mitigating the Air Pollution Crisis in Tehran, Iran.” Cities 24 (6): 399–409. https://doi.org/10.1016/j.cities.2007.04.001.
- Brook, R. D., S. Rajagopalan, C. A. Pope III, J. R. Brook, A. Bhatnagar, A. V. Diez-Roux, F. Holguin, Y. Hong, R. V. Luepker, and M. A. Mittleman. 2010. “Particulate Matter Air Pollution and Cardiovascular Disease: An Update to the Scientific Statement from the American Heart Association.” Circulation 121 (21): 2331–2378. https://doi.org/10.1161/CIR.0b013e3181dbece1.
- Brunsdon, C., S. Fotheringham, and M. Charlton. 1998. “Geographically Weighted Regression.” Journal of the Royal Statistical Society: Series D (The Statistician) 47 (3): 431–443. https://doi.org/10.1111/1467-9884.00145.
- Cai, B., Z. Shao, S. Fang, X. Huang, Y. Tang, M. Zheng, and H. Zhang. 2024. “The Evolution of Urban Agglomerations in China and How it Deviates from Zipf’s Law.” Geo-Spatial Information Science 27 (1): 38–48. https://doi.org/10.1080/10095020.2022.2083527.
- Chen, M., F. Dai, B. Yang, and S. Zhu. 2019a. “Effects of Neighborhood Green Space on PM2.5 Mitigation: Evidence from Five Megacities in China.” Building & Environment 156:33–45. https://doi.org/10.1016/j.buildenv.2019.03.007.
- Chen, M., F. Dai, B. Yang, and S. Zhu. 2019b. “Effects of Urban Green Space Morphological Pattern on Variation of PM2.5 Concentration in the Neighborhoods of Five Chinese Megacities.” Building & Environment 158:1–15. https://doi.org/10.1016/j.buildenv.2019.04.058.
- Chinese Academy of Science. 2021. Assessment of Urban Air Quality Attainment Plans in China and Strengthening Measure Research Report. Beijing, China.
- Dominici, F., R. D. Peng, M. L. Bell, L. Pham, A. McDermott, S. L. Zeger, and J. M. Samet. 2006. “Fine Particulate Air Pollution and Hospital Admission for Cardiovascular and Respiratory Diseases.” JAMA 295 (10): 1127–1134. https://doi.org/10.1001/jama.295.10.1127.
- Fan, C., L. Tian, L. Zhou, D. Hou, Y. Song, X. Qiao, and J. Li. 2018. “Examining the Impacts of Urban Form on Air Pollutant Emissions: Evidence from China.” Journal of Environmental Management 212:405–414. https://doi.org/10.1016/j.jenvman.2018.02.001.
- Fan, Z., Q. Zhan, H. Liu, Y. Wu, and Y. Xia. 2022. “Investigating the Interactive and Heterogeneous Effects of Green and Blue Space on Urban PM2.5 Concentration, a Case Study of Wuhan.” Journal of Cleaner Production 378:134389. https://doi.org/10.1016/j.jclepro.2022.134389.
- Fan, Z., Q. Zhan, C. Yang, H. Liu, and M. Bilal. 2020. “Estimating PM2.5 Concentrations Using Spatially Local Xgboost Based on Full-Covered SARA AOD at the Urban Scale.” Remote Sensing 12 (20): 3368. https://doi.org/10.3390/rs12203368.
- Forouzanfar, M. H., A. Afshin, L. T. Alexander, H. R. Anderson, Z. A. Bhutta, S. Biryukov, M. Brauer, R. Burnett, K. Cercy, and F. J. Charlson. 2016. “Global, Regional, and National Comparative Risk Assessment of 79 Behavioural, Environmental and Occupational, and Metabolic Risks or Clusters of Risks, 1990–2015: A Systematic Analysis for the Global Burden of Disease Study 2015.” Lancet 388 (10053): 1659–1724. https://doi.org/10.1016/S0140-6736(16)31679-8.
- Fotheringham, A. S., C. Brunsdon, and M. Charlton. 2003. Geographically Weighted Regression: The Analysis of Spatially Varying Relationships. Hoboken, NJ, USA: John Wiley & Sons.
- Gao, B., W. Liu, and M. Dunford. 2014. “State Land Policy, Land Markets and Geographies of Manufacturing: The Case of Beijing, China.” Land Use Policy 36:1–12. https://doi.org/10.1016/j.landusepol.2013.06.007.
- Gao, G., S. G. Pueppke, Q. Tao, J. Wei, W. Ou, and Y. Tao. 2023. “Effect of Urban Form on PM2.5 Concentrations in Urban Agglomerations of China: Insights from Different Urbanization Levels and Seasons.” Journal of Environmental Management 327:116953. https://doi.org/10.1016/j.jenvman.2022.116953.
- Gong, P., B. Chen, X. Li, H. Liu, J. Wang, Y. Bai, J. Chen, X. Chen, L. Fang, and S. Feng. 2020. “Mapping Essential Urban Land Use Categories in China (EULUC-China): Preliminary Results for 2018.” Science Bulletin 65 (3): 182–187. https://doi.org/10.1016/j.scib.2019.12.007.
- Guan, X., H. Wei, S. Lu, Q. Dai, and H. Su. 2018. “Assessment on the Urbanization Strategy in China: Achievements, Challenges and Reflections.” Habitat International 71:97–109. https://doi.org/10.1016/j.habitatint.2017.11.009.
- Han, L. 2018. “Relation Ship Between Urbanization and Urban Air Quality: An Insight on Fine Particulate Dynamics in China.” Progress in Geography (In Chinese) 37 (8): 1011–1021. https://doi.org/10.18306/dlkxjz.2018.08.001.
- Han, L., W. Zhou, S. T. A. Pickett, W. Li, and L. Li. 2016. “An Optimum City Size? The Scaling Relationship for Urban Population and Fine Particulate (PM2.5) Concentration.” Environmental Pollution 208:96–101. https://doi.org/10.1016/j.envpol.2015.08.039.
- He, B., L. Ding, and D. Prasad. 2019. “Enhancing Urban Ventilation Performance Through the Development of Precinct Ventilation Zones: A Case Study Based on the Greater Sydney, Australia.” Sustainable Cities and Society 47:101472. https://doi.org/10.1016/j.scs.2019.101472.
- Jabareen, Y. R. 2006. “Sustainable Urban Forms: Their Typologies, Models, and Concepts.” Journal of Planning Education & Research 26 (1): 38–52. https://doi.org/10.1177/0739456X05285119.
- Jiao, L., L. Mao, and Y. Liu. 2015. “Multi-Order Landscape Expansion Index: Characterizing Urban Expansion Dynamics.” Landscape and Urban Planning 137:30–39. https://doi.org/10.1016/j.landurbplan.2014.10.023.
- Kahn, R., P. Banerjee, and D. McDonald. 2001. “Sensitivity of Multiangle Imaging to Natural Mixtures of Aerosols Over Ocean.” Journal of Geophysical Research Atmospheres 106 (D16): 18219–18238. https://doi.org/10.1029/2000JD900497.
- Krehl, A., S. Siedentop, H. Taubenböck, and M. Wurm. 2016. “A Comprehensive View on Urban Spatial Structure: Urban Density Patterns of German City Regions.” ISPRS International Journal of Geo-Information 5 (6): 76. https://doi.org/10.3390/ijgi5060076.
- Kuang, W., J. Liu, Z. Zhang, D. Lu, and B. Xiang. 2013. “Spatiotemporal Dynamics of Impervious Surface Areas Across China During the Early 21st Century.” Chinese Science Bulletin 58 (14): 1691–1701. https://doi.org/10.1007/s11434-012-5568-2.
- Larkin, A., A. V. Donkelaar, J. A. Geddes, R. V. Martin, and P. Hystad. 2016. “Relationships Between Changes in Urban Characteristics and Air Quality in East Asia from 2000 to 2010.” Environmental Science & Technology 50 (17): 9142–9149. https://doi.org/10.1021/acs.est.6b02549.
- Leffel, B., N. Tavasoli, B. Liddle, K. Henderson, and S. Kiernan. 2022. “Metropolitan Air Pollution Abatement and Industrial Growth: Global Urban Panel Analysis of PM10, PM2.5, NO2 and SO2.” Environmental Sociology 8 (1): 94–107. https://doi.org/10.1080/23251042.2021.1975349.
- Liang, L., and P. Gong. 2020. “Urban and Air Pollution: A Multi-City Study of Long-Term Effects of Urban Landscape Patterns on Air Quality Trends.” Scientific Reports 10 (1): 18618. https://doi.org/10.1038/s41598-020-74524-9.
- Li, G., C. Fang, S. Wang, and S. Sun. 2016. “The Effect of Economic Growth, Urbanization, and Industrialization on Fine Particulate Matter (PM2.5) Concentrations in China.” Environmental Science & Technology 50 (21): 11452–11459. https://doi.org/10.1021/acs.est.6b02562.
- Lim, C., J. Ryu, Y. Choi, S. Jeon, and W. Lee. 2020. “Understanding Global PM2.5 Concentrations and Their Drivers in Recent Decades (1998–2016).” Environment International 144:106011. https://doi.org/10.1016/j.envint.2020.106011.
- Li, T., H. Shen, Q. Yuan, and L. Zhang. 2020. “Geographically and Temporally Weighted Neural Networks for Satellite-Based Mapping of Ground-Level PM2.5.” Isprs Journal of Photogrammetry & Remote Sensing 167:178–188. https://doi.org/10.1016/j.isprsjprs.2020.06.019.
- Li, T., H. Shen, Q. Yuan, X. Zhang, and L. Zhang. 2017. “Estimating Ground‐Level PM2.5 by Fusing Satellite and Station Observations: A Geo‐Intelligent Deep Learning Approach.” Geophysical Research Letters 44 (23): 985–993. https://doi.org/10.1002/2017GL075710.
- Liu, Y., L. He, W. Qin, A. Lin, and Y. Yang. 2021. “The Effect of Urban Form on PM2.5 Concentration: Evidence from china’s 340 Prefecture-Level Cities.” Remote Sensing 14 (1): 7. https://doi.org/10.3390/rs14010007.
- Liu, M., R. K. Saari, G. Zhou, J. Li, L. Han, and X. Liu. 2021. “Recent Trends in Premature Mortality and Health Disparities Attributable to Ambient PM2.5 Exposure in China: 2005–2017.” Environmental Pollution 279:116882. https://doi.org/10.1016/j.envpol.2021.116882.
- Li, T., Q. Yang, Y. Wang, and J. Wu. 2023. “Joint Estimation of PM2.5 and O3 Over China Using a Knowledge-Informed Neural Network.” Geoscience Frontiers 14 (2): 101499. https://doi.org/10.1016/j.gsf.2022.101499.
- Li, F., and T. Zhou. 2019. “Effects of Urban Form on Air Quality in China: An Analysis Based on the Spatial Autoregressive Model.” Cities 89:130–140. https://doi.org/10.1016/j.cities.2019.01.025.
- Lu, B., Y. Hu, D. Murakami, C. Brunsdon, A. Comber, M. Charlton, and P. Harris. 2022. “High-Performance Solutions of Geographically Weighted Regression in R.” Geo-Spatial Information Science 25 (4): 536–549. https://doi.org/10.1080/10095020.2022.2064244.
- Lu, J., B. Li, H. Li, and A. Al-Barakani. 2021. “Expansion of City Scale, Traffic Modes, Traffic Congestion, and Air Pollution.” Cities 108:102974. https://doi.org/10.1016/j.cities.2020.102974.
- Maji, K. J., W. Ye, M. Arora, and S. M. S. Nagendra. 2018. “PM2.5-related Health and Economic Loss Assessment for 338 Chinese Cities.” Environment international 121:392–403. https://doi.org/10.1016/j.envint.2018.09.024.
- Mo, Y., D. Booker, S. Zhao, J. Tang, H. Jiang, J. Shen, D. Chen, J. Li, K. C. Jones, and G. Zhang. 2021. “The Application of Land Use Regression Model to Investigate Spatiotemporal Variations of PM2.5 in Guangzhou, China: Implications for the Public Health Benefits of PM2.5 Reduction.” Science of the Total Environment 778:146305. https://doi.org/10.1016/j.scitotenv.2021.146305.
- Park, S., J. Lee, J. Im, C. Song, M. Choi, J. Kim, S. Lee, R. Park, S. Kim, and J. Yoon. 2020. “Estimation of Spatially Continuous Daytime Particulate Matter Concentrations Under All Sky Conditions Through the Synergistic Use of Satellite-Based AOD and Numerical Models.” Science of the Total Environment 713:136516. https://doi.org/10.1016/j.scitotenv.2020.136516.
- Pérez, N., J. Pey, M. Cusack, C. Reche, X. Querol, A. Alastuey, and M. Viana. 2010. “Variability of Particle Number, Black Carbon, and PM10, PM2.5, and PM1 Levels and Speciation: Influence of Road Traffic Emissions on Urban Air Quality.” Aerosol Science and Technology 44 (7): 487–499. https://doi.org/10.1080/02786821003758286.
- Qi, G., Z. Wang, L. Wei, and Z. Wang. 2022. “Multidimensional Effects of Urbanization on PM2.5 Concentration in China.” Environmental Science and Pollution Research 29 (51): 77081–77096. https://doi.org/10.1007/s11356-022-21298-4.
- She, Q., X. Peng, Q. Xu, L. Long, N. Wei, M. Liu, W. Jia, T. Zhou, J. Han, and W. Xiang. 2017. “Air Quality and Its Response to Satellite-Derived Urban Form in the Yangtze River Delta, China.” Ecological Indicators 75:297–306. https://doi.org/10.1016/j.ecolind.2016.12.045.
- Shi, K., Y. Li, Y. Chen, L. Li, and C. Huang. 2019. “How Does the Urban form-PM2.5 Concentration Relationship Change Seasonally in Chinese Cities? A Comparative Analysis Between National and Urban Agglomeration Scales.” Journal of Cleaner Production 239:118088. https://doi.org/10.1016/j.jclepro.2019.118088.
- Shi, K., J. Shen, L. Wang, M. Ma, and Y. Cui. 2020. “A Multiscale Analysis of the Effect of Urban Expansion on PM2.5 Concentrations in China: Evidence from Multisource Remote Sensing and Statistical Data.” Building & Environment 174:106778. https://doi.org/10.1016/j.buildenv.2020.106778.
- Tao, Y., Z. Zhang, W. Ou, J. Guo, and S. G. Pueppke. 2020. “How Does Urban Form Influence PM2.5 Concentrations: Insights from 350 Different-Sized Cities in the Rapidly Urbanizing Yangtze River Delta Region of China, 1998–2015.” Cities 98:102581. https://doi.org/10.1016/j.cities.2019.102581.
- Taubenböck, H., M. Wurm, C. Geiß, S. Dech, and S. Siedentop. 2019. “Urbanization Between Compactness and Dispersion: Designing a Spatial Model for Measuring 2D Binary Settlement Landscape Configurations.” International Journal of Digital Earth 12 (6): 679–698. https://doi.org/10.1080/17538947.2018.1474957.
- Wang, G., and L. Gai. 2021. “Spatio-Temporal Variability of PM2.5 Concentrations and Their Relationship with Impervious Surface Expansion in the Beijing-Tianjin-Hebei Region, China.” 28th International Conference on Geoinformatics, Nanchang, China, November, 1–9. https://doi.org/10.1109/IEEECONF54055.2021.9687507.
- Wei, G., P. Sun, S. N. Jiang, Y. Shen, B. Liu, Z. Zhang, and X. Ouyang. 2021. “The Driving Influence of Multi-Dimensional Urbanization on PM2.5 Concentrations in Africa: New Evidence from Multi-Source Remote Sensing Data, 2000–2018.” International Journal of Environmental Research and Public Health 18 (17): 9389. https://doi.org/10.3390/ijerph18179389.
- World Health Organization. 2018. Ambient Air Pollution: Health Impacts. Geneva, Switzerland.
- Wu, Y., Q. Zhan, S. J. Quan, Y. Fan, and Y. Yang. 2021. “A Surrogate-Assisted Optimization Framework for Microclimate-Sensitive Urban Design Practice.” Building & Environment 195:107661. https://doi.org/10.1016/j.buildenv.2021.107661.
- Wu, J., H. Zheng, F. Zhe, W. Xie, and J. Song. 2018. “Study on the Relationship Between Urbanization and Fine Particulate Matter (PM2.5) Concentration and Its Implication in China.” Journal of Cleaner Production 182:872–882. https://doi.org/10.1016/j.jclepro.2018.02.060.
- Xie, C., J. Guo, L. Yan, R. Jiang, A. Liang, and S. Che. 2022. “The Influence of Plant Morphological Structure Characteristics on PM2.5 Retention of Leaves Under Different Wind Speeds.” Urban Forestry & Urban Greening 71:127556. https://doi.org/10.1016/j.ufug.2022.127556.
- Yang, J., and X. Huang. 2021. “30 M Annual Land Cover and Its Dynamics in China from 1990 to 2019.” Earth System Science Data Discussions 2021:1–29. https://doi.org/10.5194/essd-2021-7.
- Yang, J., B. Shi, Y. Zheng, Y. Shi, and G. Xia. 2020. “Urban Form and Air Pollution Disperse: Key Indexes and Mitigation Strategies.” Sustainable Cities and Society 57:101955. https://doi.org/10.1016/j.scs.2019.101955.
- Yang, Q., Q. Yuan, and T. Li. 2022. “Ultrahigh-Resolution PM2.5 Estimation from Top-Of-Atmosphere Reflectance with Machine Learning: Theories, Methods, and Applications.” Environmental Pollution 306:119347. https://doi.org/10.1016/j.envpol.2022.119347.
- Yin, S., T. Li, X. Cheng, and J. Wu. 2022. “Remote Sensing Estimation of Surface PM2.5 Concentrations Using a Deep Learning Model Improved by Data Augmentation and a Particle Size Constraint.” Atmospheric Environment 287:119282. https://doi.org/10.1016/j.atmosenv.2022.119282.
- Yuan, M., Y. Song, Y. Huang, H. Shen, and T. Li. 2019. “Exploring the Association Between the Built Environment and Remotely Sensed PM2.5 Concentrations in Urban Areas.” Journal of Cleaner Production 220:1014–1023. https://doi.org/10.1016/j.jclepro.2019.02.236.
- Yu, C., L. D. Girolamo, L. Chen, X. Zhang, and Y. Liu. 2015. “Statistical Evaluation of the Feasibility of Satellite-Retrieved Cloud Parameters As Indicators of PM2.5 Levels.” Journal of Exposure Science & Environmental Epidemiology 25 (5): 457–466. https://doi.org/10.1038/jes.2014.49.
- Zeng, C., A. Zhang, and S. Xu. 2016. “Urbanization and Administrative Restructuring: A Case Study on the Wuhan Urban Agglomeration.” Habitat International 55:46–57. https://doi.org/10.1016/j.habitatint.2016.02.006.
- Zhang, F., Z. Wang, H. Cheng, X. Lv, W. Gong, X. Wang, and G. Zhang. 2015. “Seasonal Variations and Chemical Characteristics of PM2.5 in Wuhan, Central China.” Science of the Total Environment 518:97–105. https://doi.org/10.1016/j.scitotenv.2015.02.054.
- Zhang, D., C. Zhou, and B. He. 2022. “Spatial and Temporal Heterogeneity of Urban Land Area and PM2.5 Concentration in China.” Urban Climate 45:101268. https://doi.org/10.1016/j.uclim.2022.101268.
- Zhan, Q., C. Yang, and H. Liu. 2024. “How Do Greenspace Landscapes Affect PM2.5 Exposure in Wuhan? Linking Spatial-Nonstationary, Annual Varying, and Multiscale Perspectives.” Geo-Spatial Information Science 27 (1): 95–110. https://doi.org/10.1080/10095020.2022.2085187.
- Zhao, L., T. Li, A. Przybysz, Y. Guan, P. Ji, B. Ren, and C. Zhu. 2021. “Effect of Urban Lake Wetlands and Neighboring Urban Greenery on Air PM10 and PM2.5 Mitigation.” Building & Environment 206:108291. https://doi.org/10.1016/j.buildenv.2021.108291.
- Zhao, X., W. Zhou, L. Han, and D. Locke. 2019. “Spatiotemporal Variation in PM2.5 Concentrations and Their Relationship with Socioeconomic Factors in China’s Major Cities.” Environment International 133:105145. https://doi.org/10.1016/j.envint.2019.105145.
- Zhao, X., W. Zhou, T. Wu, and L. Han. 2022. “The Impacts of Urban Structure on PM2.5 Pollution Depend on City Size and Location.” Environmental Pollution 292:118302. https://doi.org/10.1016/j.envpol.2021.118302.
- Zhou, Y., H. Liu, J. Zhou, and M. Xia. 2019. “GIS-Based Urban Afforestation Spatial Patterns and a Strategy for PM2.5 Removal.” Forests 10 (10): 875. https://doi.org/10.3390/f10100875.
- Zuo, J., C. Li, and J. Dong. 2018. “Green Space System Planning Practices of Multidimensional Network Construction in High-Density Areas Under the Coexistence Trend of Incremental Planning and Existing Stock Planning.” In Green City Planning and Practices in Asian Cities: Sustainable Development and Smart Growth in Urban Environments, edited by Z. Shen, L. Huang, K. H. Peng, and J. Pai, 175–191. Cham, Switzerland: Springer.