
 ?Mathematical formulae have been encoded as MathML and are displayed in this HTML version using MathJax in order to improve their display. Uncheck the box to turn MathJax off. This feature requires Javascript. Click on a formula to zoom.
ABSTRACT
Ecosystems at the southern edge of the permafrost distribution are highly sensitive to global warming. Changes in soil freeze-thaw cycles can influence vegetation growth in permafrost regions. Extant studies mainly focused on analyzing the differences of vegetation dynamics in different permafrost regions. However, the intrinsic drivers of permafrost degradation on vegetation growth remain elusive yet. Based on the top temperature of permafrost (TTOP) model, we simulated the spatial distribution of permafrost in Northeast China (NEC) from 2001 to 2020. Using the data of the vegetation Net Primary Productivity (NPP), vegetation phenology, climate and permafrost phenology, and analytical methods including partial correlation, multiple linear regression, and path analysis, we explored the response of vegetation growth and phenology to soil freeze-thaw changes and climate change under different degrees of permafrost degradation. Overall, the start date of the growing season (SOS) was very sensitive to the start date of soil thaw (SOT) changes, and multiple regression analyses showed that SOT was the main factor influencing SOS in 41.8% of the NEC region. Climatic factors remain the main factors affecting vegetation NPP in NEC, and the results of partial correlation analysis showed that only 9.7% of the regional duration of soil thaw (DOT) had a strong correlation with vegetation NPP. Therefore, we determined the mechanism responsible for the soil freeze-thaw changes and vegetation growth relationship using the path analysis. The results indicated that there is a potential inhibitory effect of persistent permafrost degradation on vegetation growth. Our findings would contribute to the improvement of process-based models of forest dynamics in the boreal region, which would help to plan sustainable development and conservation strategies in permafrost areas.
1. Introduction
The Northern Hemisphere, contributing to about 40% of the global terrestrial carbon sink, plays a critical role in ameliorating the effects of global warming (Friedlingstein et al. Citation2022; Myneni et al. Citation2001; Sitch et al. Citation2015). Permafrost covers approximately 25% of the land area in the Northern Hemisphere, and nearly 80% of boreal and hemi-boreal vegetation exists on permafrost (Helbig, Pappas, and Sonnentag Citation2016). With global warming, significant degradation of permafrost in the Northern Hemisphere has occurred, leading to substantial releases of soil carbon, including carbon dioxide and methane (Biskaborn et al. Citation2019; Miner et al. Citation2021; Wang et al. Citation2020). This greatly affects the stability of permafrost ecosystems and the global carbon cycle (Chang et al. Citation2024; Hugelius et al. Citation2014).
With the rising of the permafrost temperature, a deepening of the permafrost active layer and a sharp decrease in the extent of permafrost occurs (Zimov, Schuur, and Chapin Citation2006). The soil freeze-thaw cycle has significantly changed due to permafrost degradation, which has greatly impacted the vegetation growth and ecosystem carbon uptake by affecting soil hydrothermal properties (Jin et al. Citation2021; Piao et al. Citation2015; Shen et al. Citation2022; Zhang et al. Citation2021a), amplifying the vegetation sensitivity to permafrost hydrologic dynamics and soil nutrients (Keuper et al. Citation2012; Walvoord and Kurylyk Citation2016). For example, Peng et al. (Citation2022) found the differences of sensitivity in different rooted vegetation growth with the soil water changes caused by permafrost degradation. Earlier soil thawing may alter the hydrothermal conditions required for vegetation growth, Wang and Liu (Citation2022) and Wang et al. (Citation2022) discovered that vegetation phenology was more responsive to permafrost degradation than to direct climate change in high latitudes. Changes in vegetation phenology play an important role in regulating vegetation growth and carbon dynamics (Piao et al. Citation2019; Salas Citation2021). From previous studies, in the early stages of permafrost thaw, the thawed permafrost provided additional moisture for tree growth, which could be beneficial for vegetation growth throughout the growing season (Kim et al. Citation2012; Peng et al. Citation2020). However, the early onset of soil thaw may result in excessive water use during the early stages of vegetation growth in the spring, leading to water deficit conditions later in the growing season and inhibiting the vegetation growth (Buermann et al. Citation2013; Lian et al. Citation2020; Wang et al. Citation2022). Moreover, with the further degradation of the permafrost, the infiltration of soil moisture was accelerated, which resulted in the drying of the soil surface layer, and limited vegetation growth (Jin et al. Citation2022). It has been observed that there are differences in vegetation growth between various permafrost types (Hu, Nan, and Ji Citation2022; Mao et al. Citation2015). Hence, the effects of permafrost degradation on vegetation dynamics are spatially and temporally heterogeneous. Permafrost degradation in various regions can lead to localized changes in environmental conditions, resulting in complex and noteworthy effects on regional vegetation growth. These effects are determined by the varying degrees of permafrost thaw, and the specific mechanisms underlying the impact of these thaw levels on vegetation growth are yet to be fully elucidated.
Northeast China (NEC) is situated in the mid-high latitudes region of the Northern Hemisphere, positioned at the southern boundary of the high-latitude permafrost zone of the Eurasian continent. It encompasses a transitional type of high-latitude, high-elevation perennial permafrost and encompasses various permafrost types. Notably, NEC stands as a prominent site of perennial permafrost degradation globally. Studies focusing on the interaction between permafrost degradation and vegetation dynamics in NEC have grown increasingly. Guo et al. (Citation2017) correlated surface temperature and normalized difference vegetation index (NDVI) data from 1981–2014, revealing positive effects of permafrost degradation on plant growth and activity. Wen et al. (Citation2021) demonstrated prolonged vegetation growing seasons in stable permafrost versus unstable areas. Che et al. (Citation2023) also observed varied vegetation phenology and NDVI among the NEC’s permafrost zones. Despite these endeavors, our understanding of the mechanisms of vegetation growth and phenological effects of the extent of permafrost degradation across the NEC is still inadequate and needs to be explored more deeply using the latest observational data and more appropriate analytical methods.
The study aims to investigate the internal response mechanisms through which permafrost degradation affects vegetation growth across the NEC. This study utilizes the latest datasets spanning the last two decades, covering vegetation, climatic conditions, and soil freeze-thaw dynamics. The top of permafrost (TTOP) model was employed to delineate permafrost zones, facilitating the identification of permafrost with varying degrees of degradation. The study has the following objectives: (a) to analyze spatiotemporal changes in permafrost degradation, vegetation growth, and phenology from 2001 to 2020 across the NEC region; (b) to quantify the impacts of permafrost degradation on vegetation growth and phenology; and (c) to reveal the internal response mechanisms of different degrees of permafrost degradation on vegetation growth.
2. Material and method
2.1. Study area
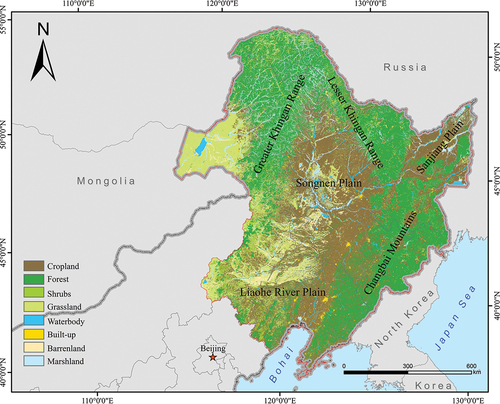
Northeast China (NEC) encompasses the Greater Khingan Mountains, the Lesser Khingan Mountains, Changbai Mountains, Sanjiang Plain, Songnen Plain, and Liaohe River Plain. The distribution of vegetation types closely correlates with the topography. Coniferous forests dominate the northern part of the Greater Khingan region, while the Lesser Khingan Mountains and Changbai Mountains feature mixed forests of conifers and broad-leaved trees. Mountain slopes in the western and southwestern Greater Khingan Mountains are characterized by grasslands and meadows, interspersed with shrubs in the forest transition zone. The coexistence of forests, grasslands, and croplands results in a mosaic of fragmented land use patterns. Permafrost and seasonally frozen ground are widespread in NEC (Ran et al. Citation2012). Vegetation cover and subsurface distribution exert a strong influence on the spatial distribution of hydrothermal processes and permafrost. Given the specific geographical location and fragmented land use distribution, the region is highly susceptible to the impacts of climate change.
Figure 1. Location and land-use type of study area. The land-use type map is delineated by Xu et al. (Citation2018).
2.2. Datasets
2.2.1. Vegetation phenology datasets
The Land Cover Dynamics product (MCD12Q2) for the NEC region was obtained from the moderate resolution imaging spectroradiometer (MODIS) dataset, covering the period from 2001 to 2020, with a spatial resolution of 500 m and a yearly temporal resolution. The MCD12Q2 Version 6.1 data (https://lpdaac.usgs.gov/products/mcd12q2v061/) product as the only available one of long-term satellite-derived vegetation phenology, has been widely used for vegetation phenology monitoring at regional and global scales. Studies using MCD12Q2 to extract vegetation SOS and EOS have demonstrated the reliability of this dataset in vegetation phenology studies (Bolton et al. Citation2020; Chen, Yang, and Du Citation2022; Zhang et al. Citation2021b). We extracted “Greenup_1”, and “Dormancy_1” band data separately as the start date of the growing season (SOS) and the end date of the growing season (EOS). All data were resampled to 1 km using the NEAREST method to match other climate datasets.
2.2.2. Satellite NPP dataset
Net primary productivity (NPP), representing the net carbon assimilation by vegetation within a defined time frame, is commonly utilized to describe vegetation growth and carbon sequestration potential (Li et al. Citation2022a; Mao et al. Citation2015; Qiao and Xia Citation2024). Annual NPP data (MOD17A3HGF.006) were acquired using the Google Earth Engine (GEE) platform at a pixel resolution of 500 m. MOD17A3HGF version 6.0 data is an improved product of MOD17A3, which is based on the BIOME-BGC model and light energy utilization model. It simulates NPP values using the new Biological Properties Questionnaire (BPLUT) and the new version of the Global Model and Fusion Office (GMAO) daily meteorological data to further improve the accuracy of NPP estimation. This dataset has been validated and applied in studies in different regions of the world (Ge et al. Citation2021; Li et al. Citation2023; Venter et al. Citation2021). In this study, the NPP dataset was directly resampled to within 1 km for analysis, using the Nearest Neighbor interpolation.
2.2.3. 2.2.3. Climate datasets
In this study, a monthly temperature and precipitation dataset with a resolution of 1 km was collected for the period 2001–2020 (Peng et al. Citation2019), which was derived from the National Earth System Science Data Center, National Science & Technology Infrastructure of China (http://loess.geodata.cn). The dataset was assessed using observations gathered from 496 meteorological stations across China spanning the years from 1901 to 2021, yielding reliable outcomes. Several studies used these datasets to explore the relationships between vegetation phenology and NPP changes with climate (Ge et al. Citation2022; Zhang et al. Citation2022). We used pre-growing season (March-May) mean data to produce preseason temperature (psTmp) and preseason precipitation (psPre), and used the same method to generate growing season temperature (GrTmp) and growing season precipitation (GrPre) using growing season (June – August) mean data.
2.2.4. Soil freeze-thaw datasets
In this study, the variability of soil moisture content was characterized and the near-surface soil freezing state was retrieved using the monthly timescale ERA5-land layer 1 (0–7 cm depth) soil moisture product and the daily timescale ERA5-land layer 1 (0–7 cm depth) soil temperature product, respectively. The dataset was obtained from the European Centre for Medium-Range Weather Forecasting (ECMWF) (https://cds.climate.copernicus.eu/cdsapp#!/dataset/reanalysis-era5-land?tab=form). Many scholars have conducted studies on global changes using ERA5-Land products (Y. Liu and Yang Citation2022; Xing et al. Citation2021). To standardize the spatial resolution, we acquired the ASTER Global Digital Elevation Model Version 3 (ASTGTMv003) (https://lpdaac.usgs.gov/products/astgtmv003/) digital elevation data from the corresponding period. This data was utilized as auxiliary input to preprocess the ERA5-Land data. Subsequently, we used a Nearest Neighbor interpolation method to change its spatial resolution to 1 km. In addition, the study used a daily 1-km all-weather land surface temperature dataset (Zhou et al. Citation2017, Citation2021) for the Chinese landmass (TRIMS LST) from the A Big Earth Data Platform for Three Poles (http://poles.tpdc.ac.cn/en/) to estimate permafrost area.
2.3. Methods
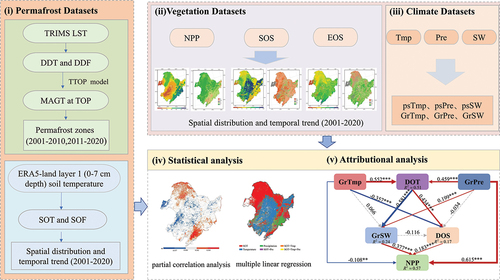
To investigate the impacts of various permafrost thawing extents on vegetation growth, we employed surface temperature data to delineate permafrost zones and determine soil freezing and thawing occurrences. Utilizing correlation and attributional analysis, the factors influencing vegetation growth were examined ().
Figure 2. Flow diagram of the permafrost degradation on vegetation growth in NEC.
2.3.1. Division of the near-surface soil freeze/thaw
A significant alteration of the soil freeze-thaw cycle is a primary indicator of permafrost degradation (Smith et al. Citation2022). To reveal the spatial pattern of near-surface soil freezing and thawing conditions, the study used 0–7 cm soil temperature data to monitor near-surface soil freezing and thawing conditions. In the permafrost thawing period (January – June), the start date of soil thaw (SOT) was determined as the first day of a consecutive 5-day interval with daily soil temperatures remaining above 0°C, using a temporal threshold of 5 days (Wang and Liu Citation2022). Similarly, in the permafrost freezing period (September-December), the start date of soil freezing (SOF) was identified as the first day of a continuous 5-day span with daily soil temperatures consistently below 0°C (Kim et al. Citation2012, Citation2017). The duration of soil thaw (DOT) was calculated from the difference between SOT and SOF. In the following study, we employed long-term monitoring data for SOT, SOF, and DOT as monitoring soil freeze-thaw cycle data. These parameters served as key factors in investigating the impact of permafrost degradation on vegetation growth.
2.3.2. Defining the permafrost zone
We implemented the “space-for-time substitution” (SFTS) approach to assess the impact of different levels of permafrost degradation on vegetation growth. This method involves replacing the temporal analysis of permafrost degradation with the spatial sequence of continuous permafrost zone-unstable permafrost zone-seasonally frozen ground. SFTS serves as an efficient alternative to traditional long-term observations, enabling quick and effective predictions of environmental responses to anticipated climate change (Pickett Citation1989). Its primary benefit lies in utilizing existing data from various geographic regions, which minimizes the need for prolonged data collection. Consequently, SFTS has become a widely accepted methodology in environmental research, particularly valuable in projects constrained by limited time and resources (Lovell et al. Citation2023). To simulate the spatial evolution of frozen soil classifications from 2001 to 2020, considering the influence of the land surface temperature (LST) on soil freeze-thaw dynamics and the suitability of the model and dataset, the TTOP model was selected to replicate the distribution of permafrost (Li et al. Citation2022a; Zou et al. Citation2017). There are already studies using field measurement data to prove that the results of the permafrost distribution map in NEC based on the TTOP model are reliable(Che, Zhang, and Wan Citation2023; Li et al. Citation2022a). The TTOP model is expressed as:
where rk represents the ratio of thermal conductivity within the active layer during soil thawing and freezing, while the variable P represents the duration in days (365 days). We used the remote sensing monitoring dataset concerning Land Use and Land Cover in China (CN-LUCC) for the years 2005 and 2015. This dataset was provided by the National Resources and Environment Database of the Chinese Academy of Sciences (Xu et al. Citation2018) with a spatial resolution of 1 km and assigned rk coefficients for different landcover classes with reference to Obu et al., (Citation2019). (landcover data were from: https://www.resdc.cn/) (). DDT (degree-days of thaw) and DDF (degree-days of freeze) are the thawing and freezing indices (◦C-day), respectively:
where the symbol p is the period (365 days). The LST is derived from daily land temperature data in the TRIMS LST dataset. The TTOP model simulation results were validated against data from 33 borehole collections, derived from previous studies, as detailed in .
Table 1. List of rk factors assigned to landcover class groups and CN-LUCC landcover classes.
Table 2. Borehole data (Che, Zhang, and Wan Citation2023; Li et al. Citation2022b) and model inversion data.
2.3.3. Statistical analysis
Vegetation growth was influenced by a variety of factors that were covariant across spatial and temporal scales due to interactions between these factors, which makes analyzing the effects of permafrost degradation in isolation difficult. The partial correlation analysis was used to examine the response of vegetation NPP and phenology to soil freeze-thaw variation by controlling the temperature, and precipitation. In addition, we examined temporal trends of vegetation NPP, vegetation phenology, and soil freeze-thaw in the last two decades (2001–2020) using the Theil-Sen slope estimator and Mann-Kendall trend test (p < 0.05).
To further quantify the effects of permafrost degradation and compare the influences of multifactor on vegetation NPP and phenology, this study used multiple linear regression to determine the sensitivities of vegetation-related dynamics to each factor (Fu et al. Citation2015; Wang and Liu Citation2022). We normalized each factor before entering it into the regression model and identified the regression coefficients as sensitivities (SV). The multiple linear regression was adopted for the analysis of (1) annual mean NPP was set as the dependent variable, with growing season temperature (GrTmp), growing season precipitation (GrPre), and the DOT as the input variables, and (2) the SOS was set as the dependent variable, with preseason temperature (psTmp), preseason precipitation (psPre) and the SOT were set as independent variables. For pixels that passed the regression significance test (t-test, p < 0.05), the independent variable with the highest absolute value of sensitivity indicates the primary factor influencing variations in vegetation NPP and phenology variations.
2.3.4. Attributional analysis
To better investigate the mechanism of permafrost degradation on vegetation growth, we employed path analysis, a commonly employed multivariate statistical method. This approach elucidates both direct and indirect relationships among variables, thereby uncovering influences and mechanisms within intricate systems to facilitate hypothesis testing (Fan et al. Citation2016; Lian et al. Citation2021; Shen et al. Citation2022). Several paths were designed, considering soil water and vegetation growing season duration, to analyze potential linkages between DOT and NPP. We randomly selected three hundred points in the permafrost zone, unstable permafrost zone, and seasonally frozen ground, respectively, and established a structural equation model (SEM) for the relationship between GrTmp, GrPre, DOT, GrSW, DOS, and NPP. Regional averages and standard errors were used as coefficients and uncertainties for each subpath. The model fit was assessed using d-separation tests and AIC scores derived from Fisher’s C statistics (Shipley Citation2013).
3. Results
3.1. Distribution and changes of Permafrost in Northeast China
The correlation of the TTOP model simulation results validated by the study using actual borehole measurements is 0.54. The main reason for the poor correlation may be caused by the large time horizon of the borehole data collection. The TTOP modeled distribution of permafrost over NEC for the periods 2001–2010 and 2011–2020 are shown in ). Since the degradation of permafrost was slow and gradual, the study was carried out in the scale of 10 years. The examination revealed a prominent pattern of permafrost degradation, with a decline observed from 2001 to 2010, followed by an increase from 2011 to 2020. We identified the region where the change happened as the unstable permafrost zone by comparing the permafrost distribution maps of the two periods (). We identified that 32.4 × 10³ km2 of the permafrost and 44.4 × 10³ km2 of the seasonally frozen ground as unstable permafrost. The spatial shift in permafrost condition is particularly noticeable along the southern boundary of the Greater Khingan and the Lesser Khingan Mountains.
Figure 3. Permafrost zoning and spatial distribution of multi-year means and trends of soil freezing and thawing indices. PF, SFG, and DPF indicate permafrost zone, seasonally frozen ground, and permafrost degradation zone, respectively. SD, NSD, NSI, and SI indicate significant decreases, non-significant decreases, non-significant increases, and significant increases, respectively.
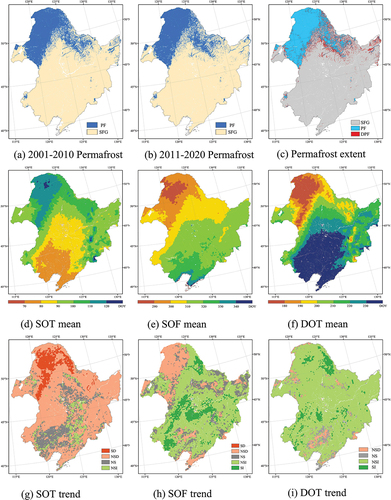
We observed from ) a clear gradient distribution of multi-year average SOT, SOF, and DOT along latitude. Multi-year average SOT generally increased with increasing latitude. Later SOT was observed in the permafrost zone, with a mean value of the day of the year (DOY) 93.88 in the NEC region during 2001–2020 (). Approximately 81.7% of areas displayed an advanced SOT trend, whereas 9% of the areas showed a significant advanced trend (p < 0.05, , with a mean slope of −2.77 days/10a (). Conversely, the multi-year averaged SOF decreased with latitude, averaging DOY 309.4 in the NEC region during 2001–2020 (). Roughly 68.3% of the areas showed delays in SOF, with a mean value of +1.77 days/10a (). Compared with the permafrost zone, the seasonally frozen ground zone showed a strong delaying trend (). Generally, the prolonged DOT was observed in NEC (), with a mean value of DOY 215.62. We found that DOT increased in 90.7% of the regions with a mean slope of +4.43 days/10a ().
Table 3. Statistical values of multi-year averages and changes of vegetation NPP, vegetation phenology, and soil freeze-thaw indicators on the NEC and different permafrost zones.
3.2. Distribution and changes of vegetation NPP and phenology
The spatial distributions of multi-year mean vegetation NPP, and vegetation phenology (SOS, EOS), spanning the years 2001 to 2020 over the NEC, are depicted in ) based on the satellite-derived data. Forests, croplands, and grassland were the main land cover types in NEC, respectively (), with forests contributing the major NPP in the Northeast region, accounting for 40% of the total annual average NPP in NEC. The 20-year average NPP value was 406.73 gC m−2 a−1 (). Significant differences in the timing of phenology occur between the different land cover types. In general, the SOS mainly occurs between April to June. Regions dominated by forest vegetation exhibited an early SOS between the 100th and 130th DOY. This pattern was prominent in the Great Khingan Mountains, Lesser Khingan Mountains, and Changbai Mountains (). Conversely, areas with a delayed SOS, ranging from the 140th to the 160th DOY, were primarily located in Sanjiang Plain, Songnen Plain, and Liaohe Plain regions. These zones, covering the main cropland areas of the NEC, displayed heightened susceptibility to anthropogenic influences (). High-latitude forest EOS mainly occurred around DOY 270, and forests at relatively lower latitudes showed a trend of defoliation only after DOY 280. An enhanced trend from north to south was observed ().
Figure 4. Spatial distribution of multi-year averages and changes of vegetation NPP and phenology. (a) the multi-year mean of SOS, (b) the multi-year mean of EOS, (c) the multi-year mean of NPP, (d) the temporal trend of SOS, (e) the temporal trend of EOS, and (f) the temporal trend of NPP during 2001–2020 on the NEC.
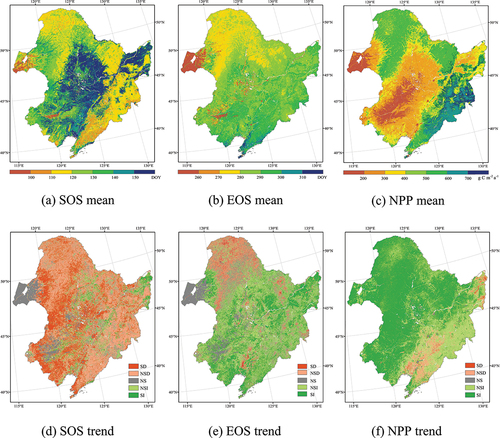
We observed spatial variations in vegetation phenology and NPP in NEC during 2001–2020 ()). Using the Theil-Sen slope estimation, we observed that the overall SOS in the northeast region showed an advancement trend, with 72.2% of the area showing a significant advancement in SOS (p < 0.05) while only 11.9% of the area showed a delay, with an average slope of −3.22 days/10a (). Nearly 63.5% of the regions showed EOS delay (p < 0.05), while the trend of EOS advancement was observed at high latitudes (), with an average slope of +2.4 days/10a (). Moreover, the NPP in 88.4% of the regions showed an increasing trend in 20 years, and only 9.5% showed a decreasing trend, mainly in Sanjiang Plain and the Liaohe River Plain, where the main vegetation type is cropland (). From the average value of the entire NEC, the NPP increased significantly at the rate of 35.45 gC m−2/10a.
3.3. Sensitivities of vegetation phenology and vegetation NPP to climate change and permafrost degradation
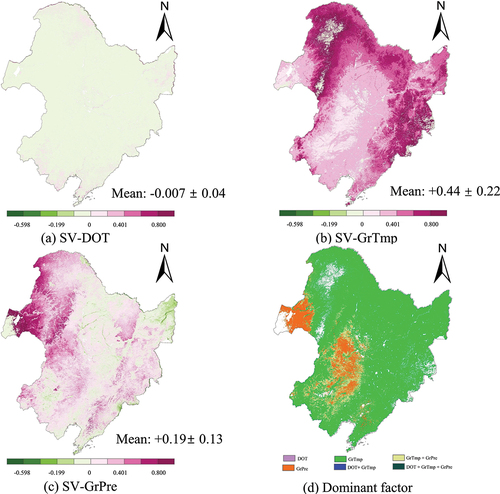
We quantified the contribution coefficients of these variables to vegetation NPP and SOS using multiple linear regression methods. The spatial average sensitivities of SOS to temperature, precipitation, and SOT were + 0.30 ± 0.27, +0.07 ± 0.24, and + 0.34 ± 0.18, respectively ()). We determined the dominant factor of pixels based on the absolute values of sensitivity (t-test, p < 0.05, . We found spatial heterogeneity in the spatial average sensitivities of SOS to SOT, temperature across different permafrost types. Overall, climatic factors dominated in 52% of the areas (temperature: 39%, precipitation: 13%), mainly in the seasonally frozen ground zone, where the land use types mainly included grassland, cropland, and forest; SOT dominated in 42% of the areas () mainly in permafrost areas, where the forest was the main land use type. It could be observed that GrPre and GrTmp were the primary dominant factors driving NPP changes in the Northeast region of the NEC, accounting for 74.6% and 8.4% of the total area, respectively (). The influence of DOT as a dominant factor was limited to only 0.09% of the NEC region, and the remaining areas observed no significant regressions (). From the distribution of SV values, it was evident that GrTmp had a positive effect on vegetation growth in almost all NEC, with higher SV values observed in forested regions (). In comparison, the impact of GrPre on NPP exhibited significant spatial heterogeneity. GrPre promoted the vegetation growth in grassland areas, primarily concentrated in the Greater Khingan Mountains, while it inhibited the vegetation growth in cultivated areas, mainly in SanJiang Plain (). Grouping regions into different land-use types showed that more than 50% of the forest, grassland, and marshland regions are dominated by SOT than by climate change. Overall, permafrost degradation dominates more than climate change in all vegetation regions, and the ratio of SOT to climate change is higher than 4 in forest, shrub, and grassland (Figure S1).
Figure 5. Sensitivities of SOS to SOT and climatic. (a) the sensitivities of SOT. (b) the sensitivities of psTmp. (c) the sensitivities of psPre. (d) Distribution of dominant factors of SOS changes.
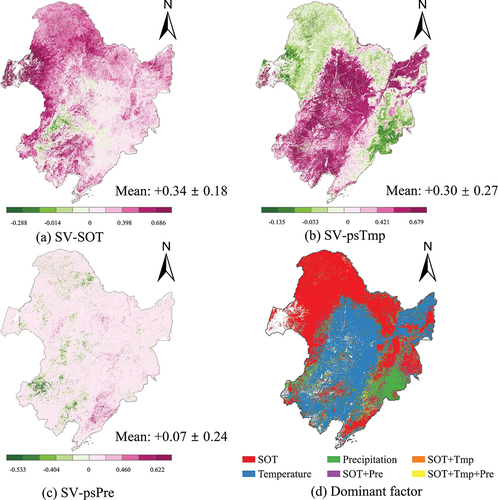
Figure 6. Sensitivities of NPP to DOT and climatic (a) the sensitivities of DOT. (b) the sensitivities of GrTmp. (c) the sensitivities of GrPre. (d) Distribution of dominant factors of NPP changes.
3.4. Vegetation NPP and phenology response to climatic and soil freeze-thaw variations
By controlling for the effects of GrTmp and GrPre, we calculated the partial correlation coefficient between NPP and DOT () to elucidate the potential impact of permafrost degradation on vegetation NPP. The results revealed that only 9.7% of the regions exhibited a strong correlation between vegetation net primary productivity and DOT (p < 0.05), with 8.37% showing a positive correlation (). Additionally, the partial correlation coefficients demonstrated evident dependencies of NPP on GrTmp and GrPre ()). Prolonging the growing season can change vegetation NPP by increasing the time vegetation spends in photosynthesis. We calculated the partial correlation coefficients of NPP with GrSW and SOS by controlling for GrTmp and GrPre, respectively. In 16.3% of the regions, NPP exhibited a significant partial positive correlation with GrSW (p < 0.05, . Furthermore, in 25.7% of the areas, NPP showed a partial negative correlation with SOS, of which 6.1% displayed a partial positive correlation mainly in grassland regions (p < 0.05, .
Figure 7. The partial correlations between vegetation and soil freeze-thaw variables.
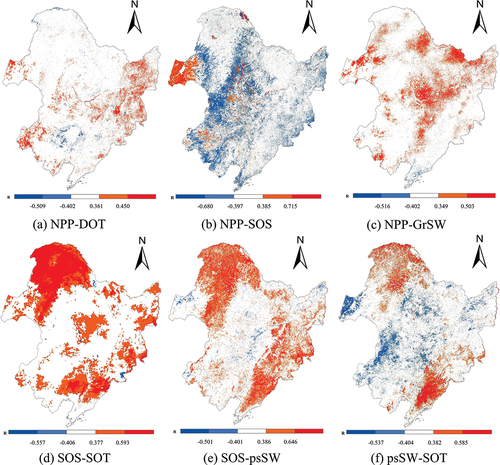
Figure 8. The partial correlations between vegetation and Climate variables.
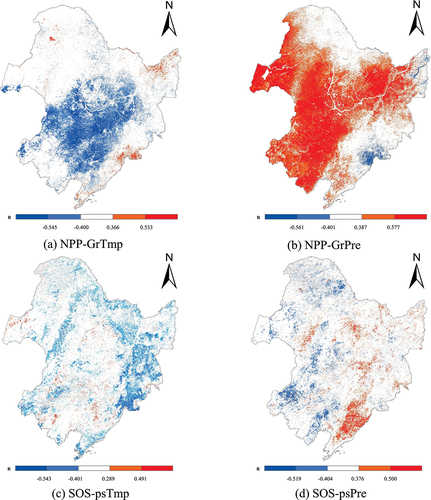
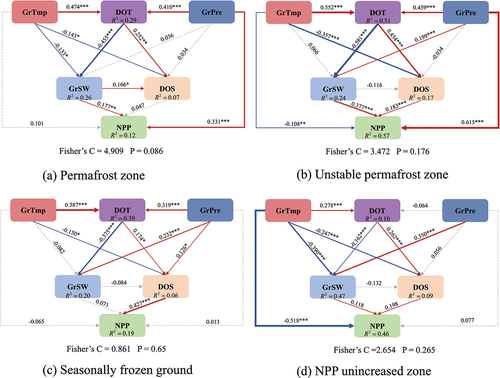
Figure 9. Path diagrams of the relationship between permafrost degradation and vegetation growth for different permafrost types. Positive correlations are indicated by red arrows and negative correlations by blue arrows. Solid and dashed lines stand for paths that are significant and insignificant, respectively. Line thickness corresponds to the strength of the correlation. Numbers on arrows are standardized path coefficients, and asterisks indicate statistical significance (***p < 0.001; **p < 0.01; *p < 0.05). R2 denotes the explanatory power of the model for the dependent variable.
To further elucidate the potential impacts of permafrost degradation on vegetation growth, we controlled for the effects of psTmp and psPre, and calculated partial correlation coefficients between vegetation phenology and psSW and SOT, respectively. We observed a significant positive partial correlation between SOS and SOT in 30.3% of the regions, (p < 0.05, . Grouping regions into different land-use types showed that more than 10% of the regions were significantly positively correlated in forest, shrub and grassland areas, with more than 50% of the regions being significantly positively correlated in forested areas (Figure S2). In addition, SOS was partially negatively correlated with psSW in 10.5% of the areas (p < 0.05, ), mainly in grasslands and croplands. The areas with a partial positive correlation of 14.2% were mainly distributed in forests (p < 0.05, . Excluding the effects of psTmp and psPre, we found a significant partial positive correlation (p < 0.05) between SOT and psSW in 39.6% of the regions, with the strongest correlation in the permafrost region (p < 0.05, . Besides, we conducted separate partial correlation analyses between SOS and climate variables. The analysis revealed that SOS exhibited a significant negative correlation with psTmp in 14.6% of the study region, particularly in Changbai Mountains area (). Only 11.7% of the regions demonstrated a significant correlation between SOS and psPre, with this correlation being more pronounced in lower latitude areas ().
3.5. Underlying mechanisms of the correlation between DOT and NPP
We employed the attribution analysis to elucidate the underlying reasons for the correlation between DOT and NPP under varying degrees of thawed permafrost conditions, aiming to ascertain the specific impacts of permafrost degradation on vegetation growth (). To extend the temporal analysis of permafrost degradation, we incorporated an additional area into the construction of our SEM. This area, located in the lower latitude seasonally frozen ground, was selected due to its lack of significant increase in vegetation NPP. Among the four zones, the lengthening of DOT had a significant inhibitory effect on GrSW and a significant promoting effect on the lengthening of DOS, which were most obvious in the unstable permafrost zone (the normalized path coefficients from DOT to GrSW and DOT to DOS were the largest, respectively). This indicates that permafrost degradation may inhibit vegetation growth by reducing soil water content and exacerbating water stress during the growing season (Allen et al. Citation2010). However, permafrost degradation can potentially extend the duration of the vegetation growing season and thereby prolong vegetation photosynthesis, further leading to an increase in vegetation NPP. Meanwhile, these effects diminish progressively with the deepening of permafrost degradation.
4. Discussion
4.1. Effects of permafrost degradation on vegetation phenology
In northern mid-high latitude permafrost regions, the rate of warming is faster compared to low-latitude and high-altitude areas (Chapin et al. Citation2005). Therefore, permafrost exhibits heightened sensitivity to climate change, exerting profound impacts on the climate and vegetation of permafrost ecosystems (Heijmans et al. Citation2022; Schuur et al. Citation2015). Existing studies have shown that permafrost degradation is an important factor affecting vegetation phenology changes in permafrost ecosystems (Wang and Liu Citation2022; Wang et al. Citation2022). Our study found an overall trend of lengthening DOS during the growing season in the NEC, although 9.7%, 11.8%, and 16.7% of the NEC showed a shortening of DOS, delay of SOS, and advance of EOS during 2001–2020, respectively. The overall spatial distribution pattern is similar to previous studies (Wang et al. Citation2020). From the results of the partial correlation analysis, it can be inferred that the direct connection between vegetation SOS and permafrost degradation may be related to the hydrology ()). Furthermore, multiple regression analysis indicates that, compared to climate factors, SOT is the dominant controlling factor for the timing of SOS in the NEC (). The transition from frozen to thawed permafrost directly impacts soil water dynamics and nutrient availability, thereby influencing the biochemical processes affecting vegetation growth (Jin et al. Citation2021). Our findings confirm that advanced SOT enhances soil moisture availability (), consequently leading to further changes in SOS. Delayed SOS zones primarily occur in Sanjiang Plain and Songnen Plain, where seasonally frozen ground is predominant and cultivated land is prevalent, influenced significantly by anthropogenic factors (Chen et al Citation2022; Liu, Deng, and Liu Citation2021). In contrast, the advanced EOS area mainly occurs in the forests of the Greater Khingan, and the subsoil is mainly distributed with more stable permafrost types. Degradation of permafrost zones accelerates plant physiological activity, which allows plants to accumulate sufficient nutrients and energy earlier, which in turn contributes to an earlier onset of vegetation defoliation (Wang et al. Citation2022). In seasonally frozen ground, soil moisture and nutrients may be relatively more stable after permafrost degradation. This stability is evidenced by the low correlation between forest vegetation types and soil moisture changes due to permafrost degradation in the SFG region(Ala-Aho et al. Citation2021). Consequently, vegetation growth in the SFG zone is more affected by climatic factors and a delay in vegetation defoliation occurs (Allen et al. Citation2010; Wang et al. Citation2022).
The observed differences are likely associated with the biophysical characteristics of vegetation. In the permafrost region, vegetation predominantly comprises cold-adapted species with shallow root systems. The earlier thawing of permafrost and the prolonged growing season allow plants to accumulate nutrients and energy earlier, resulting in an advanced EOS. In the seasonally frozen ground region, vegetation includes both subarctic and temperate species, rendering it more sensitive to seasonal changes. Permafrost degradation enhances soil permeability, potentially subjecting vegetation to water stress and leading to a delayed EOS, enabling better utilization of limited water resources.
4.2. Intrinsic response of vegetation growth to permafrost degradation
Earlier studies have indicated that permafrost can regulate vegetation growth via effects on soil temperature and soil water contents (Hu, Nan, and Ji Citation2022; Li et al. Citation2022a; Mao et al. Citation2015). Our study area is uniquely situated at the southern edge of the permafrost zone. We aim to elucidate how permafrost degradation affects vegetation growth by examining the relationship between permafrost and vegetation NPP across varying degradation levels. Our results showed that the annual NPP values of vegetation in the NEC permafrost zone generally had an increasing trend, although 9.5% of the area did not show an area of increase, which was consistent with the results of Ge et al. (Citation2021). Utilizing partial correlation analyses and sensitivity tests, the result determined that climatic factors continue to predominantly govern vegetation NPP. However, recent research indicates a declining impact of climate on vegetation growth (Mirabel et al. Citation2022; Peñuelas et al. Citation2017; Piao et al. Citation2014). Furthermore, the results of sensitivity analyses () and partial correlation analyses ()) reveal that SOS in forest vegetation exhibits greater sensitivity to permafrost degradation than to direct climate change. This finding aligns with outcomes from previous studies (Wang and Liu Citation2022; Wang et al. Citation2022).
We are able to further explore the effects of permafrost degradation on vegetation growth based on the results of attributional analyses (). The permafrost zone and unstable permafrost zone are distributed in the northeastern part of the NEC, which is arid and cold, and vegetation growth is sensitive to soil moisture in the root zone, which is at the beginning of permafrost degradation (, b)). At the early stage of permafrost thawing, the soil thawing time is prolonged and the active layer thickness increases, releasing a large amount of water and nutrients to reach the environment required for vegetation germination in advance, resulting in an early SOS and prolonged DOS, which prolongs the time for vegetation photosynthesis. Permafrost thaw releases nutrients trapped in the soil and increases N availability in the topsoil (Grosse et al. Citation2011; Keuper et al. Citation2017; Schuur et al. Citation2015) and can promote vegetation photosynthesis to increase vegetation NPP. Under conditions of sustained temperature increase, SOT and SOS may advance continuously, and the time lag between them may increase. This advancement, coupled with early soil moisture release, might amplify transpiration from the soil surface during spring. Concurrently, water release from thawing permafrost could be unsustainable in a continuing warming climate (Wang et al. Citation2023), and the deepening of the active layer could enhance soil permeability (Lian et al. Citation2020). This dual effect could intensify soil moisture stress within the root zone. Additionally, the predominantly shallow-rooted and coniferous vegetation in the permafrost zone, despite an extended photosynthesis period, does not markedly enhance vegetation NPP. Rather, it displays greater sensitivity to soil moisture with the shallower root systems, which does not have direct access to the water provided by permafrost thaw, thus showing a negative effect on permafrost degradation.
In contrast, the seasonally frozen ground is in the middle to late stages of permafrost degradation. We observed that as permafrost degrades to seasonally frozen ground, the enhancing effect of increased DOT on DOS diminishes and the limiting effect on GrSW decreases ()). The seasonally frozen ground is relatively warm and moist, insensitive to climate change, and the direct effects of climatic factors and GrSW on NPP are not significant. On the contrary, the direct enhancement of NPP was increased by the extension of the growing season. The overall NPP of vegetation in the seasonally frozen ground showed an increasing trend due to both moisture and heat conditions required for vegetation growth toward more suitable vegetation growth. The NPP unincreased zone is located in the southwestern region of the NEC, where the permafrost is close to the level of complete degradation. In , we observe that increasing temperature is the main reason limiting the increase of vegetation NPP in this zone. However, the increase in temperature increases the soil thawing time and prolongs the time for vegetation to carry out photosynthesis (Shen et al. Citation2022). At the same time, the increase in temperature intensifies soil water evaporation, leading to enhanced water stress in forest vegetation, closure of vegetation stomata, and reduced photosynthesis rate, thus limiting vegetation growth. As the permafrost layer gradually destabilizes and eventually degrades into seasonally frozen ground, the restrictive effect of soil freeze-thaw on vegetation growth diminishes progressively. Consequently, other factors will become the primary drivers influencing vegetation growth ().
4.3. Limitations
This study presents the certain limitations. First, there is uncertainty in the methodology for identifying permafrost degradation indicators (SOT, SOF, and DOT) using ERA5-Land surface soil temperature data and the threshold method. This uncertainty mainly affects the accurate judgment of the timing of soil freezing and thawing. To mitigate this uncertainty, future efforts could involve simulating permafrost changes by assessing multiple temperature datasets (Meng et al. Citation2023), including radiant brightness temperatures, and employing land surface models based on physical processes (Buri et al. Citation2024). Second, our analytical methods may not comprehensively display the effects of climate change-induced permafrost degradation on vegetation growth, especially regarding changes in soil hydrological, thermal, and nutrient conditions. Future studies would benefit from incorporating advanced process-based ecosystem modeling to thoroughly explore the complex interactions between permafrost degradation, climate change, and vegetation growth. Despite these limitations, this study offers important insights into vegetation growth at the southern edge of the permafrost region, which is currently undergoing continuous degradation.
5. Conclusions
This study aimed to elucidate the intrinsic mechanisms of environmental changes on vegetation growth during permafrost degradation, achieved by analyzing the relationship between permafrost and vegetation NPP across varying degrees of thawing. Utilizing 20-year (2001–2020) continuous satellite observations of the NEC region, we assessed the changes in vegetation NPP and phenology. Integrating permafrost zoning from the TTOP model and soil freeze-thaw data in the NEC, the study investigated the impact of continued permafrost degradation on vegetation NPP and phenology in different permafrost types using statistical methods. The findings revealed an overall trend of vegetation NPP growth and SOS advancement in the NEC over the past two decades. SOT advancement in permafrost and unstable permafrost zones emerged as the primary drivers influencing SOS advancement. Moreover, our study demonstrated the effects of continued permafrost degradation on vegetation NPP. With a warming climate, permafrost degradation with a latitudinal gradient has shifted toward a long-term persistence phase throughout the NEC. Earlier thaw onset and longer thaw duration increased soil water infiltration, leading to soil water deficit that constrained tree growth and hindered the rise of total vegetation NPP. These results underscore the potential negative impact of permafrost degradation on the NEC, which may intensify under future warming scenarios and hold significant implications for the regional carbon budget. To comprehensively illustrate the feedback of permafrost degradation on carbon sink dynamics, future investigations must consider additional factors, including changes in soil organic matter, and incorporate these influences into Earth system models.
Supplemental Material
Download MS Word (4.2 MB)Acknowledgments
We are truly thankful for the data support from “The Loess Plateau SubCenter, National Earth System Science Data Center, National Science & Technology Infrastructure of China. (http://loess.geodata.cn)”.
Disclosure statement
No potential conflict of interest was reported by the authors.
Data availability statement
The Vegetation-related data can be requested from the U.S. Geological Survey (USGS) and the National Aeronautics and Space Administration (NASA) (https://lpdaac.usgs.gov/). Climate data are available on application from the National Earth System Science Data Center, National Science & Technology Infrastructure of China (http://loess.geodata.cn). Soil temperature and moisture data were obtained from A Big Earth Data Platform for Three Poles (http://poles.tpdc.ac.cn/en/) and the European Centre for Medium-Range Weather Forecasts (ECMWF) (https://cds.climate.copernicus.eu/cdsapp#!/dataset/reanalysis-era5-land?tab=form), respectively.
Supplemental data
Supplemental data for this article can be accessed online at https://doi.org/10.1080/10095020.2024.2363618.
Correction Statement
This article has been corrected with minor changes. These changes do not impact the academic content of the article.
Additional information
Funding
Notes on contributors
Hong Yang
Hong Yang is currently pursuing her doctoral degree at Northeast Forestry University. Her research interests include using a combination of remote sensing data and model simulations to explore the effects of permafrost degradation on vegetation carbon stocks.
Yanqiu Xing
Yanqiu Xing is currently a professor of Northeast Forestry University, PhD supervisor. Her research interests focus on the application of remote sensing data in forestry resources, especially the application of LiDAR technology in forestry. Currently, she serves as the Deputy Secretary General of the Forest Engineering Society within the Chinese Society of Forestry, is an editorial board member of the Journal of Geospatial Information Science, and is a member of the Chinese National Committee of the International Society of Digital Earth (CNISDE) Lidar Professional Committee (CNISDE-LiDAR). In recent years, she has published more than 100 forestry remote sensing research papers, 5 authorized patents, and 32 software copyrights.
Xiaoqing Chang
Xiaocqing Chang received her PhD from Northeast Forestry University and is currently a lecturer at Northeast Agricultural University. Her research interest is to study the impact study of land use change on carbon stock in China.
Jiaqi Wang
Jiaqi Wang is currently pursuing her master degree at Northeast Forestry University. Her research interests include the study of ecosystem services in Northeast China.
Yuanxin Li
Yuanxin Li is currently pursuing her master degree at Northeast Forestry University. Her research interests include the use of LiDAR data to explore the forest understory subsurface.
Jie Tang
Jie Tang is currently pursuing his doctoral degree at Northeast Forestry University. His research direction is quantitative inversion from multi-source remote sensing.
Dejun Wang
Dejun Wang is currently pursuing his doctoral degree at Northeast Forestry University. His research focuses on the application of remote sensing technology in forest resource surveys.
References
- Ala-Aho, P., A. Autio, J. Bhattacharjee, E. Isokangas, K. Kujala, H. Marttila, M. Menberu, et al. 2021. “What Conditions Favor the Influence of Seasonally Frozen Ground on Hydrological Partitioning? A Systematic Review.” Environmental Research Letters 16 (4): 043008. https://doi.org/10.1088/1748-9326/abe82c.
- Allen, C. D., A. K. Macalady, H. Chenchouni, D. Bachelet, N. McDowell, M. Vennetier, T. Kitzberger, et al. 2010. “A Global Overview of Drought and Heat-Induced Tree Mortality Reveals Emerging Climate Change Risks for Forests.” Forest Ecology and Management 259 (4): 660–684. https://doi.org/10.1016/j.foreco.2009.09.001.
- Biskaborn, B. K., S. L. Smith, J. Noetzli, H. Matthes, G. Vieira, D. A. Streletskiy, P. Schoeneich, et al. 2019. “Permafrost Is Warming at a Global Scale.” Nature Communications 10 (1): 264. https://doi.org/10.1038/s41467-018-08240-4.
- Bolton, D. K., J. M. Gray, E. K. Melaas, M. Moon, L. Eklundh, and M. A. Friedl. 2020. “Continental-Scale Land Surface Phenology from Harmonized Landsat 8 and Sentinel-2 Imagery.” Remote Sensing of Environment 240 (4): 111685. https://doi.org/10.1016/j.rse.2020.111685.
- Buermann, W., P. R. Bikash, M. Jung, D. H. Burn, and M. Reichstein. 2013. “Earlier Springs Decrease Peak Summer Productivity in North American Boreal Forests.” Environmental Research Letters 8 (2): 024027. https://doi.org/10.1088/1748-9326/8/2/024027.
- Buri, P., S. Fatichi, T. E. Shaw, C. L. Fyffe, E. S. Miles, M. J. McCarthy, M. Kneib, et al. 2024. “Land Surface Modeling Informed by Earth Observation Data: Toward Understanding Blue–Green–White Water Fluxes in High Mountain Asia.” Geo-Spatial Information Science 0 (0): 1–25. https://doi.org/10.1080/10095020.2024.2330546.
- Chang, Z., L. Fan, J.-P. Wigneron, Y.-P. Wang, X. Li, M. Wang, X. Liu, et al. 2024. “Evaluation of Optical and Microwave-Derived Vegetation Indices for Monitoring Aboveground Biomass Over China.” Geo-Spatial Information Science. March. Accessed April 13, 2024. https://www.tandfonline.com/doi/abs/10.1080/10095020.2024.2311858.
- Chapin, F. S., M. Sturm, M. C. Serreze, J. P. McFadden, J. R. Key, A. H. Lloyd, A. D. McGuire, et al. 2005. “Role of Land-Surface Changes in Arctic Summer Warming.” Science 310 (5748): 657–660. https://doi.org/10.1126/science.1117368.
- Che, L., H. Zhang, and L. Wan. 2023. “Spatial Distribution of Permafrost Degradation and Its Impact on Vegetation Phenology from 2000–2020.” Science of the Total Environment 877 (6): 162889. https://doi.org/10.1016/j.scitotenv.2023.162889.
- Chen, X., X. Li, G. Wang, and X. Zheng. 2022. “Faster Velocity Changes in the Near-Surface Soil Freeze State in Croplands Than in Forests Across Northeast China from 1979 to 2020.” Journal of Environmental Management 321 (11): 116022. https://doi.org/10.1016/j.jenvman.2022.116022.
- Chen, X., Y. Yang, and J. Du. 2022. “Distribution and Attribution of Earlier Start of the Growing Season Over the Northern Hemisphere from 2001–2018.” Remote Sensing 14 (13): 2964. https://doi.org/10.3390/rs14132964.
- Fan, Y., J. Chen, G. Shirkey, R. John, S. R. Wu, H. Park, and C. Shao. 2016. “Applications of Structural Equation Modeling (SEM) in Ecological Studies: An Updated Review.” Ecological Processes 5 (1): 19. https://doi.org/10.1186/s13717-016-0063-3.
- Friedlingstein, P., M. O’Sullivan, M. W. Jones, R. M. Andrew, L. Gregor, J. Hauck, C. Le Quéré, et al. 2022. “Global Carbon Budget 2022.” Earth System Science Data 14 (11): 4811–4900. https://doi.org/10.5194/essd-14-4811-2022.
- Fu, Y. H., H. Zhao, S. Piao, M. Peaucelle, S. Peng, G. Zhou, P. Ciais, et al. 2015. “Declining Global Warming Effects on the Phenology of Spring Leaf Unfolding.” Nature 526 (7571): 104–107. https://doi.org/10.1038/nature15402.
- Ge, J., M. Hou, T. Liang, Q. Feng, X. Meng, J. Liu, X. Bao, and H. Gao. 2022. “Spatiotemporal Dynamics of Grassland Aboveground Biomass and Its Driving Factors in North China Over the Past 20 Years.” Science of the Total Environment 826 (6): 154226. https://doi.org/10.1016/j.scitotenv.2022.154226.
- Ge, W., L. Deng, F. Wang, and J. Han. 2021. “Quantifying the Contributions of Human Activities and Climate Change to Vegetation Net Primary Productivity Dynamics in China from 2001–2016.” Science of the Total Environment 773 (6): 145648. https://doi.org/10.1016/j.scitotenv.2021.145648.
- Grosse, G., J. Harden, M. Turetsky, A. D. McGuire, P. Camill, C. Tarnocai, S. Frolking, et al. 2011. “Vulnerability of High-Latitude Soil Organic Carbon in North America to Disturbance.” Journal of Geophysical Research: Biogeosciences 116 (G4). Accessed June 3, 2023. https://doi.org/10.1029/2010JG001507.
- Guo, J., Y. Hu, Z. Xiong, X. Yan, C. Li, and R. Bu. 2017. “Variations in Growing-Season NDVI and Its Response to Permafrost Degradation in Northeast China.” Sustainability 9 (4): 551. https://doi.org/10.3390/su9040551.
- Heijmans, M. M. P. D., R. Í. Magnússon, M. J. Lara, G. V. Frost, I. H. Myers-Smith, J. van Huissteden, M. T. Jorgenson, et al. 2022. “Tundra Vegetation Change and Impacts on Permafrost.” Nature Reviews Earth & Environment 3 (1): 68–84. https://doi.org/10.1038/s43017-021-00233-0.
- Helbig, M., C. Pappas, and O. Sonnentag. 2016. “Permafrost Thaw and Wildfire: Equally Important Drivers of Boreal Tree Cover Changes in the Taiga Plains, Canada.” Geophysical Research Letters 43 (4): 1598–1606. https://doi.org/10.1002/2015GL067193.
- Hu, J., Z. Nan, and H. Ji. 2022. “Spatiotemporal Characteristics of NPP Changes in Frozen Ground Areas of the Three-River Headwaters Region, China: A Regional Modeling Perspective.” Frontiers in Earth Science, 10. Accessed June 2, 2023. https://www.frontiersin.org/articles/10.3389/feart.2022.838558.
- Hugelius, G., J. Strauss, S. Zubrzycki, J. W. Harden, E. A. G. Schuur, C.-L. Ping, L. Schirrmeister, et al. 2014. “Estimated Stocks of Circumpolar Permafrost Carbon with Quantified Uncertainty Ranges and Identified Data Gaps.” Biogeosciences (Online) 11 (23): 6573–6593. Accessed August 3, 2023. https://doi.org/10.5194/bg-11-6573-2014.
- Jin, X., H. Jin, D. Luo, Y. Sheng, Q. Wu, J. Wu, W. Wang, et al. 2022. “Impacts of Permafrost Degradation on Hydrology and Vegetation in the Source Area of the Yellow River on Northeastern Qinghai-Tibet Plateau, Southwest China.” Frontiers in Earth Science 10 (3): 845824. https://doi.org/10.3389/feart.2022.845824.
- Jin, X.-Y., H.-J. Jin, G. Iwahana, S. S. Marchenko, D.-L. Luo, X.-Y. Li, and S.-H. Liang. 2021. “Impacts of Climate-Induced Permafrost Degradation on Vegetation: A Review.” Advances in Climate Change Research 12 (1): 29–47. https://doi.org/10.1016/j.accre.2020.07.002.
- Keuper, F., E. Dorrepaal, P. M. van Bodegom, R. van Logtestijn, G. Venhuizen, J. van Hal, and R. Aerts. 2017. “Experimentally Increased Nutrient Availability at the Permafrost Thaw Front Selectively Enhances Biomass Production of Deep-Rooting Subarctic Peatland Species.” Global Change Biology 23 (10): 4257–4266. https://doi.org/10.1111/gcb.13804.
- Keuper, F., P. M. van Bodegom, E. Dorrepaal, J. T. Weedon, J. van Hal, R. S. P. van Logtestijn, and R. Aerts. 2012. “A Frozen Feast: Thawing Permafrost Increases Plant-Available Nitrogen in Subarctic Peatlands.” Global Change Biology 18 (6): 1998–2007. https://doi.org/10.1111/j.1365-2486.2012.02663.x.
- Kim, Y., J. S. Kimball, J. Glassy, and J. Du. 2017. “An Extended Global Earth System Data Record on Daily Landscape Freeze–Thaw Status Determined from Satellite Passive Microwave Remote Sensing.” Earth System Science Data 9 (1): 133–147. https://doi.org/10.5194/essd-9-133-2017.
- Kim, Y., J. S. Kimball, K. Zhang, and K. C. McDonald. 2012. “Satellite Detection of Increasing Northern Hemisphere Non-Frozen Seasons from 1979–2008: Implications for Regional Vegetation Growth.” Remote Sensing of Environment 121 (6): 472–487. https://doi.org/10.1016/j.rse.2012.02.014.
- Li, C., H. Sun, L. Liu, T. Dou, M. Zhou, W. Li, and X. Wu. 2022a. “The Importance of Permafrost in the Steady and Fast Increase in Net Primary Production of the Grassland on the Qinghai–Tibet Plateau.” CATENA 211 (4): 105964. https://doi.org/10.1016/j.catena.2021.105964.
- Li, X., H. Jin, L. Sun, H. Wang, Y. Huang, R. He, X. Chang, S. Yu, and S. Zang. 2022b. “TTOP‐model‐based Maps of Permafrost Distribution in Northeast China for 1961–2020.” Permafrost and Periglacial Processes 33 (4): 425–435. https://doi.org/10.1002/ppp.2157.
- Li, Y., W. Liu, Q. Feng, M. Zhu, L. Yang, J. Zhang, and X. Yin. 2023. “The Role of Land Use Change in Affecting Ecosystem Services and the Ecological Security Pattern of the Hexi Regions, Northwest China.” Science of the Total Environment 855 (1): 158940. https://doi.org/10.1016/j.scitotenv.2022.158940.
- Lian, X., S. Piao, A. Chen, K. Wang, X. Li, W. Buermann, C. Huntingford, J. Peñuelas, H. Xu, and R. B. Myneni. 2021. “Seasonal Biological Carryover Dominates Northern Vegetation Growth.” Nature Communications 12 (1): 983. https://doi.org/10.1038/s41467-021-21223-2.
- Lian, X., S. Piao, L. Z. X. Li, Y. Li, C. Huntingford, P. Ciais, A. Cescatti, et al. 2020. “Summer Soil Drying Exacerbated by Earlier Spring Greening of Northern Vegetation.” Science Advances 6 (1): eaax0255. https://doi.org/10.1126/sciadv.aax0255.
- Liu, H., Y. Deng, and X. Liu. 2021. “The Contribution of Forest and Grassland Change Was Greater Than That of Cropland in Human-Induced Vegetation Greening in China, Especially in Regions with High Climate Variability.” Science of the Total Environment 792 (10): 148408. https://doi.org/10.1016/j.scitotenv.2021.148408.
- Liu, Y., and Y. Yang. 2022. “Detecting a Declining Trend of Multidepth Soil Moisture Over the Mongolian Plateau from 1950 to 2020 Using ERA5-Land Reanalysis Datasets.” IEEE Access 10:95509–95526. https://doi.org/10.1109/ACCESS.2022.3204780.
- Lovell, R. S. L., S. Collins, S. H. Martin, A. L. Pigot, and A. B. Phillimore. 2023. “Space-For-Time Substitutions in Climate Change Ecology and Evolution.” Biological Reviews 98 (6): 2243–2270. https://doi.org/10.1111/brv.13004.
- Mao, D., L. Luo, Z. Wang, C. Zhang, and C. Ren. 2015. “Variations in Net Primary Productivity and Its Relationships with Warming Climate in the Permafrost Zone of the Tibetan Plateau.” Journal of Geographical Sciences 25 (8): 967–977. https://doi.org/10.1007/s11442-015-1213-8.
- Meng, Y., J. Zhou, F.-M. Göttsche, W. Tang, J. Martins, L. Perez-Planells, J. Ma, and Z. Wang. 2023. “Investigation and Validation of Two All-Weather Land Surface Temperature Products with in-Situ Measurements.” Geo-Spatial Information Science 1–13. https://doi.org/10.1080/10095020.2023.2255037.
- Miner, K. R., J. D’Andrilli, R. Mackelprang, A. Edwards, M. J. Malaska, M. P. Waldrop, and C. E. Miller. 2021. “Emergent Biogeochemical Risks from Arctic Permafrost Degradation.” Nature Climate Change 11 (10): 809–819. https://doi.org/10.1038/s41558-021-01162-y.
- Mirabel, A., M. P. Girardin, J. Metsaranta, E. M. Campbell, A. Arsenault, P. B. Reich, and D. Way. 2022. “New Tree-Ring Data from Canadian Boreal and Hemi-Boreal Forests Provide Insight for Improving the Climate Sensitivity of Terrestrial Biosphere Models.” Science of the Total Environment 851 (12): 158062. https://doi.org/10.1016/j.scitotenv.2022.158062.
- Myneni, R. B., J. Dong, C. J. Tucker, R. K. Kaufmann, P. E. Kauppi, J. Liski, L. Zhou, V. Alexeyev, and M. K. Hughes. 2001. “A Large Carbon Sink in the Woody Biomass of Northern Forests.” Proceedings of the National Academy of Sciences 98 (26): 14784–14789. https://doi.org/10.1073/pnas.261555198.
- Obu, J., S. Westermann, A. Bartsch, N. Berdnikov, H. H. Christiansen, A. Dashtseren, R. Delaloye, et al. 2019. “Northern Hemisphere Permafrost Map Based on TTOP Modelling for 2000–2016 at 1 km2 Scale.” Earth-Science Reviews 193 (6): 299–316. https://doi.org/10.1016/j.earscirev.2019.04.023.
- Peng, R., H. Liu, O. A. Anenkhonov, D. V. Sandanov, A. Yu, L. S. Korolyuk, C. Xu, J. Dai, and L. Wang. 2022. “Tree Growth Is Connected with Distribution and Warming Induced Degradation of Permafrost in Southern Siberia.” Global Change Biology 28 (17): 5243–5253. https://doi.org/10.1111/gcb.16284.
- Peng, S., Y. Ding, W. Liu, and Z. Li. 2019. “1 km Monthly Temperature and Precipitation Dataset for China from 1901 to 2017.” Earth System Science Data 11 (4): 1931–1946. https://doi.org/10.5194/essd-11-1931-2019.
- Peng, X., T. Zhang, O. W. Frauenfeld, S. Wang, L. Qiao, R. Du, and C. Mu. 2020. “Northern Hemisphere Greening in Association with Warming Permafrost.” Journal of Geophysical Research: Biogeosciences 125 (1): e2019JG005086. https://doi.org/10.1029/2019JG005086.
- Peñuelas, J., P. Ciais, J. G. Canadell, I. A. Janssens, M. Fernández-Martínez, J. Carnicer, M. Obersteiner, S. Piao, R. Vautard, and J. Sardans. 2017. “Shifting from a Fertilization-Dominated to a Warming-Dominated Period.” Nature Ecology & Evolution 1 (10): 1438–1445. https://doi.org/10.1038/s41559-017-0274-8.
- Piao, S., Q. Liu, A. Chen, I. A. Janssens, Y. Fu, J. Dai, L. Liu, X. Lian, M. Shen, and X. Zhu. 2019. “Plant Phenology and Global Climate Change: Current Progresses and Challenges.” Global Change Biology 25 (6): 1922–1940. https://doi.org/10.1111/gcb.14619.
- Piao, S., H. Nan, C. Huntingford, P. Ciais, P. Friedlingstein, S. Sitch, S. Peng, et al. 2014. “Evidence for a Weakening Relationship Between Interannual Temperature Variability and Northern Vegetation Activity.” Nature Communications 5 (1): 5018. https://doi.org/10.1038/ncomms6018.
- Piao, S., J. Tan, A. Chen, Y. H. Fu, P. Ciais, Q. Liu, I. A. Janssens, et al. 2015. “Leaf Onset in the Northern Hemisphere Triggered by Daytime Temperature.” Nature Communications 6 (1): 6911. https://doi.org/10.1038/ncomms7911.
- Pickett, S. T. A. 1989. “Space-For-Time Substitution As an Alternative to Long-Term Studies.” In Long-Term Studies in Ecology: Approaches and Alternatives, edited by E. L. Gene, 110–135. New York, NY: Springer. Accessed January 10, 2024. https://doi.org/10.1007/978-1-4615-7358-6_5.
- Qiao, L., and H. Xia. 2024. “The Impact of Drought Time Scales and Characteristics on Gross Primary Productivity in China from 2001–2020.” Geo-Spatial Information Science 0 (0): 1–19. https://doi.org/10.1080/10095020.2024.2315279.
- Ran, Y., X. Li, G. Cheng, T. Zhang, Q. Wu, H. Jin, and R. Jin. 2012. “Distribution of Permafrost in China: An Overview of Existing Permafrost Maps: Distribution of Permafrost in China.” Permafrost and Periglacial Processes 23 (4): 322–333. https://doi.org/10.1002/ppp.1756.
- Salas, E. A. L. 2021. “Waveform LiDAR Concepts and Applications for Potential Vegetation Phenology Monitoring and Modeling: A Comprehensive Review.” Geo-Spatial Information Science 24 (2): 179–200. https://doi.org/10.1080/10095020.2020.1761763.
- Schuur, E. A. G., A. D. McGuire, C. Schädel, G. Grosse, J. W. Harden, D. J. Hayes, G. Hugelius, et al. 2015. “Climate Change and the Permafrost Carbon Feedback.” Nature 520 (7546): 171–179. https://doi.org/10.1038/nature14338.
- Shen, M., S. Wang, N. Jiang, J. Sun, R. Cao, X. Ling, B. Fang, et al. 2022. “Plant Phenology Changes and Drivers on the Qinghai–Tibetan Plateau.” Nature Reviews Earth & Environment 3 (10): 633–651. https://doi.org/10.1038/s43017-022-00317-5.
- Shipley, B. 2013. “The AIC Model Selection Method Applied to Path Analytic Models Compared Using a D-Separation Test.” Ecology 94 (3): 560–564. https://doi.org/10.1890/12-0976.1.
- Sitch, S., P. Friedlingstein, N. Gruber, S. D. Jones, G. Murray-Tortarolo, A. Ahlström, S. C. Doney, et al. 2015. “Recent Trends and Drivers of Regional Sources and Sinks of Carbon Dioxide.” Biogeosciences 12 (3): 653–679. https://doi.org/10.5194/bg-12-653-2015.
- Smith, S. L., H. B. O’Neill, K. Isaksen, J. Noetzli, and V. E. Romanovsky. 2022. “The Changing Thermal State of Permafrost.” Nature Reviews Earth & Environment 3 (1): 10–23. https://doi.org/10.1038/s43017-021-00240-1.
- Venter, Z. S., H.-J. Hawkins, M. D. Cramer, and A. J. Mills. 2021. “Mapping Soil Organic Carbon Stocks and Trends with Satellite-Driven High Resolution Maps Over South Africa.” Science of the Total Environment 771 (6): 145384. https://doi.org/10.1016/j.scitotenv.2021.145384.
- Walvoord, M. A., and B. L. Kurylyk. 2016. “Hydrologic Impacts of Thawing Permafrost—A Review.” Vadose Zone Journal 15 (6): vzj2016.01.0010. 1–20. https://doi.org/10.2136/vzj2016.01.0010.
- Wang, J., and D. Liu. 2022. “Vegetation Green-Up Date Is More Sensitive to Permafrost Degradation Than Climate Change in Spring Across the Northern Permafrost Region.” Global Change Biology 28 (4): 1569–1582. https://doi.org/10.1111/gcb.16011.
- Wang, M., P. Li, C. Peng, J. Xiao, X. Zhou, Y. Luo, and C. Zhang. 2022. “Divergent Responses of Autumn Vegetation Phenology to Climate Extremes Over Northern Middle and High Latitudes.” Global Ecology and Biogeography 31 (11): 2281–2296. https://doi.org/10.1111/geb.13583.
- Wang, T., D. Yang, Y. Yang, S. Piao, X. Li, G. Cheng, and B. Fu. 2020. “Permafrost Thawing Puts the Frozen Carbon at Risk Over the Tibetan Plateau.” Science Advances 6 (19): eaaz3513. https://doi.org/10.1126/sciadv.aaz3513.
- Wang, T., D. Yang, Y. Yang, G. Zheng, H. Jin, X. Li, T. Yao, and G. Cheng. 2023. “Unsustainable Water Supply from Thawing Permafrost on the Tibetan Plateau in a Changing Climate.” Science Bulletin 68 (11): 1105–1108. https://doi.org/10.1016/j.scib.2023.04.037.
- Wang, T., D. Yang, G. Zheng, and R. Shi. 2022. “Possible Negative Effects of Earlier Thaw Onset and Longer Thaw Duration on Vegetation Greenness Over the Tibetan Plateau.” Agricultural and Forest Meteorology 326 (11): 109192. https://doi.org/10.1016/j.agrformet.2022.109192.
- Wang, X., Y. Zhou, R. Wen, C. Zhou, L. Xu, and X. Xi. 2020. “Mapping Spatiotemporal Changes in Vegetation Growth Peak and the Response to Climate and Spring Phenology Over Northeast China.” Remote Sensing 12 (23): 3977. https://doi.org/10.3390/rs12233977.
- Wen, L., M. Guo, S. Yin, S. Huang, X. Li, and F. Yu. 2021. “Vegetation Phenology in Permafrost Regions of Northeastern China Based on MODIS and Solar-Induced Chlorophyll Fluorescence.” Chinese Geographical Science 31 (3): 459–473. https://doi.org/10.1007/s11769-021-1204-x.
- Xing, Z., L. Fan, L. Zhao, G. De Lannoy, F. Frappart, J. Peng, X. Li, et al. 2021. “A First Assessment of Satellite and Reanalysis Estimates of Surface and Root-Zone Soil Moisture Over the Permafrost Region of Qinghai-Tibet Plateau.” Remote Sensing of Environment 265 (11): 112666. https://doi.org/10.1016/j.rse.2021.112666.
- Xu, X., J. Liu, S. Zhang, R. Li, C. Yan, and S. Wu. 2018. “China’s Multi-Period Land Use Land Cover Remote Sensing Monitoring Data Set (CNLUCC).” InResource and Environment Data Cloud Platform, Beijing, China.
- Zhang, J., Q. Hu, Y. Li, H. Li, and J. Li. 2021a. “Area, Lake-Level and Volume Variations of Typical Lakes on the Tibetan Plateau and Their Response to Climate Change, 1972–2019.” Geo-Spatial Information Science 24 (3): 458–473. https://doi.org/10.1080/10095020.2021.1940318.
- Zhang, J., X. Tong, J. Zhang, P. Meng, J. Li, and P. Liu. 2021b. “Dynamics of Phenology and Its Response to Climatic Variables in a Warm-Temperate Mixed Plantation.” Forest Ecology and Management 483 (3): 118785. https://doi.org/10.1016/j.foreco.2020.118785.
- Zhang, S., X. Bai, C. Zhao, Q. Tan, G. Luo, L. Wu, H. Xi, et al. 2022. “China’s Carbon Budget Inventory from 1997 to 2017 and Its Challenges to Achieving Carbon Neutral Strategies.” Journal of Cleaner Production 347 (5): 130966. https://doi.org/10.1016/j.jclepro.2022.130966.
- Zhou, J., X. Zhang, W. Tang, L. Ding, J. Ma, and X. Zhang. 2021. “Daily 1-Km All-Weather Land Surface Temperature Dataset for the Chinese Landmass and Its Surrounding Areas ( TRIMS LST; 2000–2021).” https://doi.org/10.11888/Meteoro.tpdc.271252.
- Zhou, J., X. Zhang, W. Zhan, F.-M. Gottsche, S. Liu, F.-S. Olesen, W. Hu, and F. Dai. 2017. “A Thermal Sampling Depth Correction Method for Land Surface Temperature Estimation from Satellite Passive Microwave Observation Over Barren Land.” IEEE Transactions on Geoscience and Remote Sensing 55 (8): 4743–4756. https://doi.org/10.1109/TGRS.2017.2698828.
- Zimov, S. A., E. A. G. Schuur, and F. S. Chapin. 2006. “Permafrost and the Global Carbon Budget.” Science 312 (5780): 1612–1613. https://doi.org/10.1126/science.1128908.
- Zou, D., L. Zhao, Y. Sheng, J. Chen, G. Hu, T. Wu, J. Wu, et al. 2017. “A New Map of Permafrost Distribution on the Tibetan Plateau.” The Cryosphere 11 (6): 2527–2542. https://doi.org/10.5194/tc-11-2527-2017.