
 ?Mathematical formulae have been encoded as MathML and are displayed in this HTML version using MathJax in order to improve their display. Uncheck the box to turn MathJax off. This feature requires Javascript. Click on a formula to zoom.
ABSTRACT
Aiming at the issue of low accuracy in crop mapping and growth monitoring caused by imprecise calibration of radar time-series data, this paper proposed a Synthetic Aperture Radar (SAR) spatio-temporal error compensation method. By constructing a compensation reference image using the buildings with stable backscattering coefficients in the study area, the error correction of time-series SAR data was realized based on the compensation model. The compensated SAR data were used to establish the Sugarcane Growth Index (SGI) according to the growth curve of sugarcane. The sugarcane area was extracted after combining the compensated SGI and optical image, and the accuracy of F1 on sugarcane distribution extraction was 92.12%. There was an improvement of 4.11% compared with no compensation method. On this basis, the newly planted and ratoon sugarcane were further classified by the expectation maximization algorithm based on the compensated SAR image at the seedling stage. The newly planted sugarcane and the ratoon sugarcane could be accurately distinguished with area extraction accuracy of 82.06% and 80.59%, respectively. Moreover, the compensated SAR data of time series during the tillering to maturity stages were used to estimate the sugarcane height, yielding an R2 value of 0.717 using a quadratic polynomial model. The Spatio-temporal error compensation method for distributed targets proposed in this study can reduce the loss of SAR data across various times and regions, and achieve accurate results of sugarcane distribution extraction and plant height estimation.
1. Introduction
Sugarcane is the world’s largest sugar crop, and sucrose accounts for over 70% of worldwide sugar production (Contreras et al. Citation2009). After Brazil and India, China is the world’s third-largest producer of sugar (Som-Ard et al. Citation2021). An annual planting area of sugarcane in Guangxi is about 800 kha, accounting for 60% of China’s output.
Timely and accurate mapping of sugarcane planting areas and monitoring of crop growth parameters like plant height are critical for supporting sugarcane production (Chen and Yuan Citation2010). However, frequent cloud cover limits the utility of optical satellite data during key phases of sugarcane growth. Synthetic Aperture Radar (SAR) offers a valuable alternative data source due to its all-weather imaging capacity (Jiang et al. Citation2019). The active microwave remote sensing method of SAR is not affected by weather factors and can observe the earth with strong penetration in any weather. Also, it is sensitive to the dielectric constant and geometric shape of crops (Shorachi, Kumar, and Steele-Dunne Citation2022; Zhang et al. Citation2018; Zhou et al. Citation2022), allowing for the detection of subtle changes that occur to the crops and fields (Useya and Chen Citation2019). In recent years, SAR has been used for crop classification and recognition, crop growth monitoring, and other related aspects (Gella, Bijker, and Belgiu Citation2021; Ndikumana et al. Citation2018; Yuan et al. Citation2023). Many studies have demonstrated the feasibility of accurately identifying crops, such as rice (Chang et al. Citation2021; Phan et al. Citation2018), corn (Meng et al. Citation2023; Xu et al. Citation2017), soybean (Zhu et al. Citation2022), and sugarcane (Li et al. Citation2019) using SAR data. Jiang et al. used Sentine-1 time-series data to extract the distribution of sugarcane using the XGBoost classifier, achieving an area extraction accuracy of 86.3% (Jiang et al. Citation2019). They found that the sugarcane mapping ability of VH polarization was better than that of VV polarization. Yeasin used Sentinel-1 and Sentinel-2 data for sugarcane phenological evaluation, and the results showed that the combination of optical and SAR images can provide accurate phenological recognition capabilities (Yeasin et al. Citation2022). Moreover, from the perspective of planting, sugarcane can be categorized into ratoon sugarcane and newly planted sugarcane. Ratoon sugarcane and newly planted sugarcane exhibit distinct growth cycles and environmental sensitivities. The plants of newly planted sugarcane first need to grow roots, which requires a relatively longer growth period and a higher effective accumulated temperature. Ratoon crops can reduce production costs and benefits growth through energy conservation by the reduction of inputs and utilization of residual manure and moisture (Hassan et al. Citation2017; Xu et al. Citation2021). Accurately distinguishing ratoon sugarcane and newly planted sugarcane is crucial for more scientific and targeted management of sugarcane production. At present, there is no relevant research on the fine classification of ratoon sugarcane and newly planted sugarcane.
Plant height is closely related to biomass and growth stages, and it plays an important part in crop development monitoring and yield assessment (Nasirzadehdizaji et al. Citation2019). Baghdadi et al. compared the growth monitoring potential of sugarcane under different polarization modes of TerraSAR-X, ASAR/ENVISAT, and PALSAR/ALOS (Baghdadi et al. Citation2009). The results showed that cross-polarization (HV and VH) more effectively represents the different growth stages of sugarcane compared to co-polarization (HH and VV). Liao et al. investigated that maize height is substantially connected with RADARSAT-2 parameters early in the growing season, whereas the correlation is weak later in the growth season (Liao et al. Citation2018). This study indicated that RADARSAT-2 data has a great potential for estimating agricultural variables in broad-leaf crops.
Radiometric calibration is an important technical means to establish an accurate relationship between radar backscatter and geophysical parameters, which is the premise of the quantitative application of the SAR imaging system (Li et al. Citation2021). SAR data is generally calibrated by point target or distributed target calibration method (Kimura, Papathanassiou, and Hajnsek Citation2005; Moriyama et al. Citation2006; Tao, Qu, and Chen Citation2016; Van Zyl and Jakob Citation1990). To address crosstalk and channel imbalance in the transmit and receive channels, Zhang presented a point target polarization calibration technique utilizing four calibrators (Zhang, Zhang, and Ieee Citation2013). After calibration, accurate surface scattering information can be obtained. However, the point target method requires manual calibrator deployment in a uniform and low-noise experimental site, and many amount of equipment should be placed in the whole SAR swath, resulting in high instrument deployment and maintenance costs. Distributed targets are used for calibration by naturally distributed scatterers with uniform backscattering characteristics, which can make up for the regional limitations of the point target method (Klein Citation1992). The Amazon rainforest is often used as a distributed target for SAR data calibration, due to its large-area stability and uniformity of scattering characteristics. The backscattering coefficient deviation of the Amazon rainforest is about 0.2 dB (Long and Skouson Citation1996). However, from the time dimension, satellites need a certain time interval to obtain the SAR data of the rainforest, which cannot ensure a stable measurement frequency. From the spatial dimension, the calibration field is far away from the study area, and the signal will fluctuate due to complex transmission conditions such as turbulence, wind field, or thermal environment. Therefore, the correction accuracy for SAR data through the Amason rainforest was limited for time-series data. However, the phenotypic characteristics of crops differ greatly across different growth and development stages, so time-series data is necessary for agricultural quantitative application.
Given the above background, this paper proposed a SAR imaging error compensation method considering the spatio-temporal relationship for more accurate sugarcane mapping and growth monitoring. The objectives of this study are to: 1) develop a Spatio-temporal error compensation method for Sentinel-1 using building area, 2) extract the sugarcane area using compensated multi-temporal Sentinel-1 and Sentinel-2, 3) further distinguish the ratoon sugarcane and newly planted sugarcane based on the compensated Sentinel-1 using the Expectation Maximization (EM) algorithm, and 4) estimate plant height using compensated multi-temporal Sentinel-1 by classical empirical regression models in key growth periods of sugarcane.
2. Study area and datasets
2.1. Study area and study crops
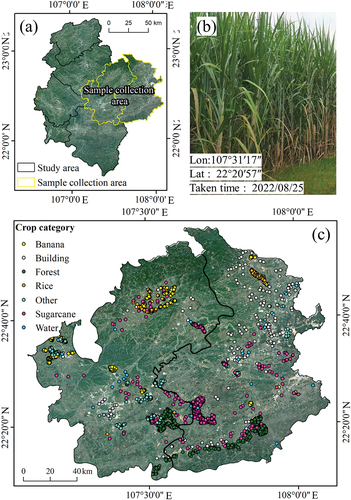
The research area is located in Chongzuo City, Guangxi Province (21°36′–23°22′N, 106°33′–108°6′E), which is the largest sugarcane planting and production base in China (Deng et al. Citation2022) shown in . The subtropical monsoon climate of Chongzuo features high annual rainfall. The average annual rainfall is more than 1200 mm. The main sugarcane growth period is covered by the rainy season, which lasts from April to September and contributes to around 79% of the total annual rainfall.
Figure 1. Study area and sample collection area (a), sugarcane in elongation stage (b), and sample sites in sample collection area (c).
Sugarcane has an extended growing season, typically sown in February and March, and goes through stages of sowing, seedling, tillering, elongation, and maturity. Harvesting starts in November–December of the same year and continues until February of the following year. shows the growth cycle of sugarcane and other major crops in Chongzuo City.
Table 1. Growth stages of main crops in Chongzuo City.
2.2. Datasets and pre-processing
2.2.1. Sentinel-1 data and pre-processing
The experiment selected level-1 Sentinel-1A data of Interferometric Wide mode at the European Space Agency (ESA) data center (https://scihub.Copernicus.eu/). The revisit period of the Sentinel-1A satellite is 12 days, and the data type is Ground Range Detected, whose pixel information represents the amplitude information of the corresponding monitoring area. It has been proved that the cross-polarization feature can better characterize the different growth states of sugarcane than the co-polarization feature (Baghdadi et al. Citation2009; Jiang et al. Citation2019). Consequently, the 27 VH polarization data from Sentine-1 were selected, which covers the whole year of images of Chongzuo City in 2022.
Sentinel Application Platform (SNAP), a complete application platform for the Sentinel satellite products from the ESA, was utilized for the pre-processing of Sentinel-1A. The processes involve radiometric calibration, speckle filtering, terrain correction, decibelization, image mosaicking, and clipping. Radiometric calibration converted values of digital numbers into backscatter coefficients σ0 band. The speckle filtering adopted an adaptive filter Refined Lee, with a filtering window size of 5 × 5 (Greatbatch Citation2012). The study utilized SRTM 3-arc-second DEM data for terrain correction and employed bilinear interpolation to resample images to a 10 × 10 m/pixel resolution. The backscatter coefficient in dB was obtained from the σ0 band through decibelization, and the mosaic of the study area was generated by combining two Sentinel-1A images using the weighted average method, followed by data clipping based on the vector boundary of Chongzuo City.
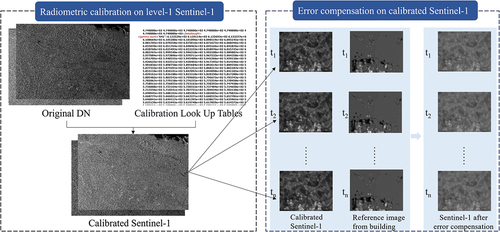
Radiometric distortion across acquisitions due to varying conditions could still exist after radiometric calibration (El Hajj et al. Citation2016). This experiment extracted the signals of the buildings with stable scattering characteristics of each phase data in the study area and carried out error compensation for the time-series Sentinel-1 data, respectively, see and Section 3.1 for details.
Figure 2. Radiometric calibration and error compensation proposed in this study.
2.2.2. Sentinel-2 data and pre-processing
The Sentinel-2 Level-2A product data were downloaded from the ESA data center, and 10 m/pixel spatial resolution images were selected, including blue (0.490 μm), green (0.560 μm), red (0.665 μm), and near-infrared (0.833 μm). Since the main growth period of sugarcane in the study area was cloudy and rainy, most of the optical image quality was poor. Finally, the experiment selected an image in mid-October, with data complete and good quality, as well as in the growth period of sugarcane.
2.2.3. Ground truths collection
The experiment conducted field sampling for sugarcane extraction from August 23 to 26, 2022, when sugarcane was in the elongation stage. The collection area is mainly distributed in Jiangzhou District and Fusui County, which are the largest sugarcane planting areas in Chongzuo City. Experimental sampling was conducted according to the planned routes of the main sugarcane production areas, based on the expert knowledge of local sugar companies. Considering the spatial resolution of Sentinel-1 and Sentinel-2 images, the sampling plot’s size should be restricted to an area greater than 400 m2. To prevent the misclassification of sugarcane and other items, the categories of samples in the experiment encompassed the major categories of objects in the study region. Therefore, the samples of rice and bananas, two important crops in the research area, were also taken in the field along with the samples of sugarcane. Moreover, samples of the forest, buildings, water, and others were drawn evenly in the whole district of Chongzuo City through the current Land Use Status Data (LUSD). See the literature (Hong et al. Citation2022) for a detailed description of the LUSD. The distribution of sample sites are shown in , and the sample area and sample size are shown in .
Table 2. Sample area and sample size in this experiment.
The statistical data of the sugarcane area in this experiment was sourced from the 2022 sugarcane production survey conducted by (Deng et al. Citation2022). In Chongzuo City, as well as its four counties, the planting area of sugarcane, comprising ratoon sugarcane and newly planted sugarcane, was determined.
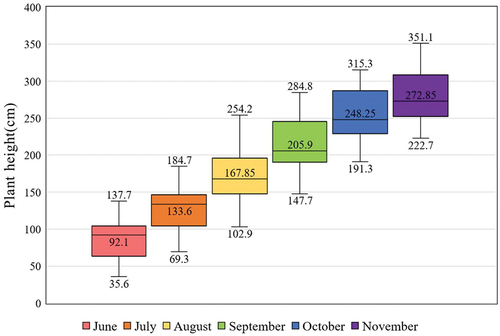
The ground truths of sugarcane height were provided by local sugar companies from June to November 2022. The plant height was measured in the middle of each month. There were 30 sampling points and a total of 180 groups of plant height data, and the descriptive statistics of specific data were listed in , which revealed the plant height increased from 30 cm to about 350 cm from June to November.
Figure 3. Descriptive statistics of the ground truth of sugarcane height.
3. Methods
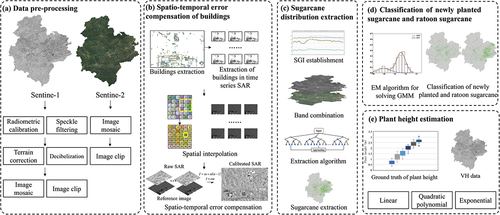
In this study, the 27 VH polarization data of Sentine-1 were first processed using the Spatio-temporal error compensation method with buildings, and the Sugarcane Growth Index (SGI) was constructed based on the corrected VH data according to the sugarcane phenological characteristics. The sugarcane was extracted using the band combination of SGI and optical data based on the Random Forest (RF) algorithm and U-Net. Combining the distribution results of sugarcane and SAR images during the seedling stage, the EM algorithm was used to further extract newly planted sugarcane and ratoon sugarcane. Then, the plant height of sugarcane was estimated using corrected VH data. The technical process of this article is shown in .
Figure 4. Flowchart of technical route.
3.1. Spatio-temporal error compensation method based on buildings
3.1.1. Compensation reference image
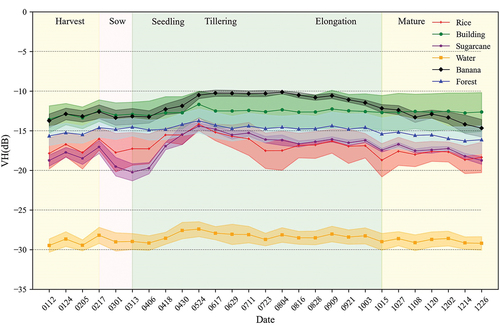
Regions with large areas and stable scattering characteristics are generally selected as distribution targets in calibration. shows the 2022 time-series mean values of VH polarization in 6 types of objects in this study, namely sugarcane, banana, rice, water, forest, and buildings. Among them, the backscatter coefficients of the three crops show significant variation at different growth stages. Due to the high sensitivity to environmental changes and the growth of aquatic plants, the backscattering coefficient of water fluctuates by about 3 dB. Buildings, which are generally oriented perpendicular to the ground and constructed from materials with high dielectric constants such as bricks, cement, and steel, produce a robust and stable backscattered echo. In preprocessing, radiometric calibration can compensate for the differences in observation geometry between different SAR data. Post-calibration, the backscatter coefficient of the same building should ideally remain consistent across different observation periods. However, the VH values of January 24th, February 17th, and May 24th in fluctuated by 1–2 dB. Additionally, similar fluctuations to those observed in buildings are present in the time-series curves of the other objects.
Figure 5. Time sequence diagram of mean values of VH in 6 objects in 2022 (the shaded areas refer to the standard deviation calculated from the sample points).
To explore the correlation of signal power among different objects in time-series SAR data, the experiment selected the elongation stage, during which the backscattering coefficient of sugarcane is relatively stable, to calculate the Pearson correlation coefficient among six objects.
As shown in , the correlation of the backscatter coefficients between water and sugarcane was highest, with a value of 0.90. However, calm water exhibits a relatively weak signal-to-noise ratio due to its specular reflection, and there are significant differences in the original phenotypic characteristics between the two objects. Therefore, the high correlation between water and sugarcane indicates common errors existed in echo intensity, which were not eliminated in the preprocessing. These errors may stem from several factors. On the one hand, the fluctuation of received power comes from the radar imaging itself, including transmission power drift, incidence angle fluctuation, slant range error, and system noise, which usually cause similar signal fluctuations to all objects within the same image. On the other hand, due to environmental changes such as wind field and temperature, the phenotype of the ground object will change accordingly, resulting in the fluctuation of the echo signal (Wang et al. Citation2021; Wang et al. Citation2017). The correlation coefficient between buildings and sugarcane is lower than that of other objects, which belongs to a moderate correlation. illustrates that during the sugarcane elongation stage, the backscatter coefficient of the building is stable, with a maximum fluctuation of 0.44 dB. Buildings, composed of materials with large dielectric constants, are less susceptible to environmental factors than crop, water, and forest, and the backscattered echo signal is more stable.
Table 3. Evaluation of correlation of backscatter coefficient among six objects.
Therefore, the backscattering coefficients of the building were chosen as the study’s benchmarks to re-correct the SAR images. The specific process is shown in . Due to the significant characteristics of building in optical data, the experiment first used Sentinel-2 data to pre-classify based on the RF algorithm, for extracting the building regions in the study area. Then, the extraction results were used as masks to segment the building areas from 27 VH data. The focus statistics algorithm was used to fill the empty value area outside the pixels of the buildings, generating a complete image in the study area. The focus statistics graph selected a rectangle with a side length of 500 × 500 pixels, and the statistical type is the mean value. The compensation reference images for buildings are formed.
3.1.2. Compensation model
The radar radiometric calibration model (Holecz et al. Citation1994) is shown in EquationEquation (1)(1)
(1) :
In the formula, represents the backscatter intensity received by the sensor;
and
represent transmission power and additional power, respectively;
and
represent the transmission and reception antenna gain,
is the antenna elevation angle and
is the antenna azimuth angle;
represents the current gain of the radar receiver;
represents the processor constant;
,
, and
respectively represent distance propagation loss, atmospheric loss, and system loss; A is the scattering area.
It can be seen from EquationEquation (1)(1)
(1) that the propagation loss, atmospheric loss, and system loss are all added to the original signal in the form of product calculation. At the same time, the elevation and azimuth of the antenna determine the satellite transmit gain
and receive gain
, which also affects the signal strength of the resolution unit of the imaging system in the form of product calculation. The additional power is combined with the original signal in the form of an addition calculation to form the true backscattering coefficient received by the sensor.
Moreover, referring to the noise model proposed in the literature (Tur, Chin, and Goodman Citation1982), the noise is uncorrelated when the imaging system’s resolution unit is less than the target’s spatial details. As shown in EquationEquation (2)(2)
(2) , the ground object echo can be characterized by two uncorrelated variables in the product model. The error noise can then be modeled as multiplicative noise.
where, is the intensity of the observed object,
is the real backscattering cross-section of the object, and
is the noise unrelated to the signal
, which is the calibration reference image extracted in this study. The noise follows the negative exponential distribution with a mean value of 1, and the variance is constant. The multiplicative model can also be converted into an additive model (EquationEquation (3)
(3)
(3) ), which
is also irrelevant to (
–1). The mean value of additive noise becomes 0, and the variance will change with the change in observation intensity and the backscatter of the scene. In this experiment, the multiplicative model and the additive model were used to establish the calibration model, respectively.
3.2. Sugarcane growth index
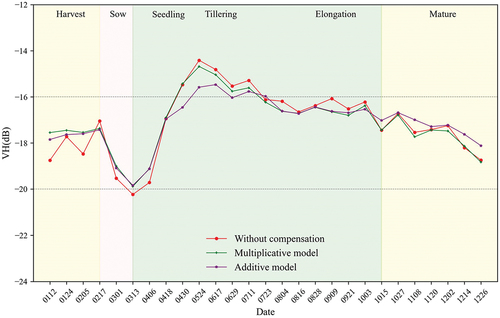
The SGI was proposed to highlight the crop’s phenological development using the compensated time-series SAR data. As shown in , the backscatter coefficient of sugarcane displays a characteristic temporal pattern through the growing stages. There is a marked decrease from harvest to early growth, followed by an increase through tillering and a peak in elongation as canopy density and plant structure develop. To capture the dynamic changes in sugarcane growth, SGI is calculated as the difference between VH values at peak elongation of May 24th (VH05) and nadir post-harvest of March 13th (VH03), as given in EquationEquation (4)(4)
(4) . This enhances the contrast between bare soil after harvest versus mature sugarcane stands. The SGI is well-correlated to crop structure and thus aids in distinguishing sugarcane from other land covers when used alongside optical data. The integration of SGI with spectral bands provides complementary information on agronomic variables for robust classification.
3.3. Classification model construction
Achieving the finer classification of crop categories requires the utilization of not only spectral features and certain spatial features but also more complex spatial and temporal characteristics (Sun et al. Citation2023). In the experiment, a band stacking technique was employed, combining the compensated SGI with optical data to enhance the classification process. And two widely used classification algorithms, RF and U-Net, were used to extract sugarcane planting distribution, for verifying the effectiveness of error compensation under different algorithms.
RF algorithm is a collection of multiple decision trees, randomly sampled from the dataset through bootstrap to train each decision tree in the model. That is, each classified pixel makes a decision in order of importance level, and the branches formed by each pixel decision are gathered to form a tree. Therefore, the model has strong randomness and noise resistance, which is not easy to overfit. 80 trees and a depth of 20 trees were used in the experiment.
U-Net model has shown the good performance of semantic segmentation, which was a mature algorithm and application that existed in the agriculture field (Diao et al. Citation2023; Fawakherji et al. Citation2019; Zhang et al. Citation2020). In this study, Adam optimizer and an initial learning rate of 10−4 were used. The training batch size was set to 16 and the epoch was set to 2000. For binary classification in this study for sugarcane and others, the U-Net was trained with a pixel-wise binary cross-entropy loss and a sigmoid function as the activation layer.
3.4. Classification of newly planted sugarcane and ratoon sugarcane
Sugarcane can be divided into newly planted sugarcane and ratoon sugarcane according to different planting methods. In the early stages of sugarcane growth, ratoon sugarcane has the characteristic of early and rapid growth compared to newly planted sugarcane, and there could be some differences in their morphological characteristics (Chen et al. Citation2016). Consequently, the early growth phase of sugarcane may exhibit a variety of morphological characteristics, which can be effectively represented by a Gaussian Mixture Model (GMM) distribution. While the GMM is created by combining k separate Gaussian models, the Gaussian model precisely quantifies things using the Gaussian probability density function (Cai and Chen Citation2022). The experiment used the EM algorithm to resolve GMM issues and realized the classification of newly planted sugarcane and ratoon sugarcane. The probability density function of GMM is shown in EquationEquation (5)(5)
(5) .
where, is the probability density function of the kth Gaussian model, and
is the weight of the kth Gaussian model, which satisfies
.
The EM algorithm does not require prior knowledge and only obtains estimates of parameters from the observed data itself. Each iteration consists of two steps: expected value and expected maximization, which alternate throughout the entire iteration process until the iteration process converges. The experiment set the number of categories (k value) in the EM algorithm to 4 and iterated 100 times. The Akaike Information Criterion (AIC) and Bayesian Information Criterion (BIC) were used to measure the goodness of statistical model fitting to confirm the best GMM. The penalty parameter of BIC is larger than AIC, which leads BIC to choose simple models with fewer parameters. Generally, models with smaller AIC and BIC are selected to improve the fitting degree of the model and reduce the possibility of overfitting.
3.5. Sugarcane height estimation
The regression method based on backscatter coefficients was the most common way for crop development monitoring (Ji et al. Citation2024). In the key growth stage of sugarcane, the VH value has a downward trend with the growth of sugarcane from seedling to mature shown in , which is opposite to the plant height of sugarcane. Therefore, this study established regression models between backscattering coefficient values in VH for each sample site and the ground truths of sugarcane height from June to November. To maintain the consistency between the backscattering coefficient values in VH and the ground truth data, each area of interest was drawn as a circle with a diameter of 200 m around the measured points and used to calculate the mean value of the area of interest. This study compared the height estimation accuracy using three classical empirical regression models (i.e. linear model, quadratic polynomial model, and exponential model).
3.6. Accuracy evaluation
The field-collected samples are divided into training and testing sets. User’s Accuracy (UA), Producer’s Accuracy (PA), and F-measure (F1) are the metrics used to determine classification accuracy. RF algorithm adopted all seven kinds of samples to prevent the misclassification of sugarcane and other items. U-Net adopted two kinds of samples of objects and non-objects, and the samples were resized to the sizes of 256 × 256 pixels.
In the formula above, TP is the number of positive samples that are correctly predicted, TN is the number of positive samples that are falsely predicted, FP is the number of samples where negative samples are predicted to be positive samples, and FN is the number of samples where positive samples are predicted to be negative samples.
According to the statistical data of the sugarcane area in 2022 recorded in the literature (Deng et al. Citation2022), the extraction accuracy of ratoon sugarcane and newly planted areas was verified. The evaluation formula is as follows:
Among them, represents the accuracy of area extraction,
represents the sugarcane area extracted in this study, and
represents the statistical data of the sugarcane area.
For accuracy evaluation of height estimation, a total of 180 data of ground truths in 6 months are divided into training and testing sets in a 4:1 ratio. The robustness and precision of the sugarcane height extraction models were evaluated using the coefficient of determination (R2) and Root Mean Square Error (RMSE) calculations. While decreasing RMSE values signify more accurate estimates, and a higher R2 value suggests better model fitting.
4. Results
4.1. Evaluation on the Spatio-temporal error compensation method
The multiplicative model and the additive model were established based on the reference image of the building. Then, SGI was constructed using compensated VH03 and VH05, which were composited with the optical data to extract the sugarcane distribution. shows that after compensating the SAR data based on the multiplicative model, the classification accuracy of sugarcane is the highest in both classification algorithms. The F1 value is increased by 4.11% compared with the uncompensated method using the RF algorithm.
Figure 6. Accuracy evaluation of sugarcane extraction by different calibration methods.
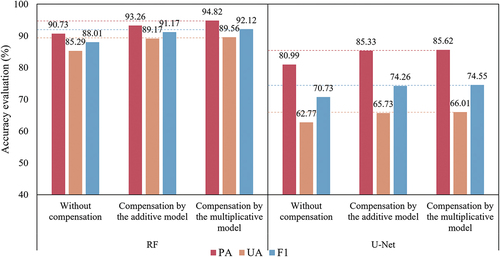
The multiplicative model and the additive model were used in the experiment to compare classification outcomes. The multiplicative model based on building demonstrated superior classification accuracy for sugarcane. Consequently, the losses eliminated by building calibration can be considered similar to propagation losses, atmospheric losses, and system losses in the radiation calibration equation, which are composited to the original signal in a product form.
Moreover, the limited number of samples in this experiment made it difficult to meet the need for large sample sizes in deep learning. Therefore, the extraction accuracy using the machine learning method is superior to that of the deep learning method in this experiment.
4.2. Evaluation of sugarcane extraction accuracy based on SGI
Various data combinations were tested to assess the efficacy of the SGI developed in this experiment for enhancing the accuracy of sugarcane categorization. RF algorithm was selected due to its higher extraction accuracy of sugarcane. As illustrated in , Test 1 serves as a control group, utilizing solely optical data. A comparative analysis between Test 1 and Test 4 reveals that the SGI can improve the total accuracy of sugarcane extraction by 6.67%, especially PA increased by 8.96%, indicating that SGI can significantly reduce the omission rate of sugarcane. Test 3 directly combined the raw VH data of SGI with optical images. Compared to Test 3, Test 4 increased F1 accuracy by 1.51%, indicating that when using the same features, constructing SGI can highlight sugarcane growth characteristics and improve classification accuracy.
Table 4. Accuracy evaluation of sugarcane extraction with different data combinations.
In addition, by comparing Tests 1–3, the band composition data of optical and SAR images can obtain higher sugarcane extraction accuracy than that of using a single type of data. The primary factor lies in the scarcity of high-quality optical data within the study area during the sugarcane growth period. Consequently, extracting the standard growth attributes of sugarcane from time series optical data becomes a challenging endeavor. Moreover, owing to the consistent imaging mechanism inherent to SAR data, it is accompanied by image speckle noise, which tends to result in diminished classification precision. By merging optical data with time-series SAR data, it becomes possible to mitigate the noise-related effects of SAR data, while simultaneously preserving the distinctive growth traits of sugarcane.
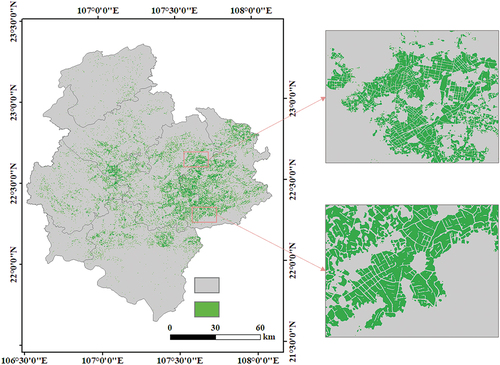
shows the classification results of sugarcane based on SGI and optical images. Sugarcane planting is mainly concentrated in the middle and east of Chongzuo City, and the planting area of Jiangzhou District and Fusui County is the majority, which is consistent with the reality of sugarcane planting in Chongzuo City.
Figure 7. Extraction results of sugarcane in Chongzuo city.
4.3. Classification for ratoon sugarcane and newly planted sugarcane
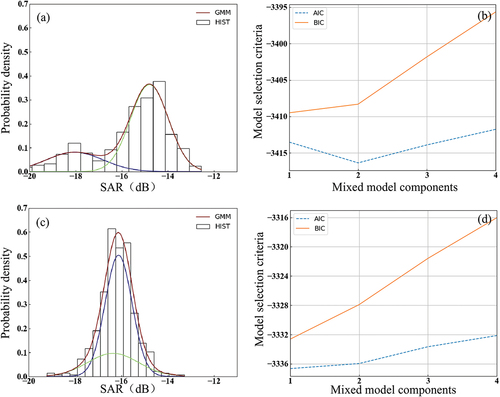
There are many differences in sugarcane phenotypes in seedlings between ratoon sugarcane and newly planted sugarcane. Therefore, the experiment involved calculating the results of the GMM fitting for the backscatter coefficient within the sugarcane area for the year 2022. To facilitate a more coherent comparison of the AIC and BIC across different periods, a normalization preprocessing step was uniformly applied, as depicted in . This involved dividing the AIC and BIC values of each group by the respective values when k = 1. After the standardization process, higher values of AIC and BIC indicate a better model fit. demonstrates that the normalized (AIC + BIC) metric of GMM distribution fitting with k = 2 on April 30th was the highest value compared with the other periods. Moreover, also exhibits that on April 30, the normalized metric with k = 2 has the best fitting effect compared to the other k values. The experiment selected SAR data from seedling stages (April 30th) and elongation stages (August 4th) to calculate the probability density map of the backscatter coefficient in the sugarcane area. Following the pre-preprocessing stage, the distribution of SAR data values typically approximates a normal distribution. However, the analysis of the backscattering coefficient probability density for sugarcane survey samples during the seedling stage (April 30th), as depicted in , reveals two distinct peaks. This observation suggests that the growth state of sugarcane can be categorized into two forms. One set of SAR values clusters around –18 dB, which is indicative of the soil backscatter coefficient. The other range peaks at approximately -15 dB, a value akin to the backscatter coefficient of sugarcane observed during the elongation stage. In the probability density map for the seedling stage, when k = 2, the AIC value was the smallest, and BIC was also at the inflection point. It was proved through AIC+BIC that the optimal GMM category for the seedling stage was 2. Similarly, the optimal category for the elongation stage was 1.
Figure 8. Normalized (AIC + BIC) metric of GMM fitting for sugarcane area in 2022.
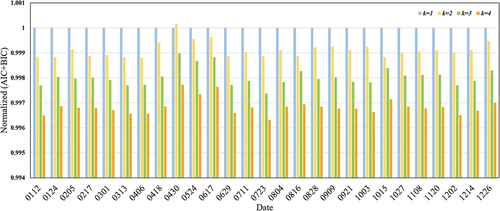
Figure 9. GMM distribution fitting diagram in the seedling stage (a), AIC+BIC metric chart in the seedling stage (b), GMM distribution fitting diagram in the elongation stage (c), and AIC+BIC metric chart in the elongation stage (d).
Jiangzhou District was selected as the research area for the classification experiment of ratoon and newly planted sugarcane since most of the field samples in this experiment were distributed in Jiangzhou District. The GMM parameters on April 30th were obtained through the EM algorithm. Based on the optimal result of sugarcane extraction in Section 3.6, the newly planted and ratoon sugarcane in Jiangzhou District were reclassified. The accuracy evaluation is shown in . The overall extraction accuracy of sugarcane is 92.18% using compensated SAR data, which is 4.96% higher than that without compensation. And the area extraction accuracy of both sugarcane types is above 80%. The area of ratoon sugarcane is about twice that of newly planted sugarcane, which is in good agreement with the actual planting situation of sugarcane.
Table 5. Accuracy evaluation of extraction of newly planted sugarcane and ratoon sugarcane in Jiangzhou district.
4.4. Estimation of sugarcane height
In the main growth period of sugarcane, the intensity of the VH backscattering coefficient was negatively correlated with plant height as shown in . The study selected the building-based multiplicative model with higher classification accuracy to correct the sequential SAR data and estimate the plant height. The estimation results in reveal good consistency among different compensation methods. The quadratic polynomial model has a better estimation accuracy than that of other regression methods. Because there is a marked increase in plant height during early growth, followed by a decrease in the growth rate of sugarcane height in mature. Moreover, the estimation accuracy of the multiplicative model was highest with R2 of 0.717 and RMSE of 0.403 m. shows error compensation can reduce the discrete degree of VH on sugarcane, which is more consistent with the trend of ground truths of plant height.
Figure 10. Estimation results of sugarcane height: without compensation (a), compensation by the additive model (b), compensation by the multiplicative model (c), and estimation results of sugarcane height (d).
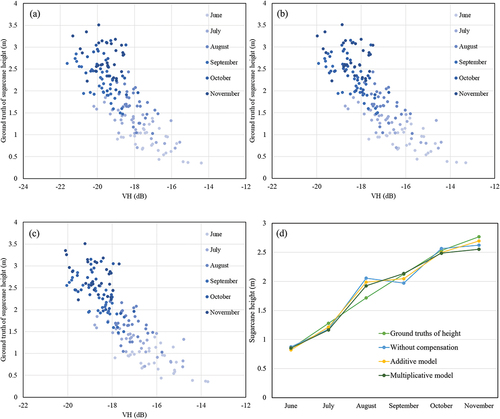
Table 6. Accuracy evaluation of sugarcane extraction with different data combinations.
5. Discussion
5.1. Applicability of error compensation under different polarization features
The study of target scattering characteristics is the foundation for SAR applications such as classification and recognition. The acquisition of polarization scattering information based on a second-order polarization matrix makes it possible to accurately describe the scattering characteristics of targets. Polarimetric target decompositions provide a powerful approach for the interpretation and analysis of complex scattering mechanisms (Ustuner and Balik Sanli Citation2019).
Sentinel-1 satellites are equipped with a dual-polarized (VV, VH) C-band SAR sensor. The scattering matrix for dual-polarized SAR systems has lower dimensionality and contains half of the polarimetric information involved in quad-polarized data. One of the commonly used polarimetric decompositions for the description of natural surfaces is the H-A-α (Cloude – Pottier) decomposition, based on the eigenvector decomposition of the T matrix (Engelbrecht et al. Citation2017).
The Cloude – Pottier decomposition separates the complex scattering into three polarimetric features, which are entropy (H), anisotropy (A), and alpha angle (α). This study uses H-A-α features from Cloude – Pottier decomposition and optical image to train the RF classifier. The results in exerted Cloude – Pottier decomposition did not result in a performance improvement, compared to the feature combination of VH and optical image. One possible explanation of this under-performance compared with VH polarization might be the fact that some polarimetric features were not adequately descriptive of the complex scattering processes of sugarcane, causing confusion to the classifier (Ioannidou et al. Citation2022).
Figure 11. Accuracy evaluation of sugarcane extraction under different feature combinations.
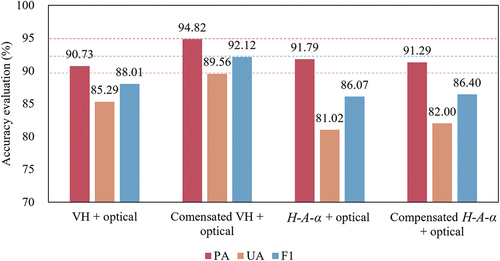
The inclusion of error compensation contributed to an improvement of 0.33 in the F1 value of H-A-α decomposition, which revealed the errors of SAR signal might vary after decomposition, and the effectiveness of the compensating model constructed by VH polarization for other polarization features will be weakened.
5.2. Importance of error compensation for SAR data
The experiment used buildings as compensation references and established additive and multiplicative models to compensate for SAR data. To compare the changes in object scattering coefficient before and after the spatio-temporal error compensation method, this study used the forest with stable backscattering coefficient and sugarcane to evaluate compensation results by calculating the Standard deviation (Std) and Coefficient of Variation (CV) on VH values in elongation stage of sugarcane. As shown in , the results of sugarcane and forest are consistent. The Std of the multiplicative model is smaller than that of the additive model. The average Std of the backscatter coefficient of the forest can be reduced to 0.581 from 0.620 using a multiplicative model.
Table 7. Evaluation of additive and multiplicative compensation models.
shows the time-series curves of sugarcane backscatter coefficients compensated using multiplicative and additive models. Both models exert some smoothing influence on the original backscatter coefficient of the sugarcane. While the additive model has a superior smoothing efficacy, the model has reduced the typical feature differences across various growth stages of the sugarcane, which leads to a decrease in the accuracy of sugarcane distribution extraction.
Figure 12. Sugarcane region comparison before and after calibration of time series SAR data.
To obtain the true polarization information that can completely describe the scattering characteristics of ground objects in SAR data, it is necessary to compensate the polarization data for correcting the influence of polarization distortion. The Amazon rainforest was an important part of spaceborne SAR radiometric calibration, which is used as the test site for the pitch antenna pattern by major spaceborne SAR such as ERS-1/2, Radarsat-1, and ENVISAT (Gupta, Sharma, and Kartikeyan Citation2017; Patel et al. Citation2006; Zhong et al. Citation2019). After radiometric calibration in preprocessing for Sentinel-1 using SNAP, an absolute radiometric accuracy of only 1 dB (3σ) can be achieved for objects with a stable backscattering coefficient (Schwerdt et al. Citation2017). However, indicated that most of the objects still show similar fluctuations in different time-series images, meaning that some errors are not removed in radiometric calibration. Li et al. used the communication signal tower with a unique structure and wide distribution to realize the measurement of the SAR image calibration constant, which can solve the regional limitation problem (Li et al. Citation2021). The calibration accuracy calculated from the high-resolution image conforms to the error standard range. However, the details of the communication signal tower in the Sentinel-1 image are not obvious, resulting in low calibration accuracy, which is 1.59 dB different from the nominal radiometric calibration constant value. Similarly, the coarse spatial resolution of Sentinel-1 can lead to inaccurate extraction of buildings, resulting in some errors in Spatio-temporal error compensation method. Forest can be the distributed target for SAR data calibration due to its large-area stability and uniformity of scattering characteristics. However, there are errors of 0.581 dB () after Spatio-temporal error compensation in this study. It indicates that the Spatio-temporal error compensation method cannot completely remove errors.
Because the phenotypic characteristics of crops vary greatly in different growth stages, the agricultural field generally chooses to use sequential data to realize the quantitative application of crops. Moreover, the constantly changing external environment such as climate, and even radar data collected from the same observation geometry, may cause different losses in the scattering coefficients of different regions. Jiang et al. applied a machine learning algorithm to sugarcane mapping using Sentinel-1A/2 time-series data (Jiang et al. Citation2019). They produced a relative accuracy of sugarcane mapping of 86.3%, which is similar to that obtained in this paper without the compensation but is about 6% lower than the mapping result using the compensation model in this paper. Therefore, it is necessary to establish error compensation methods suitable for the agricultural field. This experiment extracted the building areas throughout the entire research area and used spatial interpolation to acquire continuous calibration reference images. This Spatio-temporal error compensation method can reduce the losses of Sentinel-1 data in different regions and times and achieve more accurate crop area extraction and growth monitoring, which solves the problem of high cost and space-time limitations of Sentinel-1 data calibration.
6. Conclusions
This study proposed a spatio-temporal error compensation method for time-series Sentinel-1. For sugarcane distribution extraction, SAR data were corrected by a building-based multiplicative calibration model, and then compensated SAR data were established into SGI throughout selecting the peaks and valleys of the growth curve of sugarcane. The accuracy of sugarcane extraction using the combination of SGI and optical data was 92.12%, which is 4.11% higher than that without error compensation. Moreover, the compensated VH polarization data of sugarcane seedlings showed that the backscatter value of sugarcane in this period presented a GMM distribution. The research employed the EM algorithm to address the Gaussian issues. The outcomes of the classification process revealed that the precision of delineating ratoon sugarcane and new sugarcane regions exceeded 80% for both categories. Finally, sugarcane height estimation after Spatio-temporal error compensation with a quadratic polynomial achieved the best result with an R2 of 0.717 and an RMSE of 0.403 m. The experiment has verified that the distributed targets with stable backscattering coefficients such as building have a good compensation effect for sequential Sentinel-1 data, which contributes to improving the accuracy of sugarcane extraction and plant height estimation.
7. Future work
The Spatio-temporal error compensation and data fusion methods should be tested for other major crops and agricultural areas to evaluate broader potential.
Expansion to additional SAR platforms like ALOS-2, RADARSAT-2, and NISAR could provide the further validation and synergies across resolutions and wavelengths.
Incorporating radar-derived crop structure metrics into agro-meteorological modeling could improve yield the forecasting and farm management guidance.
Disclosure statement
No potential conflict of interest was reported by the author(s).
Data availability statement
Upon reasonable request, the corresponding author will provide access to the data used to support the study’s findings.
Additional information
Funding
Notes on contributors
Yong Hong
Yong Hong is currently working toward the PhD degree in Mapping and Remote Sensing information engineering, Wuhan University. His research interests include photogrammetry and remote sensing, intelligent perception and multi-source fusion positioning, and satellite inertial precision positioning attitude measurement.
Tianjin Xie
Tianjin Xie received MS degree in College of Resource and Environment, Huazhong Agricultural University. Her research interests include agriculture remote sensing and image processing.
Lengkun Luo
Lengkun Luo received MS degree in Hubei University of Technology. His research interests include remote sensing and space information service technology.
Mi Wang
Mi Wang is a professor at the State Key Laboratory of Information Engineering in Surveying, Mapping, and Remote Sensing, Wuhan University. He received the PhD degree from Wuhan University in 2001. His research interests include high-resolution remote sensing satellite ground processing and the integration and rapid update of photogrammetry and GIS.
Deren Li
Deren Li is a professor and chair of the Academic Committee of the State Key Laboratory for Information Engineering in Surveying, Mapping, and Remote Sensing, Wuhan University. He was selected as a member of Chinese Academy of Sciences in 1991 and a member of Chinese Academy of Engineering in 1994. He got his PhD degree from University of Stuttgart, Germany. He was awarded the title of honorary doctor from ETH, Switzerland in 2008. He has been awarded the Brock Gold Medal in recognition of outstanding contribution to photogrammetry in 2020. His research interests include photogrammetry and remote sensing, global navigation satellite system, geographic information system, and their innovation integrations and applications.
Qing Zhang
Qing Zhang is a master tutor of College of Intelligent Science and Engineering, Harbin Engineering University. His research interests include inertial navigation instruments and systems.
Ting Xu
Ting Xu is currently pursuing the MS degree at School of Geodesy and Geomatics, Wuhan University. Her research interests include agriculture remote sensing and image processing.
References
- Baghdadi, N., N. Boyer, P. Todoroff, M. El Hajj, and A. Begue. 2009. “Potential of SAR Sensors TERRASAR-X, ASAR/ENVISAT and PALSAR/ALOS for Monitoring Sugarcane Crops on Reunion Island.” Remote Sensing of Environment 113 (8): 1724–1738. https://doi.org/10.1016/j.rse.2009.04.005.
- Cai, J., and Y. Chen. 2022. “A Novel Unsupervised Deep Learning Method for the Generalization of Urban Form.” Geo-Spatial Information Science 25 (4): 568–587. https://doi.org/10.1080/10095020.2022.2068384.
- Chang, L., Y. T. Chen, J. H. Wang, and Y. L. Chang. 2021. “Rice-Field Mapping with Sentinel-1a SAR Time-Series Data.” Remote Sensing 13 (1): 103. https://doi.org/10.3390/rs13010103.
- Chen, R. K., and Z. N. Yuan. 2010. “Sugarcane Production and Research in China.” International Sugar Journal 112 (1340): 452. https://doi.org/10.5555/20103247432.
- Chen, Y., L. Feng, M. Ding, W. Mo, and Z. Kuang. 2016. “Effects of Meteorological Factors on Stalk Elongation in New-Planting and Ratooning Sugarcane.” Acta Agronomica Sinica 42 (4): 583–590. https://doi.org/10.3724/SP.J.1006.2016.00583.
- Contreras, A. M., E. Rosa, M. Pérez, H. Van Langenhove, and J. Dewulf. 2009. “Comparative Life Cycle Assessment of Four Alternatives for Using By-Products of Cane Sugar Production.” Journal of Cleaner Production 17 (8): 772–779. https://doi.org/10.1016/j.jclepro.2008.12.001.
- Deng, Y., X. Liu, Y. Huang, B. Fang, W. Lu, F. Zhang, M. Ding, and J. Wu. 2022. “Investigation on Sugarcane Production in Chongzuo Sugarcane District of Guangxi in 2022.” China Seed Industry 331 (10): 48–51. https://doi.org/10.19462/j.cnki.1671-895x.2022.10.039.
- Diao, Z., P. Guo, B. Zhang, D. Zhang, J. Yan, Z. He, S. Zhao, and C. Zhao. 2023. “Maize Crop Row Recognition Algorithm Based on Improved UNet Network.” Computers and Electronics in Agriculture 210:107940. https://doi.org/10.1016/j.compag.2023.107940.
- El Hajj, M., N. Baghdadi, M. Zribi, and S. Angelliaume. 2016. “Analysis of Sentinel-1 Radiometric Stability and Quality for Land Surface Applications.” Remote Sensing 8 (5): 406. https://doi.org/10.3390/rs8050406.
- Engelbrecht, J., A. Theron, L. Vhengani, and J. Kemp. 2017. “A Simple Normalized Difference Approach to Burnt Area Mapping Using Multi-Polarisation C-Band SAR.” Remote Sensing 9 (8): 764. https://doi.org/10.3390/rs9080764.
- Fawakherji, M., C. Potena, D. D. Bloisi, M. Imperoli, A. Pretto, and D. Nardi. 2019. “UAV Image Based Crop and Weed Distribution Estimation on Embedded GPU Boards.” Paper presented at the Proceedings of the Computer Analysis of Images and Patterns (CAIP), Salerno, Italy, September 3–5. https://doi.org/10.1007/978-3-030-29930-9_10.
- Gella, G. W., W. Bijker, and M. Belgiu. 2021. “Mapping Crop Types in Complex Farming Areas Using SAR Imagery with Dynamic Time Warping.” ISPRS Journal of Photogrammetry & Remote Sensing 175:171–183. https://doi.org/10.1016/j.isprsjprs.2021.03.004.
- Greatbatch, I. 2012. “Polarimetric Radar Imaging: From Basics to Applications.” International Journal of Remote Sensing 33 (2): 661–662. https://doi.org/10.1080/01431161.2010.535193.
- Gupta, M., A. Sharma, and B. Kartikeyan. 2017. “Evaluation of RISAT-1 SAR Radiometric Calibration Using Extended Amazon Rainforest.” The Journal of the Indian Society of Remote Sensing 45:195–207. https://doi.org/10.1007/s12524-016-0582-5.
- Hassan, M., N. Fiaz, M. A. Mudassir, and M. Yasin. 2017. “Exploring the Ratooning Potential of Sugarcane (Saccharum Officinarum L.) Genotypes Under Varying Harvesting Times of Plant Crop.” Pakistan Journal of Agricultural Research 30:303–309. https://doi.org/10.17582/JOURNAL.PJAR/2017.30.3.303.309.
- Holecz, F., E. H. Meier, J. Piesbergen, D.-I. S. Nisch, and J. Moreira. 1994. “Rigorous Derivation of Backscattering Coefficient.” Paper presented at the Proceedings of the CEOS SAR Calibration Workshop, Ann Arbor, MI, USA, September 28–30.
- Hong, Y., D. Li, M. Wang, H. Jiang, L. Luo, Y. Wu, C. Liu, T. Xie, Q. Zhang, and Z. Jahangir. 2022. “Cotton Cultivated Area Extraction Based on Multi-Feature Combination and CSSDI Under Spatial Constraint.” Remote Sensing 14 (6): 1392. https://doi.org/10.3390/rs14061392.
- Ioannidou, M., A. Koukos, V. Sitokonstantinou, I. Papoutsis, and C. Kontoes. 2022. “Assessing the Added Value of Sentinel-1 PolSAR Data for Crop Classification.” Remote Sensing 14 (22): 5739. https://doi.org/10.3390/rs14225739.
- Ji, Y., F. Zhang, W. Zhang, L. Zhao, K. Xu, J. Shi, G. Huang, Q. Jing, L. Wang, and F. Yang. 2024. “Exploring Optimal Combinations of Multi-Frequency Polarimetric SAR Observations to Estimate Forest Above-Ground Biomass.” Geo-Spatial Information Science. https://doi.org/10.1080/10095020.2024.2311867.
- Jiang, H., D. Li, W. L. Jing, J. H. Xu, J. X. Huang, J. Yang, and S. S. Chen. 2019. “Early Season Mapping of Sugarcane by Applying Machine Learning Algorithms to Sentinel-1A/2 Time Series Data: A Case Study in Zhanjiang City, China.” Remote Sensing 11 (7): 861. https://doi.org/10.3390/rs11070861.
- Kimura, H., K. P. Papathanassiou, and I. Hajnsek. 2005. “Polarization Orientation Effects in Urban Areas on SAR Data.” Paper presented at the Proceedings of the IEEE International Geoscience and Remote Sensing Symposium, Seoul, South Korea, July 25–29. https://doi.org/10.1109/IGARSS.2005.1526763.
- Klein, J. D. 1992. “Calibration of Complex Polarimetric SAR Imagery Using Backscatter Correlations.” IEEE Transactions on Aerospace and Electronic Systems 28 (1): 183–194. https://doi.org/10.1109/7.135444.
- Li, H., X. Yuan, Y. Han, J. Chen, and X. Chen. 2019. “Monitoring of Sugarcane Crop Based on Time Series of Sentinel-1 Data.” Paper presented at the Proceedings of the 2019 SAR in Big Data Era (BIGSARDATA), Beijing, China, August 05–06. https://doi.org/10.1109/BIGSARDATA.2019.8858450.
- Li, J., Y. Li, Q. Zhao, H. Jiang, and Y. Hong. 2021. “SAR Image Absolute Radiometric Calibration Based on RCS Modeling of Communication Tower.” Geomatics and Information Science of Wuhan University 46 (11): 1746–1755. https://doi.org/10.13203/j.whugis20210052.
- Liao, C., J. Wang, J. Shang, X. Huang, J. Liu, and T. Huffman. 2018. “Sensitivity Study of Radarsat-2 Polarimetric SAR to Crop Height and Fractional Vegetation Cover of Corn and Wheat.” International Journal of Remote Sensing 39 (5): 1475–1490. https://doi.org/10.1080/01431161.2017.1407046.
- Long, D. G., and G. B. Skouson. 1996. “Calibration of Spaceborne Scatterometers Using Tropical Rain Forests.” IEEE Transactions on Geoscience & Remote Sensing 34 (2): 413–424. https://doi.org/10.1109/36.485119.
- Meng, H. R., C. J. Li, Y. Liu, Y. S. Gong, W. Y. He, and M. X. Zou. 2023. “Corn Land Extraction Based on Integrating Optical and SAR Remote Sensing Images.” The Land 12 (2): 398. https://doi.org/10.3390/land12020398.
- Moriyama, T., M. Shimada, M. Watanabe, T. Tadono, H. Kimura, M. Satake, and S. Uratsuka. 2006. “The Application of Polarimetric Calibration Using Polarimetric Scattering Characteristics of Urban Areas to ALOS PALSAR.” Paper presented at the Proceedings of the IEEE International Geoscience and Remote Sensing Symposium (IGARSS), Denver, CO, USA. July 31-August 04. https://doi.org/10.1109/igarss.2006.94.
- Nasirzadehdizaji, R., F. Balik Sanli, S. Abdikan, Z. Cakir, A. Sekertekin, and M. Ustuner. 2019. “Sensitivity Analysis of Multi-Temporal Sentinel-1 SAR Parameters to Crop Height and Canopy Coverage.” Applied Sciences 9 (4): 655. https://doi.org/10.3390/app9040655.
- Ndikumana, E., D. Ho Tong Minh, H. T. Dang Nguyen, N. Baghdadi, D. Courault, L. Hossard, and I. El Moussawi. 2018. “Estimation of Rice Height and Biomass Using Multitemporal SAR Sentinel-1 for Camargue, Southern France.” Remote Sensing 10 (9): 1394. https://doi.org/10.3390/rs10091394.
- Patel, N., L. Hong, W. Jones, and S. Vasudevan. 2006. “Evaluation of the Amazon Rain Forrest as a Distributed Target for Satellite Microwave Radiometer Calibration.” Paper presented at the Proceedings of the IEEE International Symposium on Geoscience and Remote Sensing, Denver, CO, USA, July 31-August 04. https://doi.org/10.1109/IGARSS.2006.27.
- Phan, H., T. L. Toan, A. Bouvet, L. D. Nguyen, T. P. Duy, and M. Zribi. 2018. “Mapping of Rice Varieties and Sowing Date Using X-Band SAR Data.” Sensors 18 (1): 316. https://doi.org/10.3390/s18010316.
- Schwerdt, M., K. Schmidt, N. Tous Ramon, P. Klenk, N. Yague-Martinez, P. Prats-Iraola, M. Zink, and D. Geudtner. 2017. “Independent System Calibration of Sentinel-1B.” Remote Sensing 9 (6): 511. https://doi.org/10.3390/rs9060511.
- Shorachi, M., V. Kumar, and S. C. Steele-Dunne. 2022. “Sentinel-1 SAR Backscatter Response to Agricultural Drought in the Netherlands.” Remote Sensing 14 (10): 2435. https://doi.org/10.3390/rs14102435.
- Som-Ard, J., C. Atzberger, E. Izquierdo-Verdiguier, F. Vuolo, and M. Immitzer. 2021. “Remote Sensing Applications in Sugarcane Cultivation: A Review.” Remote Sensing 13 (20): 4040. https://doi.org/10.3390/rs13204040.
- Sun, B., P. Qin, C. Li, Z. Gao, A. Grainger, X. Li, Y. Wang, and W. Yue. 2023. “Integrating Vegetation Phenological Characteristics and Polarization Features with Object-Oriented Techniques for Grassland Type Identification.” Geo-Spatial Information Science. https://doi.org/10.1080/10095020.2023.2250378.
- Tao, L., S. Qu, and X. Chen. 2016. “The Progress on Research of Polarimetric SAR Calibration.” Remote Sensing and Application 31 (3): 459–467. https://doi.org/10.11873/j.issn.1004-0323.2016.3.0459.
- Tur, M., K.-C. Chin, and J. W. Goodman. 1982. “When is Speckle Noise Multiplicative?” Applied Optics 21 (7): 1157–1159. https://doi.org/10.1364/AO.21.001157.
- Useya, J., and S. Chen. 2019. “Exploring the Potential of Mapping Cropping Patterns on Smallholder Scale Croplands Using Sentinel-1 SAR Data.” Chinese Geographical Science 29:626–639. https://doi.org/10.1007/s11769-019-1060-0.
- Ustuner, M., and F. Balik Sanli. 2019. “Polarimetric Target Decompositions and Light Gradient Boosting Machine for Crop Classification: A Comparative Evaluation.” ISPRS International Journal of Geo-Information 8 (2): 97. https://doi.org/10.3390/ijgi8020097.
- Van Zyl, and J. Jakob. 1990. “Calibration of Polarimetric Radar Images Using Only Image Parameters and Trihedral Corner Reflector Responses.” IEEE Transactions on Geoscience & Remote Sensing 28 (3): 337–348. https://doi.org/10.1109/36.54360.
- Wang, L., L. Sun, R. Gong, and D. Zhu. 2021. “Error Analysis in SAR Imaging Due to Fluctuation of Atmospheric Refractive Index.” Journal of Electronics and Information Technology 43 (3): 665–673. https://doi.org/10.1080/01431161.2017.1407046.
- Wang, M., Y. Chen, X. Chang, X. Long, and Q. Li. 2017. “High Accuracy On-Orbit Geometric Calibration of Geostationary Satellite GF4.” Acta Geodaetica et Cartographica Sinica 46 (1): 53–61. https://doi.org/10.11947/j.AGCS.2017.20160300.
- Xu, F., Z. Wang, G. Lu, R. Zeng, and Y. Que. 2021. “Sugarcane Ratooning Ability: Research Status, Shortcomings, and Prospects.” Biology 10 (10): 1052. https://doi.org/10.3390/biology10101052.
- Xu, L., H. Zhang, C. Wang, B. Zhang, M. Liu, and Ieee. 2017. “Corn Mapping Using Multi-Temporal Fully and Compact SAR Data.” Paper presented at the Proceedings of the SAR in Big Data Era - Models, Methods and Applications (BIGSARDATA), Beijing, China, November 13–14. https://doi.org/10.1109/BIGSARDATA.2017.8124925.
- Yeasin, M., D. Haldar, S. Kumar, R. K. Paul, and S. Ghosh. 2022. “Machine Learning Techniques for Phenology Assessment of Sugarcane Using Conjunctive SAR and Optical Data.” Remote Sensing 14 (14): 3249. https://doi.org/10.3390/rs14143249.
- Yuan, Y., L. Lin, Z. G. Zhou, H. J. Jiang, and Q. S. Liu. 2023. “Bridging Optical and SAR Satellite Image Time Series via Contrastive Feature Extraction for Crop Classification.” ISPRS Journal of Photogrammetry & Remote Sensing 195:222–232. https://doi.org/10.1016/j.isprsjprs.2022.11.020.
- Zhang, J., T. Xie, C. Yang, H. Song, Z. Jiang, G. Zhou, D. Zhang, H. Feng, and J. Xie. 2020. “Segmenting Purple Rapeseed Leaves in the Field from UAV RGB Imagery Using Deep Learning as an Auxiliary Means for Nitrogen Stress Detection.” Remote Sensing 12 (9): 1403. https://doi.org/10.3390/rs12091403.
- Zhang, P., S. Q. Zhang, and Ieee. 2013. “Impact on Polarimetric SAR Calibration of SAR Superresolution Imaging Algorithm.” Paper presented at the Proceedings of the IEEE International Geoscience and Remote Sensing Symposium (IGARSS), Melbourne, Australia, July 21–26. https://doi.org/10.1109/igarss.2013.6723353.
- Zhang, X., B. F. Wu, G. E. Ponce-Campos, M. Zhang, S. Chang, and F. Y. Tian. 2018. “Mapping Up-To-Date Paddy Rice Extent at 10 M Resolution in China Through the Integration of Optical and Synthetic Aperture Radar Images.” Remote Sensing 10 (8): 1200. https://doi.org/10.3390/rs10081200.
- Zhong, L., X. Qiu, B. Han, Y. Hu, A. Chen, and C. Ding. 2019. “ScanSAR Radiometric Correction and Analysis of GaoFen-3.” Paper presented at the Proceedings of the 6th Asia-Pacific Conference on Synthetic Aperture Radar (APSAR), Xiamen, China, November 26–29. https://doi.org/10.1109/APSAR46974.2019.9048335.
- Zhou, L., Z. Shao, S. Wang, and X. Huang. 2022. “Deep Learning-Based Local Climate Zone Classification Using Sentinel-1 SAR and Sentinel-2 Multispectral Imagery.” Geo-Spatial Information Science 25 (3): 383–398. https://doi.org/10.1080/10095020.2022.2030654.
- Zhu, M. Q., B. She, L. S. Huang, D. Y. Zhang, H. F. Xu, and X. Y. Yang. 2022. “Identification of Soybean Based on Sentinel-1/2 SAR and MSI Imagery Under a Complex Planting Structure.” Ecological informatics 72:101825. https://doi.org/10.1016/j.ecoinf.2022.101825.