Article title: “Analyzing shoreline dynamicity and the associated socioecological risk along the Southern Odisha Coast of India using remote sensing-based and statistical approaches”
Authors: Manoranjan Mishra, Tamoghna Acharyya, Pritam Chand, Celso Augusto Guimarães Santos, Dipika Kar, Prabhu Prasad Das, Namita Pattnaik, Richarde Marques da Silva and Thiago Victor Medeiros do Nascimento
Journal: Geocarto International
DOI: 10.1080/10106049.2021.1882005
When this article was first published online, the , and are incorrect. There are also minor changes in the text throughout the article.
Table 1. Details of the used satellite datasets with scene ID, acquisition time and date, spatial resolution, and mean tidal height at acquisition time.
Below are the corrected versions of , and .
The online version of this article has been corrected.
Figure 9. (a) Shoreline change along the transects near Podampetta in the 1990-2019 period; (b) shoreline change along the transects near Podampetta in 2011; (c) shoreline change along transects near Podampetta in 1990, 1995, 2000, 2005, 2010, 2015 and 2019; (d) shoreline change along Ramyapatna village in the 1990-2019 period; (e) shoreline change along Ramyapatna village in 2016, (f) shoreline change along Ramyapatna village in 1990, 1995, 2000, 2005, 2010, 2015 and 2019
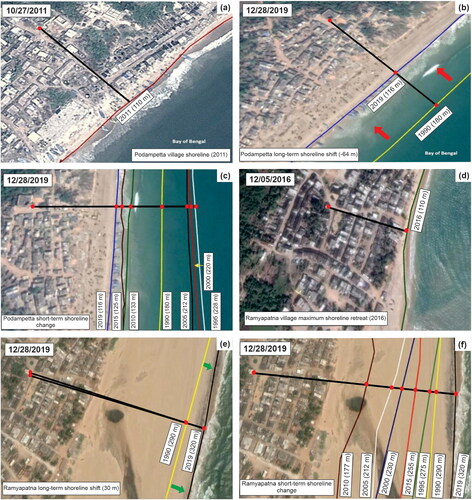
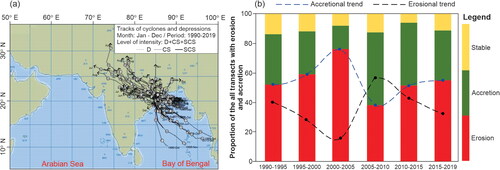
Figure 11. (a) Map showing the tracks of the cyclonic storms that passed through Odisha during the period of study (Source: Cyclone E-atlas, IMD (2020)) and (b) Phases of erosion and accretion (1990–2019).