
 ?Mathematical formulae have been encoded as MathML and are displayed in this HTML version using MathJax in order to improve their display. Uncheck the box to turn MathJax off. This feature requires Javascript. Click on a formula to zoom.
Abstract
This study used GIS and remote sensing to establish DDI model based on vegetation cover Index (NDVI) and Surface Albedo (Albedo) normalization to evaluate in the Gelintan Oasis of Inner Mongolia past 30 years. Use Jenks Natural Breaks Method classified as undesertified land, slightly desertified land, moderately desertified land and severely desertified land. Used the Mann-Kendall test, the impact of climate change on land desertification in the study area was discussed. The results showed that, the Gelintan Oasis consisted primarily of moderately desertified land but the dominant land type shifted to severely desertified land from 2006 to 2016; Moderately desertified land occurs in the desert-oasis ecotone; Moderately desertified land showed pronounced expansions and contractions in area. In the future, we hope to provide more perfect data support for desertification control by using longer time series data to explore the relationship between desertification and climatic or human factors.
1. Introduction
Desertification is a form of land degradation of desert-like landscapes in arid areas and their environs due to the combined effects of climatic fluctuations and human activities (Wang Citation2004; Goudie Citation2011). Desertification is one of the most serious land use problems facing the world today. Continuous expansion of desertified land has impaired economic development and reduced living standards. Given the extent of the world’s deserts, both researchers and governments have sought ways to prevent and control desertification. According to the latest statistics, desertification has impacted 36 million km2, accounting for one quarter of the world’s total land area. Desertification continues to expand at a rate of 50,000–70,000 km2 each year. This phenomenon impacts 200 million people, particularly in Middle Eastern and Central Asian countries, where desertification has overtaken more than half of the land area of some countries (Wang Citation2018). Ecological and environmental problems caused by desertification threaten communication, industry, trade and geopolitical stability.
Faced with this problem, some countries have taken measures to prevent and control desertification. Japan once planted a 200-meter-wide coastal shelter forest to stabilize 0.3 million hm2 of mobile dunes. Since 1965, Germany has developed forests on a large-scale as coastal wind break and sand control systems. During the mid-19th century, more than 300,000 hm2 of forest were planted across six states in the central United States as part of the “Roosevelt Project.” In the early 20th century, the Soviet Union began the “Stalin project to transform nature.” In 1970, five North African countries (Algeria, Libya, Morocco, Tunisia and Egypt) implemented the “Green dam project” to build a 300,000 hm2 shelter belt to manage the northern perimeter of the Sahara Desert. China hosts the largest area subject to desertification and the largest human population at risk. Chinese deserts also experience the most severe sandstorms. The Chinese government has prioritized prevention and control of desertification through a series of measures which have shifted the proverbial situation of “sand advancing and people retreating” to “green advancing and sand retreating” (Zhang Citation2019).
Strategies for controlling desertification have found that success depends on water allocation, soil resources, environmental factors and geographic conditions in at-risk areas. Carrying capacity or general limitations in environmental resources are important situational factors in sustainably managing desertification. Areas subject to severe desertification often experience harsh environmental conditions and have limited access to transportation. Limited access to scientific and technological resources may also preclude timely investigation of sensitive areas, especially those subject to rapid human development. The development of remote sensing technology (e.g., RS, GIS, GPS) has played an important role in detecting and monitoring desertification (Sayl Citation2018). These technologies are cost effective and more accurate than traditional approaches. Establishment of a desertification evaluation index system in 1984 by the Food and Agriculture Organization of the United Nations and UNESCO allowed for rigorous designation of desertification status and quantification of desertification rate, risk and human and animal pressures (Yang and Sun Citation2006). Ellen Percy Grainger and others divided the degree of desertification into three grades (slight, moderate and severe) based on geographic factors, development, ecology and land surface morphology (Bai Citation1993). Expanded access to satellite data has allowed for dynamic monitoring of desertification and more quantitative designation of desertification degree (Zhang and Su Citation2010; Huang et al. Citation2015; Shao and Jiang Citation2018). Remote sensing methods can detect desertification in early stages using both visual interpretation of texture, tone, shadow and quantitative relationships among adjacent land types. Combined with other data, remote sensing provides accurate, timely and cost effective estimates of desertification (Zaki et al. Citation1995; Ma and Han Citation1996; Cha and Gao Citation1997; Wang et al. Citation1998; Qi et al. Citation2003). Researchers tend to use visual, qualitative approaches in designating desertified land (Jian et al. Citation2006; Wang Citation2012; Wu Citation2015; Cui et al. Citation2018). In monitoring the spatial extent of desertified land in Chaoyan, Wang Rongbao and others found that vegetation coverage influenced land classification results (Wang and Chen Citation2016). Using Remote Sensing, GIS technology and geostatistical approaches, Wang Yugang and others described the dynamics of land degradation in an agricultural, desert-oasis ecotone (Wang et al. Citation2007). The DDI is Desertification Difference Index and constructs the Albedo-NDVI feature space (Pan and Qin Citation2010), the study shows that there is a strong negative correlation between land surface Albedo and vegetation index (Zou et al. Citation2019), moreover, the model can automatically extract desertification land information from remote sensing images, the method avoids the error caused by the classification of spectral information of single index and has good maneuverability (Wang et al. Citation2016).
Following previous research, this study used RS and GIS technology (Sayl et al. Citation2021) to construct a DDI model based on Jenks Natural Breaks classification of the degree of desertification in and around the Gelintan Oasis. The results show spatio-temporal evolution of desertified land over the last 30 years. Statistical analysis of results showed correlations between desertified land and climatic factors.
The aim of this study is to use a desertificational Difference Index (DDI) model based on vegetation cover Index (NDVI) and Surface Albedo (Albedo) normalization to evaluate in and around the Gelintan Oasis of Inner Mongolia past 30 years. Results can inform government desertification control policies and evaluations of mitigation projects. They also demonstrate effective monitoring strategies for similar areas.
2. Site description
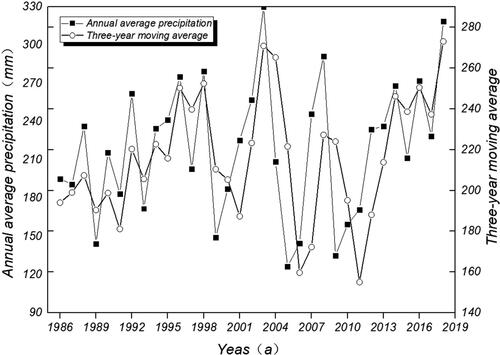
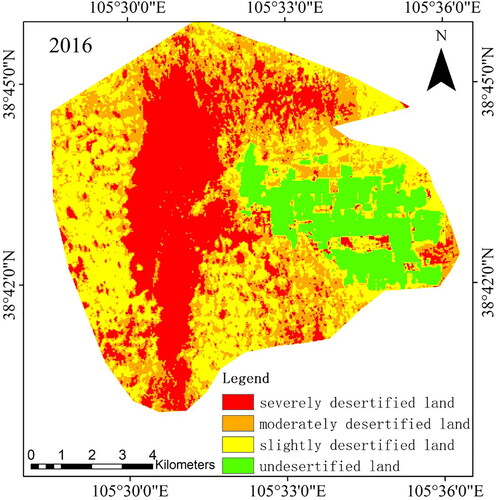
The study area is located in Alxa Left Banner of Inner Mongolia along the southeastern border of the Tengger Desert (38°43′33″N, 105°31′27″E; altitude approx. 1370 m) (). The Gelintan Oasis lies in the east of the region. Semi-stable Nitraria sand dunes buffer the north side of the desert-oasis ecotone. The middle of the area consists of a mobile dune belt spanning about 3 km from north to south. Stable sand dunes lie further to the west of the oasis. The study area categorizes as a temperate desert with an arid climate that is undergoing desertification. In addition to dry conditions, the area also experiences high winds, high rates of aeolian sediment transport, large diurnal temperature variations and extended periods of daylight in the summer. The annual average temperature is 7.7 °C (). The average and maximum temperatures in January are −11 °C and −25.2 °C, respectively, and the average and maximum temperatures in July are 23.5 °C and 35.6 °C, respectively. The frost-free season lasts for 187.5 days and annual precipitation (), occurring mainly from July to September, is 210 mm. Annual evaporation is 2362.7 mm, a value that exceeds the annual precipitation by a factor of more than 10. The annual average wind velocity is 3.1 m/s and the maximum wind velocity is 17.9 m/s. Meteorological factors that promote local plant growth are sufficient sunlight and significant temperature variation. The maximum daily temperature difference is 31.5 °C and the annual cumulative temperature greater than 10 °C is 3004.5 °C. The zonal soil is mainly grey-desert soil. The study area hosts simple, single type vegetation structure. The main plant types are Artemisia sieversiana Ehrhart ex Willd., Agriophyllum squarrosum (Linn.) Moq., Hedysarum scoparium Fisch. et Mey., Haloxylon ammodendron (C. A. Mey.) Bunge and Nitraria tangutorum Bobr (Xie et al. Citation2019).
Figure 1. Map showing the location of the study area in Alxa League, Inner Mongolia.
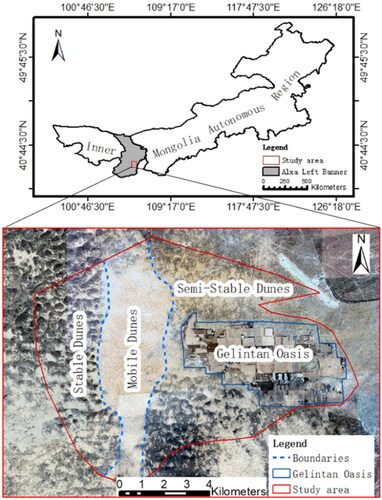
Figure 2. Annual mean temperature in the study area.
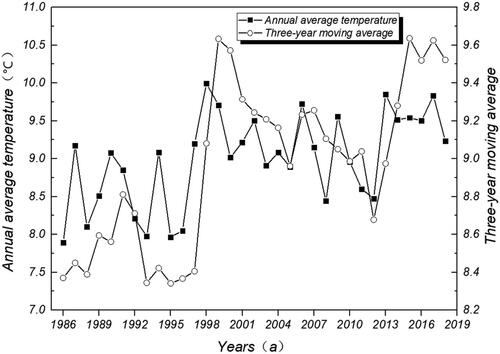
Figure 3. Annual mean precipitation in the study area.
3. Materials and methods
3.1. Data sources
The data used for this study are minimal and can be divided into two major categories, that is, satellite images and meteorological data. Satellite images that include the operational land imager sensor (Landsat 8), were provided by the United States Geological Survey (USGS). The OLI and ETM + provide data at a spatial resolution of 30 m for visible, near infrared (NIR), and short-wave infrared, and of 15 m for panchromatic bands (Modica et al. Citation2016; Ozelkan et al. Citation2016).Growth of vegetation in autumn allowed for enhanced detection of desertification. Data from August to September were therefore analyzed.
The China Meteorological Administration Meteorological Data Centre (http://data.cma.cn/) provided meteorological data. These included temperature, precipitation, evaporation, relative humidity, average wind velocity, days of strong wind and days experiencing sandstorm conditions.
3.2. Data processing
3.2.1. Image data processing
Errors sources in the data included image distortion caused by the sensor angle and its structure, atmospheric refraction and reflection, earth rotation and terrain variation. Preprocessing of the original remote sensing image prior to analysis helped reduce some of these errors. These operations included radiometric calibration, atmospheric correction, geometric correction and other steps.
3.2.2. DDI calculations
In this study, the NDVI (Wu et al. Citation2014) and Albedo (Ma et al. Citation2011)were used to determine desertification. Normalized results were analyzed for their quantitative relationships. A DDI model which is Desertification Difference Index and constructs the Albedo-NDVI feature space (Pan and Qin Citation2010) was then constructed. DDI thresholds were divided based on field data and using the Jenks Natural Breaks method. This approached yielded four types of land: undesertified land, slightly desertified land, moderately desertified land and severely desertified land.
NDVI was calculated by using red and near-infrared reflection values. The formula was:
(1)
(1)
Where B3 is the red band and B4
is the near-infrared band.
This research estimated Albedo using a Landsat-TM data retrieval model established by Liang (Citation2001). The formula was:
(2)
(2)
Where ρB1、ρB3
、ρB4
、ρB5
and
ρB7 are variables representing different bands, respectively.
In order to facilitate the later data processing and the characteristic space establishment, NDVI and Albedo were normalized as follows:
(3)
(3)
Where N is normalized NDVI, NDVImin is the minimum normalized NDVI and NDVImax
is the maximum normalized NDVI. For the equation
(4)
(4)
A is the normalized Albedo,
Albedomin is the minimum normalized Albedo value and
Albeldomax is the maximum normalized Albedo value.
Quantitative relationships between Albedo and NDVI (Liu et al. Citation2019) were analyzed by modeling correlations between normalized Albedo and NDVI. This approach used the linear expression:
(5)
(5)
Where a and
are used below.
To calculate DDI, the term k was calculated as a×k=-1.
DDI was then estimated as:
(6)
(6)
3.2.3. Land use dynamic degree
The dynamic degree quantitatively expresses changes in degree of desertification over a given time frame according to different variables. Terms for rates of change in land use type per unit time help determine the role of specific land use in regional change. In the formula:
(7)
(7)
K is the dynamic degree of a certain type of desertified land over a given period. Ub and Ua represent the area of a certain type of desertified land at the beginning and end of the study period (b and a respectively) and T is the annual rate of change in the land type.
3.2.4. Climate factor mutation test
The climate factor mutation test requires the sequence:
(11)
(11)
Where:
(12)
(12)
With Statistical Variables:
(13)
(13)
Where: (14)
(15)
(15)
UFk represents a normal distribution. For the significance level α,
from UFk>Uα ,
the sequence x
is sorted in reverse order. According to the above calculation, this gives:
(16)
(16)
UFk and UBk
represent statistical series of climate parameter x
which record the time and region of mutation. Postive UFk
values indicate increasing trends while negative UFk
values indicate decreasing trends. Changes become more obvious outside of critical thresholds. The intersection between UFk
and UBk
occurs between critical lines and represents the initiation of mutation.
4. Construction of the DDI model
Construction of the DDI model begins with preliminary inspection of the spatial distribution of desertification from NDVI-Albedo images. The ROI tool in the ENVI 5.3 image processing software was used to extract NDVI and Albedo from 500 randomly selected points in the study area. Scatter diagrams then showed NDVI versus Albedo for the study area from 1986 to 2016 ().
Figure 4. Plots of NDVI versus Albedo from 1986 to 2016.
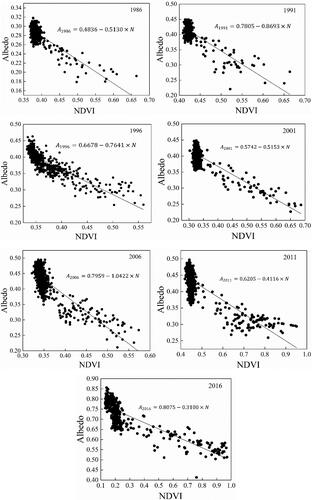
Formulas 5 and 6 above gave linear equations estimated from Albedo and NDVI data (the DDI model). lists results for the observational years.
Table 1. Estimates of desertification degree in study area from 1986 to 2016.
5. Results and discussion
5.1. Changes in desertified land area
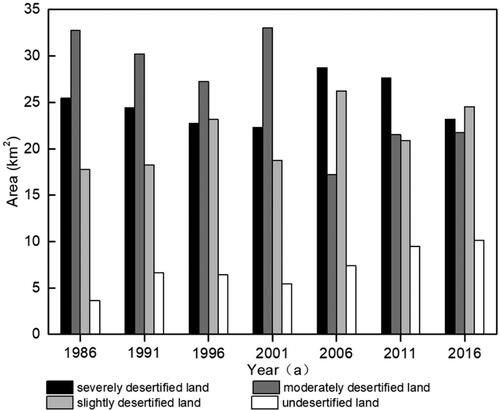
Model results () indicate that the study area contained 79.54 km2 of desertified land. From 1986 to 2001, most desertified land categorized as moderately desertified, a land type that spanned an area of 32.73, 30.19, 27.24 and 33.05 km2, or 41.15%, 37.96%, 34.25% and 41.56% of the total area of the study area. From 2006 to 2016, severely desertified land became the most common type of desertified land. For the 2006, 2011 and 2016, severely desertified land occupied 28.72, 27.63 and 23.18 km2 and accounted for 36.11%, 34.74% and 29.12% (respectively) of the total area analyzed. From 1986 to 2001, severely desertified land decreased continuously with a cumulative reduction of 3.13 km2. The area of severely desertified land increased sharply from 2001 to 2006 at a rate of 5.74 km2/a. The area occupied by moderately desertified land (17.23 km2) decreased sharply at a rate of 3.16 km2/a from 2006 relative to 2001. In 1986 and 1991, the study area contained 17.74 km2 and 18.29 km2 of slightly desertified land (respectively). These were to lowest estimates of desertified land observed and accounted for 22.30% and 22.39% of the total area analyzed. From 1991 to 2016, slightly desertified land showed alternating increasing and decreasing patterns every five years. Slightly desertified land increased from 18.75 km2 in 2001 to 26.212 km2 in 2006 giving a rate was 1.49 km2/a. Undesertified land area also varied throughout the study period.
Figure 5. Desertified land area from 1986 to 2016.
5.2. The dynamic degree change of desertified land
lists dynamic degree estimates for land types in the study area. Severely desertified land increased sharply in 2006 when the dynamic degree values reached 5.75%. Severely desertified land showed pronounced decreases in 2016 and 1996 as indicated by dynamic degree values of −3.22% and −1.38%, respectively. Moderately desertified land showed a pronounced decrease in 2006 with a dynamic degree of −9.57%. Dynamic degree values of 4.99% and 4.26% then indicate sharp increases in 2011 and 2001. Moderately desertified land did not show obvious changes in 1991 (dynamic degree value of 0.62%) but showed obvious changes in other years. Slightly desertified land showed rapid increase in 2006 (dynamic degree value of 7.99%). Dynamic degree values of 5.34%, −4.05%, −3.81% and 3.46% in 1996, 2011, 2001 and 2016 (respectively) help contextualize this trend. Undesertified land occupies a relatively small proportion of the study area and consists primarily of farmland, residential land and subsidiary land. Changes in undesertified land area therefore depend on human factors. The model estimated a dynamic degree value of 16.42% for undesertified land in 1991. Dynamic degree values for undesertified land decreased with time (7.14% in 2006 > 5.7% in 2011 > 1.38% in 2016). Undesertified land also decreased in 1996 and 2001 (−2.98% and −0.75%, respectively) but at a higher rate than that observed from 2001 data.
Table 2. Dynamic degree of desertified land (%).
5.3. Spatial distribution of desertified land
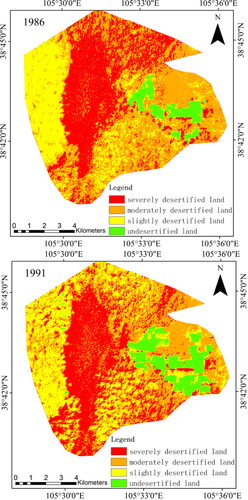
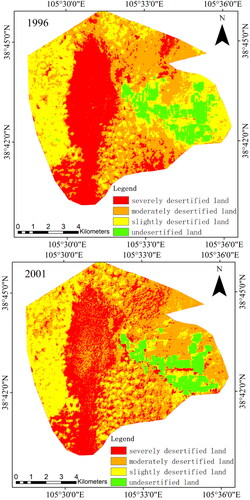
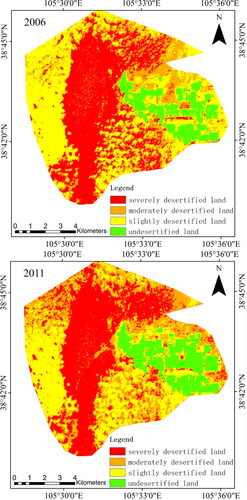
shows severely desertified land in the study area distributed primarily in the central region and around the western periphery of the Gelintan Oasis. Vegetation coverage in this area is low, and large, mobile dunes are the main geomorphic features. Moderately desertified land occurs primarily around the periphery of the oasis and in the east of the study area. This land type consists mostly of semi-fixed shrub dunes. Slightly desertified land occurs primarily in the west of the study area or in the east of the study area where it intersperses with moderately desertified land. Undesertified land occurs primarily in the oasis hinterland and the eastern part of the study area, which serves as Gelintan Oasis farmland. Data from 1986 include a large area of severely desertified land with moderately desertified areas occurring around the margins of the oasis. Encroachment of these areas had the potential to diminish the relatively small area of undesertified land. By 1991, moderately desertified land north and south of the study area had transitioned to slightly desertified land. The oasis area expanded gradually by 1996 due to enhanced protective and desertification control measures around the desert-oasis The desert-oasis ecotone showed a general trend of moderately desertified land becoming slightly desertified land. Data from 2001, showed a transition of moderately desertified land to severely desertified land in the desert-oasis ecotone, as well as around the northern and southern periphery of the oasis. Severely desertified land in the middle region of the study area transitioned to moderately desertified land. This transition likely reflected vegetation growth in depressions between dunes during the rainy season. Data from 2011 show moderately desertified land transitioning to severely desertified land in the north of the study area and south of the oasis. Severely desertified land to the north continued to expand. The area of severely desertified land and slightly desertified land decreased. The oasis area expanded with development of protective forests around farmland. Severely desertified areas south of the oasis showed the tendency to transition from moderately to slightly desertified land. Data from 2016 show severely desertified land on the periphery of the oasis shifting to moderately and slightly desertified land. The expansion of the oasis area may limit climatic and environmental factors in desertification but gradual decline of the forest protective belt and the ecotone region around the oasis contributed to desertification in the study area.
Figure 6. Spatial distribution of desertified and undesertified land.
5.4. Temporal changes in land type
lists the transitional dynamics between different land types in and around the Gelintan Oasis. Moderately desertified land showed the greatest degree of change while undesertified land showed the least amount of change indicating this latter land type was the most stable. From 1986 to 1991, 11.87 km2 became moderately desertified and 14.41 km2 ceased to be moderately desertified. These areas accounted for 40.78% and 48.76% of the total area of land changed during this period. A total of 7.89 km2 accounting for 25.70% the total area of land changed ceased to be severely desertified. An 7.46 km2 area or 25.25% of the total area ceased to be slightly desertified land. Undesertified land increased from 1986 to 1990 such that only 0.34 km2 ceased to be undesertified. From 1991 to 1996, the largest changes in land type consisted of shifts from moderately to slightly desertified land. Moderately desertified land decreased by 12.51 km2 or 48.77% of the total area while slightly desertified land increased by 10.47 km2 or 40.82% of the total area. During the same period, moderately desertified land also increased by 9.56 km2 or 37.27% of the total area. From 1986 to 1991, undesertified land increased by 1.312 km2 and decreased by 1.56 km2 to give an overall decrease in area. From 1996 to 2001, severely desertified land showed little change. Moderately desertified land grew during this time and accounted for 54.88% of the total area that changed land type. Slightly desertified land decreased by 10.46 km2 accounting for 39.25% of the total area changed. From 2001 to 2006, slightly and severely desertified land showed the largest expansions of 10.04 and 8.98 km2 (respectively) accounting for 40.11% and 35.88% of the total land area changed. Severely desertified land also declined by 19.23 or 76.83% of the total land area changed. From 2006 to 2011, moderately desertified land increased by 12.45 km2 or 50.92% of the total land area changed and slightly desertified land decreased by 10.15 km2 or 42.03% of the total land area changed. Moderately desertified land decreased by 8.12 km2 or 33.62% of the total land area changed. From 2011 to 2016, moderately desertified land both increased and decreased by about 10 km2. Slightly desertified land also showed significant changes in area.
Table 3. Transfer of desertified land.
5.5. The role of climatic factors in land change
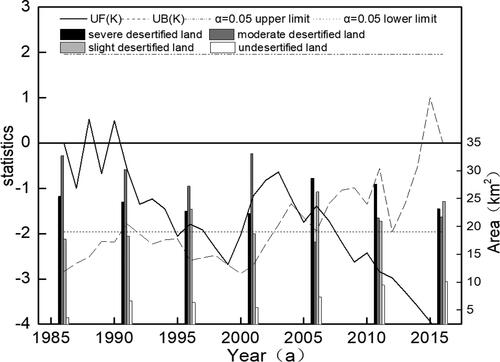
In recent years, research has increasingly focused on climate change as a mechanism driving spatio-temporal patterns in desertification of the Gelintan Oasis. show relationships between land type and climatic data series. The climatic variables UF and UB intersected in 1997. The UF curve gradually approached an upper limit of 0.05 after 1997 indicating a significant warming trend. This event coincided with a sharp increase in the area of severely desertified land from 1997 to 2006 also noted in previous research (Han and Zhu Citation2007; Wang et al. Citation2011; Chen et al. Citation2019). Reduced precipitation can cause decline in soil moisture which in turn lead to increased sand content and ultimate desertification (Xue et al. Citation2007; Li et al. Citation2015). Episodes when the UF curve value exceeded 0 from 1992 to 2016, and when UF and UB curves intersected in 2004 indicate a significant increase in precipitation that coincided with a decline in severely desertified land. These relations also lend support to the interpretation that climatic factors influenced the 2006 expansion of severely desertified land. Annual mean evaporation curves for UF and UB intersected in 2002 and 2007 and the 1987 UF value fell below 0. The UF curve gradually declining to approach a lower limit of 0.05 indicates that evaporation played a role in the sharp increase in desertification in 2006. With a sufficient sand source, an increase in the number of days experiencing strong wind and sandstorms apparently increased desertification. The UF and UB curves also intersected in 2004. The UF values less than 0 meant increased desertification risk from 2006 to 2016. Strong wind lead to greater sediment erosion and transport associated with desertification (Zhang Citation2019; Xu et al. Citation2020), The UF and UB curves for annual mean wind velocity intersected in 2001. UF values of less than 0 are associated with a rapid increase in desertification in 2001 and subsequent decrease. Undesertified land in the study area consists primarily of reclaimed farmland or land subject to other human activities independent of climatic factors.
Figure 7. Correlation between shifts in land type (desertification) and abrupt changes in air temperature.
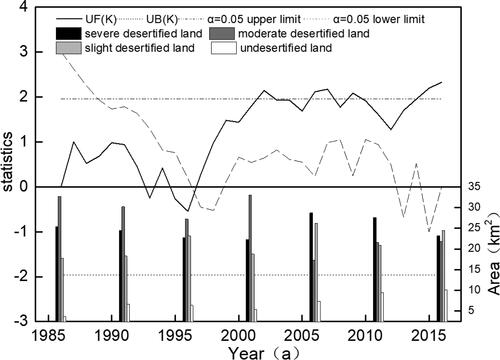
Figure 8. Correlation between the changes in land type (desertification) and abrupt changes in precipitation.
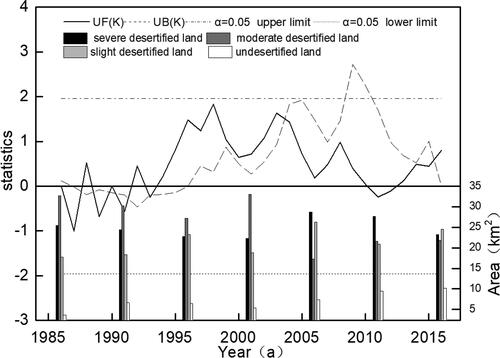
Figure 9. Correlation between changes in land type (desertification) and abrupt changes in evaporation capacity.
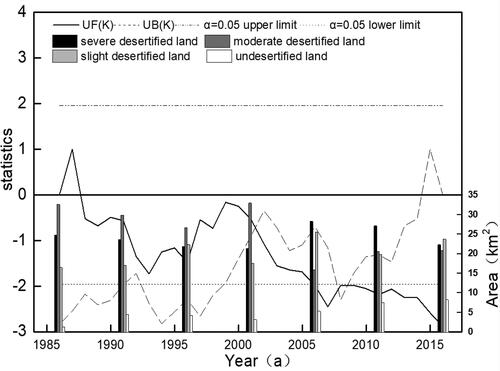
Figure 10. Correlation between changes in land type (desertification) and abrupt changes in relative humidity.
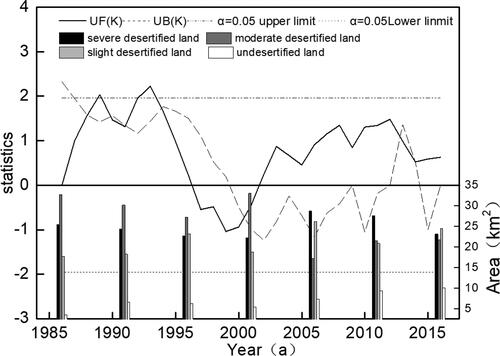
Figure 11. Correlation between changes in land type (desertification) and abrupt changes in average wind velocity.
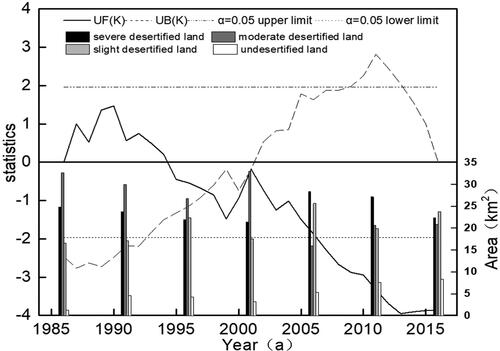
Figure 12. Correlation between changes in land type (desertification) and abrupt changes in annual days of fresh gale.
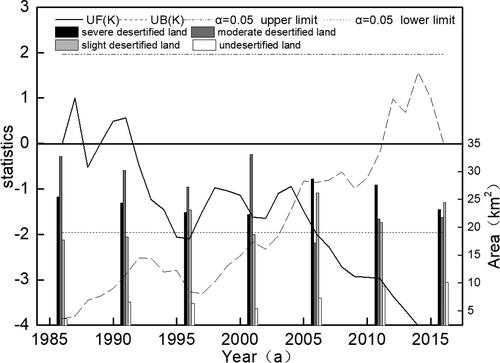
Figure 13. Correlation in change of land type (desertification) and abrupt changes om Annual Sand-Dust Storm Days.
6. Conclusions
From 1998 to 2001, moderately desertified land was the most common land type in the Gelintan Oasis. From 2006 to 2016, severely desertified land became the most common land type in the study area. Severely desertified land decreased continuously from 1986 to 2001 and accumulated 3.13 km2. Severely desertified land area increased from 2001 to 2006. Relative to its extent in 2001, moderately desertified land decreased sharply in 2006 at a rate of 3.16 km2/a. Slightly desertified land expanded in area from 1991 to 2016 but generally showed alternating increasing and decreasing trends every 5 years. Slightly desertified land expanded significantly in 2006 at a rate of 1.49 km2/a. Undesertified land also fluctuated in area throughout the study period.
Moderately desertified land in the Gelintan Oasis occurred primarily in marginal zones around the oasis which represent desertification risks to the oasis, especially given neglected protective systems. As precipitation increases, growth of vegetation in low lying areas between mobile dunes can promote the transition from severely desertified land to moderately desertified land. Expansion of undesertified land depends primarily on human activity.
Moderately desertified land in the Gelintan Oasis showed the greatest amount of change (expansion or decline in area) during the study period. Undesertified land did not show significant change and appeared to be the most stable land type. Sudden changes in air temperature led to sharp increases in severely desertified land area. A significant increase in precipitation coincided with a decrease in the area of severely desertified land. An abrupt decrease in evaporation also coincided with an abrupt decrease in severely desertified land area. Strong winds contribute to erosion and transport processes that increase desertification.
Disclosure statement
No potential conflict of interest was reported by the authors.
Additional information
Funding
References
- Bai XH. 1993. Characteristics and evaluation of desertification process. World Desert Res. 4:18–22.
- Cha Y, Gao JQ. 1997. Application of remote sensing technology on desertification dynamics: a case study in YULIN city, SHANXI province. J Desert Res. 17:286–290.
- Chen WY, Zhang J, Qi DC, Zhao M, Zhang JQ, Li GY, Wei Q, Wang F, Zhu L, Liu ZH, et al. 2019. Climatic factors of desertification process in alpine meadow. Plateau Meteorol. 38:187–195.
- Cui CC, Xu BS, Li YJ, Zheng WM, Yang XR, Wei W. 2018. The application of remote sensing technology to land desertification monitoring. Chin Geophys Soc. 4:55–62.
- Goudie AS. 2011. Desertification. Encyclopedia Environ Health. 41:30–35.
- Han HT, Zhu XN. 2007. Climate change and human activities of Maqu area and its impact on eco-environment. J Desert Res. 27:608–613.
- Huang W, Zhang Y, Wang LM. 2015. Land desertification change based on TM image: a case study of bayannur region. Inner Mongolia Forestry Investigation and Design. 38(5):132–134.
- Jian J, Li JH, Dai XA. 2006. Research on land sandy desertification using remote sensing—taking Qinghai lake area as an example. Geoinform Sci. 2:116–119 + 143.
- Li XY, Yao ZY, Wang HW, Xiao JH. 2015. The driving mechanism of sandy desertification in the Zoige Basin of China. J Desert Res. 35:51–59.
- Liang S. 2001. Narrowband to broadband conversions of land surface albedo I: algorithms. Remote Sens Environ. 76(2):213–238.
- Liu Y, Li Y, Lu Y, Yue H. 2019. Monitoring of desertification and drought in loess plateau based on NDVI-albedo space. Remote Sens Inform. 34:30–35.
- Ma LP, Han GQ. 1996. The application of TM imagery to investigating desertification land in HEXI area. J Desert Res. 16:401–406.
- Ma ZY, Xie YW, Jiao JZ, Li LL, Wang XG. 2011. The construction and application of an aledo-NDVI based desertification monitoring model. Procedia Environ Sci. 10:2029–2035.
- Modica G, Solano F, Merlino A, Di Fazio S, Barreca F, Laudari L, Fichera CR. 2016. Using landsat 8 imagery in detecting cork oak (Quercus suber L.) woodlands: a case study in Calabria (Italy). J Agricult Engineer. 47(4):205–215.
- Ozelkan E, Chen G, Ustundag BB. 2016. Multiscale object-based drought monitoring and comparison in rainfed and irrigated agriculture from Landsat 8 OLI imagery. Int J Appl Earth Obs Geoinf. 44:159–170.
- Pan JH, Qin XJ. 2010. Extracting desertification from landsat imagery using a feature space composed of vegetation index and albedo—a case study of Zhangye oasis and its adjacent areas. Sci Survery Mapp. 35:193–195.
- Qi Y, Wang YM, Wang JH. 2003. Analysis on desertification dynamics based on remote sensing and GIS—exampled in Yanchi County, Ningxia. J Desert Res. 23:275–279.
- Sayl K. 2018. GIS and remote sensing-based approach for desert risk reduction. Conf Arab J Geosci. 1:293–297.
- Sayl KN, Sulaiman SO, Kamel AH, Muhammad NS, Abdullah J, Al-Ansari N. 2021. Minimizing the impacts of desertification in an arid region: a case study of the west desert of Iraq. Adv Civ Eng. 2021:1–12..
- Shao TT, Jiang QG. 2018. Monitoring of sandy and saline-alkali desertification in Tongyu County during 2000—2014. Global Geol. 37:296–301.
- Wang JQ, Chen XR. 2016. Study on the variation trend of desertification in Chifeng, Inner Mongolia and its surrounding area—based on the Albedo and the characteristic space of the normalized difference vegetation index. J Anhui Agri Sci. 44:217–219.
- Wang RB, Zhang NN, Wang QQ. 2016. The method research and application of desertification land monitoring. Geomat Spat Inform Technol. 39:163–166.
- Wang T. 2004. Progress in sandy desertification research of China. J Geog Sci. 14:387–400.
- Wang T, Song X, Yan CZ, Li S, Xie JL. 2011. Remote sensing analysis on aeolian desertification trends in northern China during 1975–2010. J Desert Res. 31:1351–1356.
- Wang T, Wu W, Wang XZ. 1998. Remote sensing monitoring and assessing sandy desertification: an example from the sandy desertification region of northern China. Quatern Sci. 1998:108–118.
- Wang YG, Xiao DD, Li y. 2007. Dynamic characteristics of land degradation development in agricultural oasis of desert-oasis ecotone. Transact CSAE. 6:83–90.
- Wang ZB. 2012. Extraction of sandy land information base on object-oriented method from remote sensing data—taking the Otindag sandy lands as an example. Bijing, Chinese Academy of Forestry.
- Wang ZY. 2018. China’s plan for combating desertification in the world: an analysis of the Kubuqi model. Northern Econ. Z1:14–17.
- Wu JJ. 2015. Methods for quantitative extraction and assessment of sandy land based on remote sensing technology. Bijing, Chinese Academy of Forestry.
- Wu ZP, Wang MX, Zhao X. 2014. A study on desertification based on desertification difference index in Jinghe watershed. Bull Soil Water Conserv. 34:188–192.
- Xie Y-H, Dang X-H, Meng Z-J, Jiang H-T, Li X-J, Zhou R-P, Zhou D-D, Liu X-X, Ding J, Wu X-Q, et al. 2019. Wind and sand control by an oasis protective system: a case from the sout heastern edge of the Tengger Desert. J Mt Sci. 16(11):2548–2561.
- Xu LL, Yan H, Qian S. 2020. Spatio-temporal change of land desertification sensitivity in Northern China from 2000 to 2018 based on MODIS-NDVI. J Nat Resourc. 35:925–936.
- Xue X, Guo J, Zhang F, Zong L, Han BS, Huang CH. 2007. Development and cause of aeolian desertification in Alpine region. J Desert Res. 27:725–732.
- Yang JP, Sun BP. 2006. Research on the desert and desertification in China. J Arid Land Resourc Environ. 20:163–168.
- Zaki M, Tohamy F, Hassan A. 1995. Landsat image interpretation. Comput Stat Data Anal. 20(1):75–97.
- Zhang H, Su XL. 2010. Evaluation and dynamic monitoring of land desertification in Karamay City. Anhui Agri Sci Bul. 16:235–237.
- Zhang JL. 2019. Combating desertification and promoting green development. People’s Daily.
- Zou ML, Han YM, Zeng JJ, Yang C, Xu XF, Guo JJ, Yue DX. 2019. Temporal and spatial dynamic mornitoring of desertification in Maqu County based on Albedo-NDVI features space. J Glaciol Geocryol. 41:45–53.