
 ?Mathematical formulae have been encoded as MathML and are displayed in this HTML version using MathJax in order to improve their display. Uncheck the box to turn MathJax off. This feature requires Javascript. Click on a formula to zoom.
Abstract
The couplings of convolutional neural networks (CNN) with random forest (RF), support vector machine (SVM), long short-term memory (LSTM), and extreme gradient boosting (XGBoost) ensemble algorithms were used to construct novel ensemble computational models (CNN-LSTM, CNN-XG, CNN-SVM, and CNN-RF) for flood hazard mapping in the monsoon-dominated catchment, Bangladesh. The results revealed that geology, elevation, the normalized difference vegetation index (NDVI), and rainfall are the most significant parameters in flash floods based on the Pearson correlation technique. Statistical method such as the area under the curve (AUC) was used to evaluate model performance. The CNN-RF model could be a promising tool for precisely predicting and mapping flash floods as it is outperformed the other models (AUC = 1.0). Furthermore, to meet sustainable development goals (SDGs), a blockchain-based technology is proposed to create a decentralized flood management tool for help seekers and help providers during and post floods. The suggested tool accelerates emergency rescue operations during flood events.
1. Introduction
Owing to climate variability and intense precipitation, flood events occur regularly in several places worldwide (Hirabayashi et al. Citation2013; Khosravi et al. Citation2019; Ruidas et al. Citation2022). Flooding hazards are increasing as the population, urbanization, and agricultural expansion develop (Rahman et al. Citation2021; Zhang et al. Citation2018). Additionally, floods, for example, pose a severe threat to human life and can be caused by natural catastrophes with substantial human casualties and economic devastation (Dottori et al. Citation2016). Floods have directly harmed more inhabitants than any other natural catastrophe in the twenty-first century, according to (CRED), the Centre for Research on the Epidemiology of Disasters (Hoque et al. Citation2019). For the reasons stated above, implementing flood hazard, vulnerability, and risk assessments are critical to reducing future threats (Fernandez et al. Citation2016; Wang et al. Citation2011).
Floods have occurred more frequently in Bangladesh during the last two decades, which can be attributed to precipitation patterns and climate mutation variations, respectively (Hossain 2015). The north-central region of Bangladesh is one of the most vulnerable to intense rains or flooding caused by cloud bursts, particularly during the rainy season (June–September), resulting in substantial economic and human losses (Gazi et al. Citation2019; Rahman et al. Citation2021). With its diverse and undulating landscape and altitude-dependent climate, the region stimulates erosion by having much water running through its streams and rivers. Aiming to reduce the effects of such calamities, researchers worldwide have been studying floods (Kellens et al. Citation2012). Flood susceptibility is a term used to describe an area’s susceptibility to floods due to local topography, geography, and hydro-meteorological conditions. Using flood susceptibility modeling, it is possible to classify a region into zones where floods might occur in the future and create mitigation strategies. Flood susceptibility modeling can be done considering multiple techniques, i.e., geospatial analysis, data mining, hydrologic and hydrodynamic modeling, shallow and deep learning modeling, etc. (Ahmed et al. Citation2021; Bonafilia et al. Citation2020). In addition, researchers also employed expert decision-based analysis for flood susceptibility models, e.g., multiple criteria decision-making (MCDM) approaches.
According to the literature, shallow learning-based models were extensively used in developing flood susceptibility models, e.g., random forest (RF), support vector machine (SVM), extreme gradient boosting (XGBoost), etc. The reasons for selecting these algorithms were that RF is based on the bagging algorithm and uses an ensemble learning technique (Rahman et al. Citation2021; Costache et al. Citation2022a). It eliminates overfitting, lowers variation, and enhances accuracy (Achour et al. Citation2021). Besides, it can manage missing data and perform well in classification and regression problems (Rahman and Islam Citation2019). Although RF requires a lengthy training period, it is a robust algorithm (Sarkar et al. Citation2022). Regarding SVM, nonlinear data are classified with kernel functions (Kavzoglu and Colkesen Citation2009). Afterward, it converts nonlinear to linear data and creates a hyperplane. It can generalize well and avoid over-fitting (Luo and Chen Citation2013; Ruidas et al. Citation2022). However, selecting the proper Kernel function is not a simple endeavor. Too many support vectors may be generated when employing a high-dimension Kernel, significantly slowing down training time (Baig et al. Citation2022). The XGBoost performs admirably well with both tiny and large data and complex data (Costache et al. 2022b). These kinds of datasets, however, perform better than other supervised machine learning (Ghorbanzadeh et al. Citation2019). The biggest limitation is probably the black box nature (Rudin Citation2019). However, utilizing deep learning techniques or an ensemble of deep learning algorithms outperforms these shallow learning algorithms (Bonafilia et al. Citation2020; Rahman et al. Citation2021). It is critical to identify and delineate regions at risk of flooding before formulating mitigation measures and devoting resources in response to future floods. Despite the increasing deep learning (DL) and machine learning (ML) approaches being used for flood forecasting, it is still challenging to produce a reliable flood susceptibility map (Ahmed et al. Citation2021; Rahman et al. Citation2019). Additionally, the physical and statistical approaches may be adequate in some circumstances, but they are insufficient for understanding the complex processes and interconnections that drive natural occurrences like floods. However, recently developed ensemble learning (EL) techniques have greatly improved flood probability assessment.
Comparing several models at the same test site is a typical approach in flood susceptibility studies, perhaps even more so than in other fields of flood research (Gebrehiwot et al. Citation2019; Islam et al. Citation2021). Typically, a novel approach is proposed to compare other state-of-the-art models (Luu et al. Citation2021). Additionally, the recent scientific literature on flood susceptibility is replete with case studies illustrating how different susceptibility maps of the same area can be obtained using various methods. A description of why other models produce additional findings at certain map places is rarely addressed (Choubin et al. Citation2019). A complete examination of the spatial patterns of the differences gained is frequently absent, decreasing the hydrogeological significance of comparing susceptibility maps (Hong et al. Citation2018).
Many studies have used this chance to map flood susceptibility using a distinct set of criteria. The key to good modeling is selecting sample characteristics and using an efficient integrating approach (Ahmed et al. Citation2021; Rahman et al. Citation2021; Luu et al. Citation2021). It should be stated that not all of the elements are required for every geographic area. For example, drainage density may be useful in a floodway zone, but it may not be correct in a mountainous location with several 1st and 2nd order ephemeral streams. As a result, care must be taken when defining variables for simulating the geographical features of the research area. The application of an ensemble modeling and multi-model approach that is used is a relatively new technique for assessing susceptibility, sensitivity, hazards, potential, and other factors (Shahabi et al. Citation2020; Sarkar and Mondal Citation2020; Santos et al. Citation2019; Sahana and Patel Citation2019; Rahmati et al. Citation2016; Xu et al. Citation2021). An ensemble model is a function of two or more estimation methods that are used to improve the predicting accuracy of the model (Choubin et al. Citation2019; Rahman et al. Citation2021; Bui et al. Citation2019; Chowdhuri et al. Citation2020). Ensemble techniques can assist in compensating for the weaknesses of specific models (Choubin et al. Citation2019).
Given the benefits of ML methods and the long-term viability of ensemble ML models, the current study employed these modeling techniques to forecast flood hazards. Furthermore, interconnection and theory-based union frameworks like convolutional neural network-long short-term memory (CNN-LSTM), convolutional neural network-random forest (CNN-RF), convolutional neural network-support vector machine (CNN-SVM), and convolutional neural network-extreme gradient boosting (CNN-XG) are used to construct flood risk maps of the Brahmaputra basin, Bangladesh. This study intends to enlarge and enhance the comparison scheme between susceptibility models with significant insights. Accordingly, susceptibility values were made pixel-by-pixel comparisons to identify consistent spatial patterns in risk maps.
However, a blockchain-based disaster management approach using the deep learning algorithm has been developed to reduce energy usage and processing time. Blockchain technology facilitates decentralized network brainstorming and the generation of a simulated data stream (Swan Citation2015). This study presents a decision-making framework for a flood relief supply chain that considers the complications of emergencies. Because of the high vulnerability and risk level, flood supply chains are sophisticated networks. Supply chain risk management keeps the system flexible, efficient, and robust. Therefore, in this study, a comprehensive approach is used, which includes modeling the disaster communication networks, assessing the influence of the proposed model on emergency relief robustness, and facilitating the identification of potential solutions to optimize emergency aid management. It is hoped that the maps and blockchain technology will help prevent and mitigate flooding in the study area sustainably.
The novelty of this research is that this work couples deep learning with four advanced stacking ensemble algorithms for mapping flood vulnerability in the study catchment area. To the author's best knowledge, the deep learning staking ensemble algorithms with the proposed blockchain-based framework have not been employed in predicting flood risk management in the existing literature. This work addresses the three research questions stated below: (i) What are the elements that contribute to sustainable flood risk management in the monsoon-dominated Brahmaputra basin? (ii) Do deep learning stacking ensemble ML models perform better than set theory-based union and intersection models in flood hazard mapping? (iii) Is the blockchain-based framework enhancing the sustainable flood risk management system, allowing flood victims to get assistance and relief as quickly as possible in the study basin? To address the three research questions, we intend to: (i) use ensemble hybrid ML methods to estimate flood hazard mapping in the monsoon-dominated Brahmaputra River basin catchment; and (ii) propose a blockchain-based framework to improve the current flood risk management system in order to enable flood victims to seek relief and aid as quickly as feasible. (iii) Finally, to achieve long-term sustainability in flood risk management, we precisely compare deep learning-based stacking ensemble algorithms (CNN-LSTM, CNN-RF, CNN-SVM, and CNN-XG). In doing so, this study provides the first implementation of deep learning-based ensemble ML methods in predicting flood risk mapping in the Brahmaputra catchment, providing a robust tool for constructing risk maps that can facilitate identifying appropriate measures and strategies for more sustainable flood management in the catchment.
This article is organized as follows: the study region’s description and preparation of datasets are presented in section 2 along with the methodology of the study, including a detailed description of flood hazard modeling, model performance evaluation, and precision assessment, etc. Section 3 outlines the findings of this research. Section 4 includes a discussion. Section 5 describes the proposed blockchain-based technology for flood management. The conclusions of this work are discussed in Section 6.
2. Materials and methods
2.1. Study area
The Brahmaputra, the largest river in the world, starts within the northern Himalayas and flows along with Tibet, northeast of India, and eventually joins with the massive Padma within Bangladesh (Dewan et al. Citation2017; Ahmed et al. Citation2021). The Brahmaputra floodplain is located between N to
N and
E to
E (Ahmed et al. Citation2021, ). The Brahmaputra River is regarded as one of the deadliest floodplains, with floods regularly occurring and claiming millions of people each year (Ahmed et al. Citation2021)). Specifically, a surge of water from the upstream basin causes severe floods within this area every year. Several significant and minor tributaries of the Brahmaputra, the Dharla, Teesta, Dudhkumar, Phulkumar, Gangadhar, Jinjiram, and other rivers pass through the research region, as do others (Ahmed et al. Citation2021). In the monsoon and post-monsoon seasons, the area receives an average precipitation of 1885.1 mm yearly and a yearly average temperature range between 21 and 34
(Brammer Citation2017; Rahman et al. Citation2021), accounting for ∼ 90% of the total rainfall. The severity and effects of floods are incredibly high in this area from May to October, regarded as Bangladesh’s monsoon season (Rahman et al. Citation2019). The region has a population density of 1128 km2, according to BBS (Citation2011).
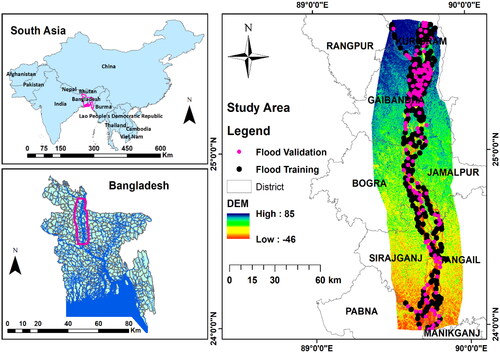
Figure 1. Selected catchment with flood locations.
The research area is geologically located in the Rangpur saddles of the Indian plateau under the Bengal basin. The sediment is largely made up of clay, silt, fine and medium grain sand from recent floodplain deposits (Akhter et al. Citation2019). The river is the primary supply of water in the northern region and millions of people rely on it for a living. Geomorphologically, the floodplains region is one of the highest geomorphic units of Bangladesh. This region is split among slight depressions and valleys of the moribund stream channel impacted by the monsoon climate, which generated lengthy morphological variations in the lower reach of the Brahmaputra River. The research area is susceptible to flash floods. Flash floods occur yearly, with the heaviest flooding occurring during the monsoons within this area. Only the lower section of the Brahmaputra River in Bangladesh has been investigated in the present study.
2.2. Data preparation
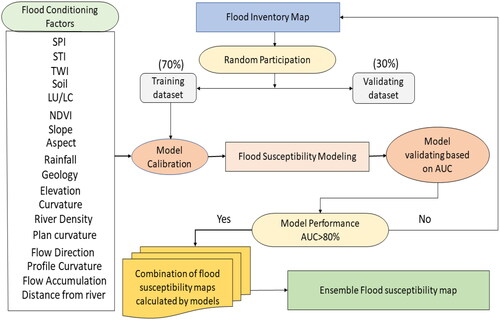
The floods evaluation process consisted of three major steps: (i) Preparing flood inventory, (ii) dividing dataset for training and validating, and (iii) preparing of flood conditioning parameters ().
Figure 2. Flowchart of this work.
2.2.1. Preparing of flood inventory
Flood inventory establishes the relationship between floods and the elements that cause floods. We created a flood inventory for the years from 1988 to 2021 using the following data sources: (i) historical flood records from government and non-governmental organizations (Islam et al. Citation2021; Rahman et al. Citation2021; Rahman et al. Citation2021), (ii) literature; and (iii) Landsat 5–8, Sentinel-1, and MODIS satellite images. The inventories were created using binary categorization, with (30 m 30 m) grid cells having floods consigned 1 and non-floods that consigned 0 (Rahman et al. Citation2021).
2.2.2. Splitting dataset
The resultant floods inventory was divided into two distinct datasets randomly: 70%–350 flood sites were used to train the algorithm, and 30% of the data encompassing 150 flood sites was used to validate the models (Wubalem et al. Citation2020). We anticipate obtaining negative samples or non-flood sites near floods locations. To avoid bias, some researchers proposed choosing the same number of non-floods points as the positive or floods data (Tang et al. Citation2020) based on the topographic map, historical flood info, field survey (Islam et al. Citation2021). Furthermore, a comparable amount of non-flood locations within the study region were chosen for training (70%) and also validation (30%, Rahman et al. Citation2021).
2.2.3. Preparation of flood conditioning factors
Depending on the past studies (Rahman et al. Citation2019; Sahana et al. Citation2020; Kim and Han Citation2020; Islam et al. Citation2021, ) and catchment characteristics of the study region, the subsequent 18 contributing factors were considered: elevation (m), curvature, aspect, slope angle (degree), plan curvature, profile curvature, stream power index (SPI), topographic wetness index (TWI), sediment transport index (STI), river density (RD), mean annual rainfall (mm), distance to the rivers (m), soil, geology, normalized difference vegetation index (NDVI), land use and land cover (LU/LC), flow accumulation, flow direction. provides data on the indicated contributing agents of floods. Elevation, slope angle, aspect, curvature, profile curvature, plan curvature, SPI, TWI, STI, River Density, distance to the rivers, flow accumulation, and flow direction data were extracted from ALOS-digital elevation model (DEM) with a resolution of 30 m. Based on the information from https://chrsdata.eng.uci.edu/ and Nguyen et al. Citation2019), a map depicting the average yearly rainfall was constructed in the GIS environment that was using the kriging spatial interpolation tool (https://chrsdata.eng.uci.edu/) for the year between 2000 and 2021. The reason for utilizing kriging interpolation is that it is highly recommended whenever the geographical coverage of the sample point is not adequate (Kourgialas and Karatzas Citation2011). A map of land cover and NDVI was obtained from https://earthexplorer.usgs.gov/. Geology maps (scale of 1:100,000) were collected from the https://www.usgs.gov/programs/energy-resources-program. Soil texture map (scale of 1:5000 000) was found from the Food and Agriculture Organization of The United Nations (https://www.fao.org). It is worthwhile to point out that reducing the uncertainty associated with different spatial resolutions is a challenging task to do. A consistent 30 m grid size was projected to yield significant results; thus, all causative factors were sampled in this manner (Yi et al. Citation2020). Moreover, high spatial resolution components like DEMs and their derivatives do not improve susceptibility mapping accuracy significantly (Rahman et al. Citation2021).
Figure 3. Flood causal factors: (a) elevation, (b) slope, (c) profile curvature, (d) flow accumulation, (e) flow direction, (f) curvature, (g) distance from river, (h) river density, (i) Aspect, (j) NDVI, (k) rainfall, (l) SPI, (m) TWI, (n) STI, (o) LU/LC, (p) geology, (q) soil, and (r) plan curvature.
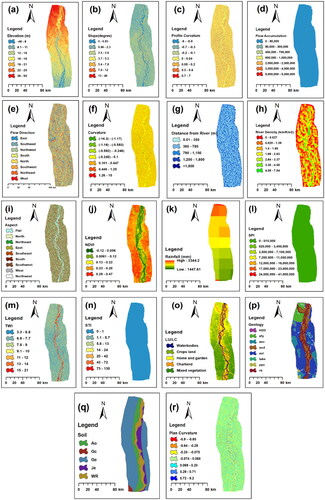
Table 1. Literature on the selection of conditioning parameters for flood susceptibility mapping/model.
2.3. Methods
2.3.1. Multicollinearity and feature selection approaches
The tolerance (TOL) and variance inflation (VIF) factors were employed to assess the multicollinearity of all conditioning parameters, as linear collinearity reduces predictive model performance (Chen et al. Citation2021). Generally, if the TOL or VIF is larger than 5.0, this suggests multicollinearity in terms of conditioning factors (Arabameri et al. Citation2020).
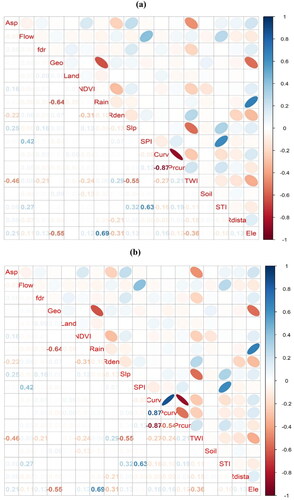
The Pearson correlation coefficient was used to identify the redundant variables in feature selection. A threshold coefficient of ≥0.70 was chosen as an indication of redundancy: suggestive of the similar contribution to the respondent components (Arabameri et al. Citation2018); therefore, the parameters were removed from the model.
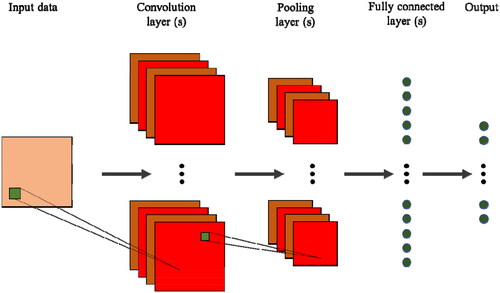
2.3.2. Convolutional neural network
Bengio et al. introduced a convolutional neural network (CNN) to solve the difficulty of lower speed in the learning process of classic artificial neural networks (ANNs) while evaluating complicated networks (Wang et al. Citation2020; Khosravi et al. Citation2020). The CNN is still a neural network, and it transports the local connections between the layers. Several CNN designs have been developed in recent years to address more complex nonlinear problems (Zhao et al. Citation2020; Wang et al. Citation2020). To make the problem easier to understand, the features in the input layer were extracted using tiny squares of input data. The convolution layer requires an image matrix and a filter to perform a sequence of mathematical operations. The pooling layer’s function decreases the number of parameters while keeping vital information. The fully connected neural network layer, an essential and multilayer perceptron, identifies the object classes and trains the weights. EquationEquation (01)(01)
(01) represents the convolution between images patch P and kernel (weight) K for pixel (i,j).
(01)
(01)
In , it can be seen the generalized architecture of CNN.
Figure 4. Generalized architecture of a convolutional neural network.
2.3.3. Random forest
Breiman (Citation2001) initially proposed the random forest (RF) machine learning method. The RF is divided into two subsets those are Breiman’s random subspaces and Ho’s random selecting parameters (Islam et al. Citation2021), which involve training several decision trees and extracting the class: classification and the target: regression of each tree (Rahman et al. Citation2021). Owing to its distinct random trees, the RF technique outperforms standard regression trees in terms of avoiding deviations, missing data, and turbulent inputs (Rahman et al. Citation2021). As a result, the RF was utilized as a standard to assess the newly developed flood probability map.
2.3.4. Support vector machine
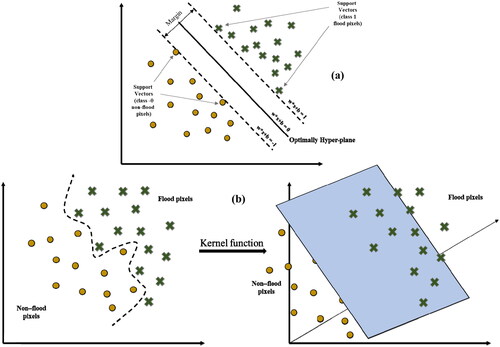
The support vector machine (SVM) is a standard machine learning approach that employs linear predictor functions to estimate the problem function . In SVM, the kernel mathematical function is applied to transformation data. SVM transforms the original data into a high-dimensional feature space using the training data, where a hyperplane is generated (Kavzoglu et al. Citation2014; Choubin et al. Citation2019). The ideal linear hyperplane divides the input space into two classes: non-flood and flood susceptibility (0 and 1, Choubin et al. Citation2019). The SVM’s capacity is based on appropriate kernel functions, such as Polynomial Kernel (PL), Sigmoid Kernel (SIG), Radial Basis Function (RBF), and Linear Kernel (LN). According to multiple research (Tien Bui et al. Citation2012; Hong et al. Citation2018b), RBF outperforms alternative kernels in a flood prediction framework. As a result, the RBF function was utilized in this study. highlights an optimal hyperplane associated with linearly separable data, while shows an optimally hyper-plane for a non - linearly separable data after the application of a kernel function.
Figure 5. Optimally hyper-plane (a. linearly separated data; non-linearly separable data).
A separating hyper-plane can be developed for linear separable inputs;
(02)
(02)
w whereas a concomitant vector defining and direction of the hyperplane in the feature space. Where b also the hyperplane's counterbalance from the source and
indicates the positive slack factors. Tehrany et al. (Citation2014), Costache et al. (Citation2022c), Ruidas et al. (Citation2022), and Islam et al. (Citation2021) provide further information on the SVM's internal computations and equations.
2.3.5. Long short-term memory
Long short-term memory (LSTM) is one of the most widespread recurrent neural network (RNN) architectures and a form of sequential data model or structure that evolved to advance RNNs. Long-term memory relates to learning weights, and short-term memory pertains to internal cell states. LSTM was designed to overcome the vanishing gradient problem in RNNs, with the main difference being the substitution of the RNN’s middle layer with a block named LSTM (Graves Citation2012). The capacity to learn long-term dependence, which was not achievable with RNNs, is the most crucial characteristic of LSTM. In other words, RNNs and LSTMs do not have an issue with long sequences. The strategy incorporated into them enables them to deal with longer sequences, resulting in more incredible performance when compared to other machine learning algorithms (Hochreiter and Schmidhuber Citation1997).
2.3.6. Extreme gradient boosting
Chen and Guestrin (Citation2016) introduced the Extreme Gradient Boosting (EGB) approach, a novel application of the “gradient boosting machine.” EGB is built on the concept of “boosting,” which may be defined as generating a “strong learner” by combining the outputs of numerous “weak learners” (Fan et al. Citation2018). The EGB tries to fine-tune the parameters without overfitting the model. In EGB, the optimization approach starts with the development of the first learner for the entire dataset of variables, followed by the construction of the next model based on the residuals. When the operation fulfils the “stopping conditions,” it is considered accomplished (Fan et al. Citation2018). EGB used parallel processes to minimize computation time (Fan et al. Citation2018; Naghibi et al. Citation2020). When compared to other approaches, it performs better when the dataset contains missing data. We utilized the caret package in the R statistical program to implement the EGB (Mirzaei et al. Citation2021).
2.3.7. Ensemble modeling
In addition to the standalone algorithm, we used an ensemble algorithm for the flood susceptibility model. However, we applied the ensemble methods introduced by Wolpert (Citation1992), which is a stacking hybrid formula that integrates two or several algorithms during the training stage. Ensemble methods can increase predicting ability in comparison to standalone gradient boosting and random forest algorithms (Rahman et al. Citation2021). The fundamental concept of an ensemble technique is to be trained and predicted by the primary training data via first-level learners. The predicted outcome (e.g., first-rank learners) was integrated to generate the latest training data for the conceptual process. Zhou (Citation2009) and Sikora (Citation2015) gave detailed information on the ensemble algorithm. The model tasks were conducted using the WEKA (v.3.8.4) program. The detailed structure and tuning parameters are discussed in the supplementary file.
2.3.8. Model similarity assessment
The concept of examining similarities and dissimilarities between results is critical in modelling applications. These are to be expected when working with varying accuracy and performance models. Locating these locations of divergence is essential to the accuracy of flood susceptibility mapping. Spatial comparisons were performed to determine areas of similarity and dissimilarity in the model results by pair-wise comparing six susceptibility maps (i.e., (i) CNN-LSTM vs CNN-RF, (ii) CNN-LSTM vs CNN-SVM, (iii) CNN-LSTM vs CNN-XG, (iv) CNN-RF vs CNN-SVM, (v) CNN-RF vs CNN-XG, and (vi) CNN-SVM and CNN-XG developed for each of the four models (e.g., CNN-RF, CNN-SVM, CNN-LSTM, and CNN-XG) of the four ensemble algorithms used using two-dimensional matrix multiplication technique.
2.4. Blockchain technology
Blockchain technology is a decentralized system that is safe, transparent, and reliable for storing and distributing information (Novikov et al. Citation2018) . It is utilized in digital currencies, disaster relief aid distribution, e-governance, health science, environmental science, supply chain, etc (Sheela and Priya Citation2021). The prime objective of a disaster management system built on the blockchain technology is to (i) validate the information obtained from various sources, (ii) connect together data from multiple sources to provide accessible, reliable, and trustworthy data, (iii) protect and securing the identity of victims and disaster-related data, and (iv) develop an efficient system for disaster management that is low-cost for use in operations and administration while also safeguarding the disaster’s related identity.
Existing natural hazard information systems have accumulated a certain degree of automation. Still, data gathered from diverse technologies are fragmented in different phases of disaster, and no information system integrates supply-side and local officials. Since the systems operate independently, there is no consistency or integrity of data to be ensured. Due to this, disaster management teams have difficulties in standardizing the process of issuing victim records and detecting irregularities in the transfer of funds. This study discusses the reliability and functionality of blockchain-based disaster information. In addition, blockchain-based solutions give a framework for early warnings, communicating with authorities for emergency evacuation, knowing the closest and safest emergency evacuation shelter, and efficiently involving volunteers in relief operations.
3. Results
3.1. Multicollinearity assessment
The collinearity test was performed to find multicollinearity issues in all conditioning components while tolerance and VIF were considered. shows that land use has the highest tolerance, TOL (0.974) and lowest VIF (1.026), whereas plan curvature has the TOL (0.073) and highest VIF (13.773), implying that all values fall between 0.1 and 5 except plan curvature. Therefore, all components show no multicollinearity issue except plan curvature, and it is free of multicollinearity and is suitable for mapping the flood susceptibility.
Table 2. Multicollinearity assessment.
3.2. Variable importance
demonstrates that the combination of aspect, geology, land use, NDVI, rainfall, river density, slope, soil, and river distance (R2 = 0.936) had the most effect on flood susceptibility modeling. In contrast, other factor combinations had the most negligible impact.
Table 3. Variable importance.
3.3. Feature selection
To consider valuable aspects of the algorithm, the Pearson coefficient was computed. This study determined that the coefficient threshold for using the feature during algorithm development should be 0.70. The results showed the profile curvature had crossed the threshold value (≥ 0.70; ). Taking into this account, we have eliminated one redundant factor from the algorithm and rechecked the featured threshold value, and found that no factors crossed the assigned threshold (< 0.70; ).
Figure 6. Feature selection.
3.4. Assessment of CNN-LSTM model
depicts the flood vulnerability map of the Brahmaputra floodplain derived by the ensemble of the Convolutional Neural Network—Long-short Term Memory (CNN-LSTM) algorithm. According to the resulting map, ∼32% of the research region is in a moderate to very high flood risk zone (). The reason for this might be explained by the fact that the majority of the study region is situated around the Brahmaputra River, mainly in the central and north-central regions. NDVI, river density, and rainfall were significant contributing factors in flood susceptibility mapping using CNN-LSTM models (). In addition, according to the CNN-LSTM algorithm, Kurigram, Bogra, and the districts of Jamalpur and Gaibandha are particularly vulnerable to flooding because of their proximity to large river networks. However, a substantial amount of the terrain (68%), or around 5963.35 km2, is classified as low susceptible (). and show that 68% or 5963.35 km2 of the study area falls into low susceptible areas. In contrast, only 8% of the study area is highly susceptible. It is the lowest percent of the flood susceptibility models (). It also represents the low in accordance with the other AUC curve, whereas the high accuracy curve shows in CNN-RF. Most of these less susceptible areas are located in Bangladesh’s Southern and Central Brahmaputra floodplain.
Figure 7. Flood susceptibility maps.
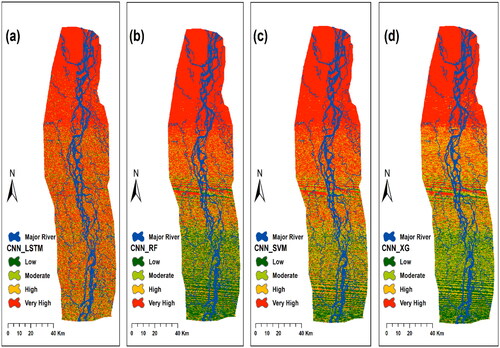
Table 4. The proportion of the study region allocated to each of the flood inundation classes is determined by utilizing the modeled findings CNN-LSTM, CNN-RF, CNN-SVM, and CNN-XG.
3.5. Assessment of CNN-RF model
A flood vulnerability map generated by a convolutional neural network-Random Forest (CNN-RF) is described in . According to the resulting map of the CNN-RF algorithm, approximately 46% of the research region is prone to flooding at a moderate to a very high level (). The majority of these areas were found in the central north and Northern part of the Brahmaputra River. However, it is the less dominant portion than CNN-LSTM, which covers the land (54%, 4751.05 km2), and is classified as low vulnerable (). Like with the CNN-LSTM algorithm, the most susceptible districts are Kurigram, Gaibandha, Bogura, and Jamalpur.
3.6. Assessment of CNN-SVM model
The flood susceptibility map was created using the convolutional neural network-Support Vector Machine (CNN-SVM) is presented in . The results show that ∼25% (2245.88 km2) of the area falls into the high to very-high susceptible category. Specifically, the districts located around a major river, for example, according to the CNN-SVM model, the most susceptible districts to flooding are Kurigram, Jamalpur, Bogura, and Gaibandha. In addition, slope, river distance, river density, land use, NDVI, river density, rainfall, and geology were shown to be of the utmost importance in this algorithm (). On the other hand, the most dominant area (∼75%) of the case study was classified as moderate to low susceptible, with the majority identified in the southern part of the study region.
3.7. Assessing of CNN-XG model
Convolutional neural network and XG-Boost algorithms created a susceptibility map (). According to the CNN-XGB, the second-highest percentage was shown in this model, which area is (35%) falls into the high to very high category. Most of the areas are located around Brahmaputra Territory. Like with the other three models, the most vulnerable districts are Kurigram, Jamalpur, Bogra, and Gaibandha, In terms of the CNN-XGB model (). In contrast, the moderate and low susceptible area covers 65% (5652.22 km2) northern part of the study area.
3.8. Analysis of the models
The effectiveness of four flood susceptibility models (CNN-LSTM, CNN-RF, CNN-SVM, and CNN-XG) were evaluated using precision, recall, F1Score, and receiver operator characteristic curves using training and validation datasets (). The area under the curve (AUC) for CNN-LSTM is 0.999, CNN-RF is 1.000, CNN-SVM is 0.997, and CNN-XG is 0.998 (). Furthermore, depending on the validation datasets, the AUC for CNN-LSTM is 0.987, CNN-RF is 0.998, CNN-SVM is 0.996, and CNN-XG is 0.995 (). Such findings suggest that all algorithms are very effective in predicting floods vulnerability, with a value larger than 0.80. On the other hand, the CNN-RF algorithm is the most successful model for training and validation datasets, based on AUC values and accuracy scores. At the same time, CNN-LSTM and CNN-SVM are the least efficient in mapping flood risk in the study area comparing CNN-RF.
Figure 8. The receiver operating characteristic (ROC) curves of flood susceptibility maps.
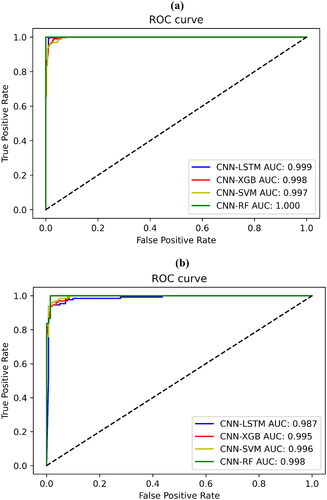
Table 5. Validation results of CNN-LSTM, CNN-RF, CNN-SVM, and CNN-XG model.
3.9. Model comparison
Outcomes from each flood susceptibility mapping were examined to see whether there were any differences in the model results (Kalantar et al. Citation2021; Islam et al. Citation2021). In accordance with ( and ), 83.16% of areas have been inhabited by the same hazard intensity for the two flood susceptibility maps, for example, the susceptibility maps created from CNN-RF and CNN-XG. A flood susceptibility map generated using the CNN-RF model shows 16.83% spatial distributions reveal dissimilarities, whereas 11.74% show higher categories. In comparison to the produced map using the CNN-XG model, a total of 5.09% distributions shows the lower categories ( and ). The comparison results for other models are also provided ( and ). These variations are mostly attributable to the influence of factors in influencing the spatial distribution of floods in each model, as well as the proposal of the susceptibility map class (Arora et al. Citation2021).
Figure 9. Models’ similarities and dissimilarities check.
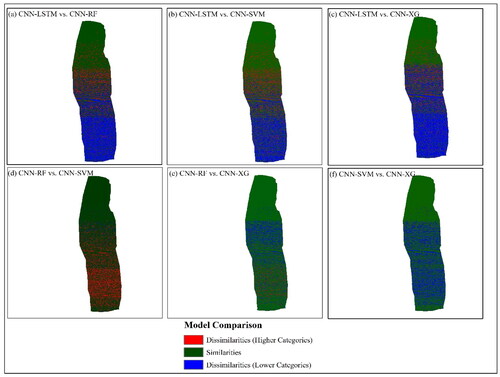
Table 6. Pair-wise model results comparison.
4. Discussion
The outcomes of the flood susceptibility categories were developed using the CNN-RF Hybrid Machine learning method, indicating the accessibility and the great effectiveness of this method for creating flood hazard mapping. The trendline (AUC) has been used to prove the validity of the four maps produced by the CNN-LSTM, CNN-RF, CNN-SVM, and CNN XG hybrid algorithms. The AUC values of CNN-LSTM, CNN-RF, CNN-SVM, and CNN-XG ranged from 0.999 to 0.987, 1.000 to 0.998, 0.997 to 0.996, and 0.998 to 0.995, accordingly. We also noticed that the CCI values ranged between 96.45 and 98.35, confirming the suggested algorithm’s good accuracy (Rahman et al. Citation2021). As a result, the CNN-RF method is an excellent classifier for mapping the inundation potential.
Despite the fact that various types of floods often devastate and damage Bangladesh, research on flood vulnerability assessment is comparably scarce. Numerous research on flood vulnerability assessment in Bangladesh can be found in the literature (Rahman et al. Citation2019; Talukdar et al. Citation2020; Adnan et al. Citation2019; Islam et al. Citation2021; Ahmed et al. Citation2021). However, no study was undertaken for the Brahmaputra floodplain in Bangladesh to analyze riverine flood risk utilizing hybrid machine learning algorithms: CNN-LSTM, CNN-SVM, CNN-XG, and CNN-RF. Floods have become so common and extensive in recent decades, causing massive casualties and economic devastation (Fernandez et al. Citation2016). Owing to the fast-changing climate, the impacts of the flood will be much more disastrous in the future (Chen et al. Citation2015; Fang et al. Citation2016). To assess the real flood-prone scenarios, an effective flood vulnerability mapping approach is necessary. This research aimed to compare flood vulnerability by CNN-LSTM, CNN-SVM, CNN-XG, and CNN-RF ensemble algorithms to offer the best approaches for the susceptibility to riverine flooding. A good number of flood susceptibility analyses using SVM, SCG-NN, PART, ANN, RSS, AHP, DLNN, and RF models can be found in the earlier research (Ahmed et al. Citation2021; Rahman et al. Citation2019; Rahman et al. Citation2021; Rahman et al. Citation2021; Luu et al. Citation2021). To the best of our knowledge, no flood susceptibility study has been carried out utilizing CNN-LSTM, CNN-SVM, CNN-XG, or CNN-RF. Furthermore, few studies mentioned in the literature use only a minor portion of the study region (Islam et al. Citation2021; Talukdar et al. Citation2020) or performed at a regional level (Rahman et al. Citation2019). Rahman et al. (Citation2019) aimed to determine the floods-prone zone for the entire country of Bangladesh, and their analysis included the Brahmaputra floodplain on a large scale (Ahmed et al. Citation2021). As a result, the current study investigated CNN-LSTM, CNN-SVM, CNN-XG, and CNN-RF techniques to optimize the study area region on a basin scale.
The models were compared using a variety of MLA approaches, with ROC-AUC functioning as the primary metric for determining accuracy. Elevation is a critical contributing factor in flood occurrences. Generally, elevation and flood have an opposite relationship (Janizadeh et al. Citation2019). The low elevation is frequently associated with both a moderate gradient and a low-lying inclination; hence, the low-elevation area may be flooded. Furthermore, this research provides a complete understanding of flooding inundation levels for the Brahmaputra floodplain in the models ( and ). The models indicate that places along the Brahmaputra River system is much more vulnerable to flooding. Kurigram, Gaibandha, Sirajganj, and Jamalpur were the most vulnerable districts for all models. Such results validated previous vulnerability or susceptibility studies on a section of the research region. For example, Rahman et al. (Citation2019) examined flood vulnerability using ANN for the whole of Bangladesh. His results show that the districts of Kurigram, Gaibandha, Sirajganj, and Jamalpur are particularly prone to floods. Using an ensemble of bagging algorithms, Talukdar et al. (Citation2020) detected susceptible zones in the Teesta River system; our analysis likewise revealed vulnerable regions near the Teesta River. Although the Brahmaputra floodplain is in greater danger, no study focusing on these specific places was accessible. As a result, our precise findings will assist the local government builds significant mitigation strategies for flood-affected individuals in the Brahmaputra floodplain. The results may differ when applying this method in different environmental settings because of other input variables. In this study, we have considered highly influential factors for flood susceptibility modeling. Therefore, it can be said that the method is sensitive to this specific study area. However, this work can be replicated in other areas to comprehend the model’s sensitivity. Note that the use of input variables may produce differing outcomes. On the contrary, CNN-RF is the most accurate of the three models, while CNN-LSTM, CNN-SVM, and CNN-XB are better models. This study reveals that CNN-RF is more suitable for Bangladesh’s riverine flood modeling than the SVM, SCG-NN, PART, ANN, RSS, AHP, DLNN, and RF methods used by Ahmed et al. (Citation2021), Rahman et al. (Citation2019), Rahman et al. (Citation2021), Rahman et al. (Citation2021), and Luu et al. (Citation2021). In the existing literature, there was no discussion on an ensemble of CNN-RF in flood susceptibility mapping. Thus, we could not make a comparison of our model with the literature. However, CNN outperforms other shallow machine learning algorithms, i.e., SVM, ANN, DT, etc., as a standalone model (Rashid and Louis Citation2019). According to the findings, CNN outperforms SVM by seventeen%, indicating that it is a robust and accurate algorithm for flood susceptibility modeling (Youssef et al. Citation2022). The reason can be explained by using CNNs, the raw data could be transformed into meaningful representations that help algorithm differentiation. After convolutional and pooling layers, significant aspects of user input are increased and unnecessary data is removed, which makes the algorithm robust in perfect flood modeling (Wang et al. Citation2020). Furthermore, the primary guiding concept of the RF algorithm was the employment of ensemble decision trees, which were individually fragile learners but, when coupled (CNN-RF), were powerful learners (Jain et al. Citation2020). Because of its good performance, policymakers and engineers can employ a CNN-RF to provide catastrophe readiness for local populations in similar surroundings.
However, since it is typically the scenario, the geographical exploration of the produced indicators (e.g., DEM, land cover, geology, soil, rain, and other indicators) was not always constant, which is the limitation of this work, which is related to uncertainties that are difficult to quantify precisely. For ease of use, we resampled all of the input features thematic layer at a 30-m resolution for ease of use, yet our results help flood probability maps.
5. Proposed blockchain-based technology for flood management
Blockchain is an unchangeable digital ledger that records transactions (Poonia et al. Citation2021). Although blockchain technology is not new, research into the possibility of blockchain applications for flood management is still in its early stages. The sustainability of using blockchain technology in flood management is predicated on storing and handling vast amounts of data from flood victims while maintaining the privacy and minimizing operational costs. The technology allows individuals to work independently without a centralized authority or a third party. This technique improves the system’s efficiency by reducing transaction costs. The blockchain is a blessing in disaster management to make emergency evacuation transparent to the general public (Dogo et al. Citation2019; Engin and Treleaven Citation2019). This technology has drawn the attention of stakeholders from a wide range of industries, including the health care sector, smart cities, etc. (Zhang and Zhang Citation2016; Esposito et al. Citation2021).
Many natural and anthropogenic calamities, including the ongoing COVID-19 pandemic, frequently cause human and significant environmental harm globally (Cheval et al. Citation2020). Technical solutions are urgently required to avoid or mitigate the effects of disasters. Since data can be stored in an immutable manner and exchanged in real-time, blockchain technology offers several intriguing possibilities for increasing the accessibility of data. For disasters and emergencies, blockchain enables easy audibility of data, allowing for verifying the effectiveness of emergency actions (Vannucci et al. Citation2021; Nguyen et al. Citation2021; Gupta et al. Citation2021).
This study integrated deep learning algorithms and blockchain technology for managing floods. The literature identifies a multitude of opportunities that emerge from the coupling of DLA with blockchain. For instance, DLA has improved forecasting of natural disasters such as floods, earthquakes, cyclones, landslides, debris flows, etc. DLA and blockchain’s capacity to store and handle data create a wide range of exciting possibilities for developing and deploying disaster prevention and mitigation systems. This paper makes a significant contribution to blockchain technology and flood management. It is said in the study that blockchain technology could be used to make flood supply networks more durable.
In this proposed technology, a mobile-based or computer-based application is made available to the general public, through which general public users can register themselves with any local aid center (). Additionally, users can designate the assistance they are prepared to supply during a disaster. Then, the local assistance center is responsible for verifying the user's derived from past interactions with the service. Thus, the suggested framework speeds up rescue and relief efforts while promoting a clean and transparent network. This current technology permits accurate information to be passed to aid claimants, suppliers, and organizations. The proposed system consists of the following steps given below:
Figure 10. Proposed application of flood risk management in the study area.
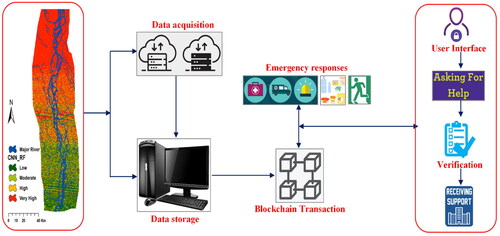
Victims will be sending a message to a nearby support center asking for help in the event of a medical emergency or emergency evacuation.
The inquiry will be sent to the chain members, e.g., doctors, evacuation team, etc., using the mobile application.
This will be accepted by the relevant members, i.e., doctors, rescue volunteers, etc., who have expressed an interest in assisting and will then contact the local support center.
The local help center chooses the best person to help based on proximity and how well they have helped others in the past. Besides, the help center alerts the rescue team and the victim via mobile or computer applications.
The local help center then dispatches a rescue squad comprised of the best available services to rescue the victim successfully.
5.1. Achieving sustainability in flood risk management
SDG 13 asks for efforts to tackle climate change and its implications, as well as natural disasters and unforeseeable consequences that disproportionately affect the poorest and most vulnerable people. For the sake of humankind, immediate action is essential to combat these natural calamities. Between 1995 and 2015, floods alone impacted 2.3 billion people, accounting for 47 of all weather-related disasters. Ninety-five% of these individuals live in Asia. Floods killed 3300 persons in India and Bangladesh in 2007. Monsoon floods are common in Indian rivers, impacted directly by monsoon cycles (Kumar et al. Citation2019).
In order to achieve SDG 6, there are several concerns that must be addressed. These include water scarcity, access to clean drinking water, sanitation, water quality, floods, and transboundary water issues. A comprehensive assessment of the world's water resources, taking into account a wide range of issues, is needed to meet SDG 6 and keep tabs on progress. However, just a few studies attempted to develop integrated assessment systems (Hamouda et al. Citation2009; Sullivan Citation2011; Giupponi et al. Citation2015; Gain et al. Citation2015b).
For decades, floods have become one of the most prevalent natural hydrological concerns in floodplains. River overflowing, excessive rains, tidal surges, snowmelt, and subsurface seepage are all contributing factors. China (1998, Yangtze River; 2013, Southeast China), Central Europe (1997, 2005), the United Kingdom (2000, 2007, 2009), Bangladesh (1988, 1998, 2007), the United States (2005, New Orleans), and Australia have lately experienced severe flooding (2011, Queensland). (Sayers et al. Citation2013). Many regions in the United States have already seen increased flooding due to climate change in areas where there had previously been no big floods (Melillo et al. Citation2014). Flooding has a significant impact on the following components, regardless of the source or nature of the floods: human lives and livelihoods, settlement and housing, agriculture, industry, commercial operations, and communication infrastructures. Significant urban populations that expand along rivers are often very vulnerable to flooding if the pattern of floods and risk factors change spontaneously due to rapid land-use conversion and urban expansion.
Flooding impacts rural populations and interrupts agricultural industries and livelihoods (Messner and Meyer Citation2006). Throughout the year of the 1990s and 2000s, flooding risk management developed new perspectives concerning total disaster mitigation methods. Floods in China, for example, generated a focus on readiness, plan of disaster, as well as the development of variable-standard constructional defenses between 1991 and 1998. For example, flood defenses around main river sections would be planned for a 100-year recurrence interval of the flood. Defenses along smaller rivers, on the other hand, would be prepared for a flood with a 50-year return time. Recognizing the residual hazards, the Chinese government has changed its priority from complete flood control procedures to risk management via flood risk mapping and the establishment of socially based flood control zones. It is now widely acknowledged that no one method is sufficient to minimize the flooding risk; instead, a combination of flood hazard management measures is essential within all floodplains. This strategy might be included land use planning, and architectural defenses, with increased community preparedness for flood through warning systems and disaster management. However, floods control methods must be implemented following the local environmental, socioeconomic, and institutional framework (Richards et al. Citation2008; McBain Citation2012; Shah et al. Citation2012; Sayers et al. Citation2013). Although structural flood control measures may assist the majority of flood-prone countries, many countries have yet to implement flood-sensitive land use planning or institutionalize flood preparedness and disaster management efforts. It is because structural interventions are immediately noticeable to the community, whereas non-structural activities are not as obvious. Nonetheless, because modern flood management strategies emphasize structural and non-structural flood management measures, additional research analyzing the proportionate importance of all interventions to reducing overall flood risk in flood-prone locations might be important in selecting the optimal alternatives. Despite the short-term benefits of structural flood defense techniques, the improved and sustainable effectiveness of structural flood control techniques cannot be justified in the long run since many locations inside big flood control projects have flooded after only a few years of construction. Furthermore, flood prevention systems encourage additional building in the floodplain, which can constitute a “moral hazard,” deceiving a susceptible population about the hazards of occupying the floodplain (McBain Citation2012). The performance evaluation of flood control structures is limited by the unforeseen transformation of the floodplain and related flood hazards following the construction of these structures.
There has been no research or strategy to employ sustainable development and integrated management techniques in the flooding risk assessment, explicitly considering the adverse implications of flooding control measures (Brouwer and van Ek Citation2004; Hall and Penning-Rowsell Citation2011; Sayers et al. Citation2013). However, the planning process has not entirely incorporated a sustainable study of structural flood control schemes. Flood hazard governance is regarded as an ongoing adaptation of strategic planning (Hall and Penning-Rowsell Citation2011; Sayers et al. Citation2013), "dynamical durability" ideas, methods that encompass adaptation of treatments to get the most significant potential outcomes through ongoing learning and resolution of issues (Newman Citation2005; Scoones et al. Citation2007; Shah et al. Citation2018), can be utilized. Furthermore, considering stakeholder risks insights and safety needs are essential for selecting managing options, a more in-depth awareness of flooding hazards and safety perceptions among present and future stakeholders may aid in fulfilling the greater durability in flooding control approaches. Yet, there is currently little insight on how to assess the type and attitude of succeeding stakeholders in relation to implementing flooding hazard maintenance initiatives today. As a result, future studies should focus on strategies for communicating flood risk to current and future stakeholders and communities.
6. Conclusion
This work aimed to establish a flood hazard map using shallow and deep learning-based algorithms. We developed and compared the hybrid models, including, e.g., CNN-LSTM, CNN-SVM, CNN-XG, and CNN-RF algorithms. All the models were used to analyze the flood hazard in the monsoon-dominated catchment area of Bangladesh. Eighteen flood causal variables were employed to estimate the flash flood hazard of the study region. All components were examined for multicollinearity using tolerance and VIF tests and performed well, except for plan curvature.
The Pearson correlation-based feature selection tool was used to choose and list the factors, and it was found that NDVI, aspect, geology, elevation, and rainfall had the most significant effect on flood hazard mapping. The final hazard maps obtained from CNN-LSTM, CNN-SVM, CNN-XG, and CNN-RF show that areas near the river networks are the most vulnerable. Furthermore, the flood hazard algorithms derived from multiple ensemble machine learning approaches indicate that CNN-RF outperforms the AUC value (training and validation) in both instances. As a result, all models imply that locations along the monsoon-dominated catchment areas are more likely to flood. In particular, Kurigram, Gaibandha, Bogra, and Jamalpur were selected as the most vulnerable districts for all algorithms. Such results imply that all of the techniques used are consistent. The proposed blockchain-based system provides a safer, quicker, and more efficient disaster response system and facilities for providing finances, aid, and services to victims and others in need. The insights may be utilized to develop successful policy interventions to reduce the impact of flooding on individuals, particularly those who live near rivers. Furthermore, the suggested information system can assist humanitarian agencies in carrying out their operations successfully throughout the pre-and post-flood phases. This limitation can be addressed in future studies. The current research provides a new way to assess floods from different angles in the study area, as well as a much-needed framework for reducing disaster-related risks and providing information for flood risk management and adaptation techniques.
Disclosure statement
No potential conflict of interest was reported by the author(s).
References
- Achour Y, Saidani Z, Touati R, Pham QB, Pal SC, Mustafa F, Balik Sanli F. 2021. Assessing landslide susceptibility using a machine learning-based approach to achieving land degradation neutrality. Environ Earth Sci. 80(17):1–20.
- Adnan MSG, Dewan A, Zannat KE, Abdullah AYM. 2019. The use of watershed geomorphic data in flash flood susceptibility zoning: a case study of the Karnaphuli and Sangu River basins of Bangladesh. Nat Hazards. 99(1):425–448.
- Ahmed N, Hoque MAA, Arabameri A, Chandra Pal S, Chakrabortty R, Jui J. 2021. Flood susceptibility mapping in Brahmaputra floodplain of Bangladesh using deep boost, deep learning neural network, and artificial neural network. Geocarto Int. 2021:1–19.
- Akhter S, Eibek KU, Islam S, Islam A, Shen S, Chu R. 2019. Predicting spatiotemporal changes of channel morphology in the reach of Teesta River, Bangladesh using GIS and ARIMA modeling. Quat. Int. 513:80–94.
- Arabameri A, Pradhan B, Pourghasemi HR, Rezaei K, Kerle N. 2018. Spatial modeling of gully erosion using GIS and R programing: A comparison among three data mining algorithms. Appl Sci. 8(8):1369.
- Arabameri A, Saha S, Chen W, Roy J, Pradhan B, Bui DT. 2020. Flash flood susceptibility modelling using functional tree and hybrid ensemble techniques. J Hydrol. 587:125007.
- Arora A, Arabameri A, Pandey M, Siddiqui MA, Shukla UK, Bui DT, Mishra VN, Bhardwaj A. 2021. Optimization of state-of-the-art fuzzy-metaheuristic ANFIS-based machine learning models for flood susceptibility prediction mapping in the Middle Ganga Plain, India. Sci Total Environ. 750:141565.
- Baig MA, Xiong D, Rahman M. 2022. How do multiple kernel functions in machine learning algorithms improve precision in flood probability mapping?. Natural Hazards. 2022:1–20.
- BBS. 2011. Population and housing census, Bangladesh Bureau of Statistics (BBS). Dhaka: Ministry of Planning, Government of the People’s Republic of Bangladesh.
- Bonafilia D, Tellman B, Anderson T, Issenberg E. 2020. Sen1Floods11: a georeferenced dataset to train and test deep learning flood algorithms for Sentinel-1. In Proceedings of the IEEE/CVF Conference on Computer Vision and Pattern Recognition Workshops (p. 210–211).
- Brammer H. 2017. Bangladesh’s diverse and complex physical geography: implications for agricultural development. Int J Environ Stud. 74(1):1–27.
- Breiman L. 2001. Random forests. Mach Learn. 45(1):5–32.
- Brouwer R, van Ek R. 2004. Integrated ecological, economic and social impact assessment of alternative flood control policies in the Netherlands. Ecol Econ. 50(1–2):1–21.
- Bui DT, Tsangaratos P, Ngo PTT, Pham TD, Pham BT. 2019. Flash flood susceptibility modeling using an optimized fuzzy rule-based feature selection technique and tree-based ensemble methods. Sci Total Environ. 668:1038–1054.
- Bui DT, Tsangaratos P, Nguyen VT, Van Liem N, Trinh PT. 2020. Comparing the prediction performance of a Deep Learning Neural Network model with conventional machine learning models in landslide susceptibility assessment. Catena. 188:104426.
- Chen H, Ito Y, Sawamukai M, Tokunaga T. 2015. Flood hazard assessment in the Kujukuri Plain of Chiba Prefecture, Japan, based on GIS and multicriteria decision analysis. Nat Hazards. 78(1):105–120.
- Chen T, Guestrin C. 2016. Xgboost: A scalable tree boosting system. In Proceedings of the 22nd Acm Sigkdd International Conference on Knowledge Discovery and Data Mining (p. 785–794). [Mismatch
- Chen X, Chen G, Ge L, Huang B, Cao C. 2021. Global oceanic Eddy identification: A deep learning method from argo profiles and altimetry data. Front Mar Sci. 8:646926.
- Cheval S, Mihai Adamescu C, Georgiadis T, Herrnegger M, Piticar A, Legates DR. 2020. Observed and potential impacts of the COVID-19 pandemic on the environment. IJERPH. 17(11):4140.
- Choubin B, Moradi E, Golshan M, Adamowski J, Sajedi-Hosseini F, Mosavi A. 2019. An ensemble prediction of flood susceptibility using multivariate discriminant analysis, classification and regression trees, and support vector machines. Sci Total Environ. 651(Pt 2):2087–2096.
- Chowdhuri I, Pal SC, Chakrabortty R. 2020. Flood susceptibility mapping by ensemble evidential belief function and binomial logistic regression model on river basin of eastern India. Adv Space Res. 65(5):1466–1489.
- Costache R, Arabameri A, Costache I, Crăciun A, Md Towfiqul Islam AR, Abba SI, Sahana M, Pham BT. 2022b. Flood susceptibility evaluation through deep learning optimizer ensembles and GIS techniques. J Environ Manage. 316:115316.
- Costache R, Tin TT, Arabameri A, Crăciun A, Costache I, Islam ARMT, Sahana M, Pham BT. 2022a. Stacking state-of-the-art ensemble for flash-flood potential assessment. Geocarto Int. 2022:1–27.
- Costache R, Trung Tin T, Arabameri A, Crăciun A, Ajin RS, Costache I, Reza Md. Towfiqul Islam A, Abba SI, Sahana M, Avand M, et al. 2022c. Flash-flood hazard using deep learning based on H2O R package and fuzzy-multicriteria decision-making analysis. J Hydrology. 609:127747.
- Costache R. 2019. Flood susceptibility assessment by using bivariate statistics and machine learning models-a useful tool for flood risk management. Water Resour Manage. 33(9):3239–3256.
- Das S. 2020. Flood susceptibility mapping of the Western Ghat coastal belt using multi-source geospatial data and analytical hierarchy process (AHP). Remote Sens Appl: Soc Environ. 20:100379.
- Dewan A, Corner R, Saleem A, Rahman MM, Haider MR, Rahman MM, Sarker MH. 2017. Assessing channel changes of the Ganges-Padma River system in Bangladesh using Landsat and hydrological data. Geomorphology. 276:257–279.
- Dogo EM, Salami AF, Nwulu NI, Aigbavboa CO. 2019. Blockchain and internet of things-based technologies for intelligent water management system. In: Artificial intelligence in IoT. Cham: Springer; p. 129–150.
- Dottori F, Salamon P, Bianchi A, Alfieri L, Hirpa FA, Feyen L. 2016. Development and evaluation of a framework for global flood hazard mapping. Adv Water Resour. 94:87–102.
- Engin Z, Treleaven P. 2019. Algorithmic government: Automating public services and supporting civil servants in using data science technologies. Computer J. 62(3):448–460.
- Esposito C, Ficco M, Gupta BB. 2021. Blockchain-based authentication and authorization for smart city applications. Inf Process Manag. 58(2):102468.
- Fan J, Wang X, Wu L, Zhou H, Zhang F, Yu X, Lu X, Xiang Y. 2018. Comparison of support vector machine and extreme gradient boosting for predicting daily global solar radiation using temperature and precipitation in humid subtropical climates: a case study in China. Energy Convers Manag. 164:102–111.
- Fang Y, Yin J, Wu B. 2016. Flooding risk assessment of coastal tourist attractions affected by sea-level rise and storm surge: a case study in Zhejiang Province. Nat Hazards. 84(1):611–624.
- Fernandez P, Mourato S, Moreira M. 2016. Social vulnerability assessment of flood risk using GIS-based multicriteria decision analysis. A case study of Vila Nova de Gaia (Portugal). Geomat Nat Haz Risk. 7(4):1367–1389.
- Gain AK, Mojtahed V, Biscaro C, Balbi S, Giupponi C. 2015b. An integrated approach of flood risk assessment in the eastern part of Dhaka City Nat. Nat Hazards. 79(3):1499–1530.
- Gazi MY, Islam MA, Hossain S. 2019. Flood-hazard mapping in a regional scale–way forward to the future hazard atlas in Bangladesh. Malays J Geosci. 3(1):1–11.
- Gebrehiwot A, Hashemi-Beni L, Thompson G, Kordjamshidi P, Langan TE. 2019. Deep convolutional neural network for flood extent mapping using unmanned aerial vehicles data. Sensors. 19(7):1486.
- Ghorbanzadeh O, Blaschke T, Gholamnia K, Meena SR, Tiede D, Aryal J. 2019. Evaluation of different machine learning methods and deep-learning convolutional neural networks for landslide detection. Remote Sens. 11(2):196.
- Giupponi C, et al. 2015. Chapter 6—integrated risk assessment of water-related disasters. In: J F S P D, editor. Baldassarre hydrometeorological hazards, risks and disasters. Boston: Elsevier; p. 163–200.
- Graves A. 2012. Supervised sequence labelling. In Supervised sequence labelling with recurrent neural networks. Berlin, Heidelberg: Springer; p. 5–13.
- Gupta BB, Li KC, Leung VC, Psannis KE, Yamaguchi S. 2021. Blockchain-assisted secure fine-grained searchable encryption for a cloud-based healthcare cyberphysical system. IEEE/CAA J Autom Sin. 8(12):1877–1890.
- Hall JW, Penning-Rowsell EC. 2011. Setting the scene for flood risk management. In: Pender G, Faulkner H, editors. Flood risk science and management. West Sussex, UK: Blackwell Publishing Ltd; p. 3–16.
- Hamouda M, Nour El-Din M, Moursy F. 2009. Vulnerability assessment of water resources systems in the Eastern Nile Basin. Water Resour Manage. 23(13):2697–2725.
- Hirabayashi Y, Mahendran R, Koirala S, Konoshima L, Yamazaki D, Watanabe S, Kim H, Kanae S. 2013. Global flood risk under climate change. Nature Clim Change. 3(9):816–821.
- Hochreiter S, Schmidhuber J. 1997. Long short-term memory. Neural Comput. 9(8):1735–1780.
- Hong H, Panahi M, Shirzadi A, Ma T, Liu J, Zhu AX, Chen W, Kougias I, Kazakis N. 2018. Flood susceptibility assessment in Hengfeng area coupling adaptive neuro-fuzzy inference system with genetic algorithm and differential evolution. Sci Total Environ. 621:1124–1141.
- Hong H, Tsangaratos P, Ilia I, Liu J, Zhu A-X, Xu C. 2018b. Applying genetic algorithms to set the optimal combination of forest fire related variables and model forest fire susceptibility based on data mining models. The case of Dayu County. Sci Total Environ. 630:1044–1056.
- Hoque M, Tasfia S, Ahmed N, Pradhan B. 2019. Assessing spatial flood vulnerability at Kalapara Upazila in Bangladesh using an analytic hierarchy process. Sensors. 19(6):1302.
- Islam A, Talukdar S, Mahato S, Kundu S, Eibek KU, Pham QB, Kuriqi A, Linh NTT. 2021. Flood susceptibility modelling using advanced ensemble machine learning models. Geosci Front. 12(3):101075.
- Jain P, Coogan SC, Subramanian SG, Crowley M, Taylor S, Flannigan MD. 2020. A review of machine learning applications in wildfire science and management. Environ Rev. 28(4):478–505.
- Janizadeh S, Avand M, Jaafari A, Phong TV, Bayat M, Ahmadisharaf E, Prakash I, Pham BT, Lee S. 2019. Prediction success of machine learning methods for flash flood susceptibility mapping in the Tafresh watershed, Iran. Sustainability. 11(19):5426.
- Kalantar B, Ueda N, Saeidi V, Janizadeh S, Shabani F, Ahmadi K, Shabani F. 2021. Deep neural network utilizing remote sensing datasets for flood hazard susceptibility mapping in Brisbane, Australia. Remote Sens. 13(13):2638.
- Kavzoglu T, Colkesen I. 2009. A kernel functions analysis for support vector machines for land cover classification. Int J Appl Earth Obs Geoinf. 11(5):352–359.
- Kavzoglu T, Sahin EK, Colkesen I. 2014. Landslide susceptibility mapping using GIS based multi-criteria decision analysis, support vector machines, and logistic regression. Landslides. 11(3):425–439.
- Kellens W, Terpstra T, De Maeyer P. 2012. Perception and communication of flood risks: a systematic review of empirical research. Risk Analy An Int J. 33(1):24–49.
- Khosravi K, Nohani E, Maroufinia E, Pourghasemi HR. 2016. A GIS-based flood susceptibility assessment and its mapping in Iran: a comparison between frequency ratio and weights-of-evidence bivariate statistical models with multi-criteria decision-making technique. Nat Hazards. 83(2):947–987.
- Khosravi K, Panahi M, Golkarian A, Keesstra SD, Saco PM, Bui DT, Lee S. 2020. Convolutional neural network approach for spatial prediction of flood hazard at national scale of Iran. J Hydrol. 591:125552.
- Khosravi K, Pham BT, Chapi K, Shirzadi A, Shahabi H, Revhaug I, Prakash I, Bui DT. 2018. A comparative assessment of decision trees algorithms for flash flood susceptibility modeling at Haraz watershed, northern Iran. Sci Total Environ. 627:744–755.
- Khosravi K, Shahabi H, Pham BT, Adamowski J, Shirzadi A, Pradhan B, Dou J, Ly H-B, Gróf G, Ho HL, et al. 2019. A comparative assessment of flood susceptibility modeling using multi-criteria decision-making analysis and machine learning methods. J Hydrol. 573:311–323.,
- Kia MB, Pirasteh S, Pradhan B, Mahmud AR, Sulaiman WNA, Moradi A. 2012. An artificial neural network model for flood simulation using GIS: Johor River Basin, Malaysia. Environ Earth Sci. 67(1):251–264.
- Kim HI, Han KY. 2020. Urban flood prediction using deep neural network with data augmentation. Water. 12(3):899.
- Kourgialas NN, Karatzas GP. 2011. Flood management and a GIS modelling method to assess flood-hazard areas—a case study. Hydrol Sci J. 56(2):212–225.
- Kumar D, Singh RB, Kaur R. 2019. SDG 13: Case study–monitoring and assessment of flood-inundated areas. In: Spatial information technology for sustainable development goals. Cham: Springer; p. 151–156..
- Li X, Yan D, Wang K, Weng B, Qin T, Liu S. 2019. Flood risk assessment of global watersheds based on multiple machine learning models. Water. 11(8):1654.
- Luo L, Chen X. 2013. Integrating piecewise linear representation and weighted support vector machine for stock trading signal prediction. Appl Soft Comput. 13(2):806–816.
- Luu C, Pham BT, Van Phong T, Costache R, Nguyen HD, Amiri M, Bui QD, Nguyen LT, Van Le H, Prakash I, et al. 2021. GIS-based ensemble computational models for flood susceptibility prediction in the Quang Binh Province, Vietnam. J Hydrol. 599:126500.
- Malik S, Pal SC, Chowdhuri I, Chakrabortty R, Roy P, Das B. 2020. Prediction of highly flood prone areas by GIS based heuristic and statistical model in a monsoon dominated region of Bengal Basin. Remote Sens Appl: Soc Environ. 19:100343.
- McBain W. 2012. Twenty-first century flood risk management. In: Sayers PB, editor. Flood risk. London: Thomas Telford Limited; p. 7–22.
- Melillo JM, Richmond T, Yohe GW, eds. 2014. Climate change impacts in the United States: the third National Climate Assessment. Washington, DC: U.S. Global Change Research Program.
- Messner F, Meyer V. 2006. Flood damage, vulnerability and risk perception–challenges for flood damage research. In: Schanze J, Zeman E, Marsalek J, editors. Flood risk management: Hazards, vulnerability and mitigation measures. Dordrecht, The Netherlands: Springer; p. 149–169.
- Mirzaei S, Vafakhah M, Pradhan B, Alavi SJ. 2021. Flood susceptibility assessment using extreme gradient boosting (EGB), Iran. Earth Sci Inform. 14(1):51–67.
- Nachappa TG, Piralilou ST, Gholamnia K, Ghorbanzadeh O, Rahmati O, Blaschke T. 2020. Flood susceptibility mapping with machine learning, multi-criteria decision analysis and ensemble using Dempster Shafer Theory. J Hydrol. 590:125275.
- Naghibi SA, Hashemi H, Berndtsson R, Lee S. 2020. Application of extreme gradient boosting and parallel random forest algorithms for assessing groundwater spring potential using DEM-derived factors. J Hydrol. 589:125197.
- Newman L. 2005. Uncertainty, innovation, and dynamic sustainable development. Sustain Sci Pract Policy. 1(2):25–31.
- Ngo PTT, Hoang ND, Pradhan B, Nguyen QK, Tran XT, Nguyen QM, Nguyen VN, Samui P, Tien Bui D. 2018. A novel hybrid swarm optimized multilayer neural network for spatial prediction of flash floods in tropical areas using sentinel-1 SAR imagery and geospatial data. Sensors. 18(11):3704.
- Nguyen GN, Le Viet NH, Elhoseny M, Shankar K, Gupta BB, Abd El-Latif AA. 2021. Secure blockchain enabled Cyber–physical systems in healthcare using deep belief network with ResNet model. J Parallel Distr Comput. 153:150–160.
- Nguyen P, Shearer EJ, Tran H, Ombadi M, Hayatbini N, Palacios T, Huynh P, Braithwaite D, Updegraff G, Hsu K, et al. 2019. The CHRS Data Portal, an easily accessible public repository forPERSIANN global satellite precipitation data. Sci Data. 6:180296.
- Novikov SP, Kazakov OD, Kulagina NA, Azarenko NY. 2018. Blockchain and smart contracts in a decentralized health infrastructure. In 2018 IEEE International Conference" Quality Management, Transport and Information Security, Information Technologies"(IT&QM&IS); pp. 697–703. IEEE
- Paul GC, Saha S, Hembram TK. 2019. Application of the GIS-based probabilistic models for mapping the flood susceptibility in Bansloi sub-basin of Ganga-Bhagirathi river and their comparison. Remote Sens Earth Syst Sci. 2(2–3):120–146.
- Poonia V, Goyal MK, Gupta BB, Gupta AK, Jha S, Das J. 2021. Drought occurrence in different river basins of India and blockchain technology-based framework for disaster management. J Cleaner Prod. 312:127737.
- Rahman M, Chen N, Elbeltagi A, Islam MM, Alam M, Pourghasemi HR, Tao W, Zhang J, Shufeng T, Faiz H, et al. 2021. Application of stacking hybrid machine learning algorithms in delineating multi-type flooding in Bangladesh. J Environ Manage. 295:113086.
- Rahman M, Chen N, Islam MM, Dewan A, Pourghasemi HR, Washakh RMA, Nepal N, Tian S, Faiz H, Alam M, et al. 2021. Location-allocation modeling for emergency evacuation planning with GIS and remote sensing: a case study of Northeast Bangladesh. Geosci Front. 12(3):101095.
- Rahman M, Ningsheng C, Islam MM, Dewan A, Iqbal J, Washakh RMA, Shufeng T. 2019. Flood susceptibility assessment in Bangladesh using machine learning and multi-criteria decision analysis. Earth Syst Environ. 3(3):585–601.
- Rahman MS, Islam ARMT. 2019. Are precipitation concentration and intensity changing in Bangladesh overtimes? Analysis of the possible causes of changes in precipitation systems. Sci Total Environ. 690:370–387.
- Rahmati O, Haghizadeh A, Pourghasemi HR, Noormohamadi F. 2016. Gully erosion susceptibility mapping: The role of gis-based bivariate statistical models and their comparison. Nat Hazards. 82(2):1231–1258.
- Rashid KM, Louis J. 2019. Times-series data augmentation and deep learning for construction equipment activity recognition. Adv Eng Inf. 42:100944.
- Richards J, White I, Carter J. 2008. Local planning practice and flood risk management in England: is there a collective implementation deficit? eue. 2:11–20.
- Rimba AB, Setiawati MD, Sambah AB, Miura F. 2017. Physical flood vulnerability mapping applying geospatial techniques in Okazaki City, Aichi Prefecture, Japan. Urban Science. 1(1):7.
- Rudin C. 2019. Stop explaining black box machine learning models for high stakes decisions and use interpretable models instead. Nat Mach Intell. 1(5):206–215.
- Ruidas D, Chakrabortty R, Islam ARMT, Saha A, Pal SC. 2022. A novel hybrid of meta-optimization approach for flash flood-susceptibility assessment in a monsoon-dominated watershed. Eastern India. Environ Earth Sci. 81(5):1–22.
- Sahana M, Patel PP. 2019. A comparison of frequency ratio and fuzzy logic models for flood susceptibility assessment of the lower Kosi River Basin in India. Environ Earth Sci. 78(10):1–27.
- Sahana M, Rehman S, Sajjad H, Hong H. 2020. Exploring effectiveness of frequency ratio and support vector machine models in storm surge flood susceptibility assessment: a study of Sundarban Biosphere Reserve, India. Catena. 189:104450.
- Santos PP, Reis E, Pereira S, Santos M. 2019. A flood susceptibility model at the national scale based on multicriteria analysis. Sci Total Environ. 667:325–337.
- Sarkar D, Mondal P. 2020. Flood vulnerability mapping using frequency ratio (FR) model: a case study on Kulik river basin, Indo-Bangladesh Barind region. Appl Water Sci. 10(1):1–13.
- Sarkar SK, Ansar SB, Ekram KMM, Khan MH, Talukdar S, Naikoo MW, Islam A, Rahman A, Mosavi A. 2022. Developing robust flood susceptibility model with small numbers of parameters in highly fertile regions of Northwest Bangladesh for sustainable flood and agriculture management. Sustainability. 14(7):3982.
- Sayers P, Yli GG, Penning-Rowsell E, Shen F, Wen K, Chen Y, Le Quesne T. 2013. Flood risks management: a strategic approach. Paris: UNESCO,
- Scoones I, Leach M, Smith A, Stagl S, Stirling A, Thompson J. 2007. Dynamic systems and the challenge of sustainability. STEPS Working Paper 1, STEPS Centre: Brighton.
- Shah MAR, Douven W, Werner M, Leentvaar J. 2012. Flood warning responses of farmer households: a case study in Uria Union in the Brahmaputra flood plain, Bangladesh. J Flood Risk Manage. 5(3):258–269.
- Shah MAR, Rahman A, Chowdhury SH. 2018. Challenges for achieving sustainable flood risk management. J Flood Risk Manage. 11:S352–S358.
- Shahabi H, Shirzadi A, Ghaderi K, Omidvar E, Al-Ansari N, Clague JJ, Geertsema M, Khosravi K, Amini A, Bahrami S, et al. 2020. Flood detection and susceptibility mapping using sentinel-1 remote sensing data and a machine learning approach: Hybrid intelligence of bagging ensemble based on k-nearest neighbor classifier. Remote Sens. 12(2):266.
- Sheela K, Priya C. 2021. Enhancement of Iot Security Solutions Blockchain Technology. In: Blockchain applications for secure IoT frameworks: Technologies shaping the future. India: Bentham Science Publishers; Vol. 1; p. 131.
- Sikora RA. 2015. Modified stacking ensemble machine learning algorithm using genetic algorithms. Handbook of Research on Organizational Transformations through Big Data Analytics. IGi Global; 43–53.
- Sullivan C. 2011. Quantifying water vulnerability: a multidimensional approach Stoch. Stoch Environ Res Risk Assess. 25(4):627–640.
- Swan M. 2015. Blockchain thinking: The brain as a decentralized autonomous corporation [commentary]. IEEE Technol Soc Mag. 34(4):41–52.
- Talukdar S, Ghose B, Salam R, Mahato S, Pham QB, Linh NTT, Costache R, Avand M. 2020. Flood susceptibility modeling in Teesta River basin, Bangladesh using novel ensembles of bagging algorithms. Stoch Environ Res Risk Assess. 34(12):2277–2300.
- Tang D, Dai R, Tang L, Li X. 2020. Low-rate DoS attack detection based on two-step cluster analysis and UTR analysis. Hum Cent Comput Inf Sci. 10(1):6.
- Tehrany MS, Pradhan B, Jebur MN. 2014. Flood susceptibility mapping using a novel ensemble weights-of-evidence and support vector machine models in GIS. J Hydrol. 512:332–343.
- Termeh SVR, Kornejady A, Pourghasemi HR, Keesstra S. 2018. Flood susceptibility mapping using novel ensembles of adaptive neuro fuzzy inference system and metaheuristic algorithms. Sci Total Environ. 615:438–451.
- Tien Bui D, Pradhan B, Lofman O, Revhaug I. 2012. Landslide susceptibility assessment in vietnam using support vector machines, decision tree, and naïve bayes models. Math Probl Eng. 2012:1–26.
- Vannucci E, Pagano AJ, Romagnoli F. 2021. Climate change management: a resilience strategy for flood risk using Blockchain tools. Decisions Econ Finan. 44(1):177–190.
- Wang Y, Fang Z, Hong H, Peng L. 2020. Flood susceptibility mapping using convolutional neural network frameworks. J Hydrol. 582:124482.
- Wang Y, Hong H, Chen W, Li S, Panahi M, Khosravi K, Shirzadi A, Shahabi H, Panahi S, Costache R. 2019. Flood susceptibility mapping in Dingnan County (China) using adaptive neuro-fuzzy inference system with biogeography-based optimization and imperialistic competitive algorithm. J Environ Manage. 247:712–729.
- Wang Y, Li Z, Tang Z, Zeng G. 2011. A GIS-based spatial multi-criteria approach for flood risk assessment in the Dongting Lake Region, Hunan, Central China. Water Resour Manage. 25(13):3465–3484.
- Wolpert DH. 1992. Stacked generalization. Neural Network. 5(2):241–259.
- Wubalem A, Tesfaw G, Dawit Z, Getahun B, Mekuria T, Jothimani M. 2020. Comparison of statistical and analytical hierarchy process methods on flood susceptibility mapping: in a case study of Tana sub-basin in northwestern Ethiopia. Nat Hazards Earth Syst Sci Discuss:1–43.
- Xu L, Cui S, Wang X, Tang J, Nitivattananon V, Ding S, Nguyen Nguyen M., 2021. Dynamic risk of coastal flood and driving factors: Integrating local sea level rise and spatially explicit urban growth. J Cleaner Production. 321:129039.
- Yi Y, Zhang Z, Zhang W, Jia H, Zhang J. 2020. Landslide susceptibility mapping using multiscale sampling strategy and convolutional neural network: a case study in Jiuzhaigou region. Catena. 195:104851.
- Youssef AM, Pradhan B, Dikshit A, Mahdi AM. 2022. Comparative study of convolutional neural network (CNN) and support vector machine (SVM) for flood susceptibility mapping: a case study at Ras Gharib, Red Sea, Egypt. Geocarto Int. 2022:1–28.
- Zhang Q, Gu X, Singh VP, Shi P, Sun P. 2018. More frequent flooding? Changes in flood frequency in the Pearl River basin, China, since 1951 and over the past 1000 years. Hydrol Earth Syst Sci. 22(5):2637–2653.
- Zhang Q, Zhang J. 2016. Drought hazard assessment in typical corn cultivated areas of China at present and potential climate change. Nat Hazards. 81(2):1323–1331.
- Zhao G, Pang B, Xu Z, Yue J, Tu T. 2018. Mapping flood susceptibility in mountainous areas on a national scale in China. Sci Total Environ. 615:1133–1142.
- Zhao J, Fan W, Zhai X. 2020. Identification of land-use characteristics using bicycle sharing data: A deep learning approach. J Transp Geogr. 82:102562.
- Zhou ZH. 2009. Ensemble learning. Encycl Biom. 1:270–273.