
Abstract
Nighttime Light (NTL) data provides a measure of socio-economic development and is publicly available on the Google Earth Engine (GEE) cloud-based platform. The use of GEE to analyze NTL has expanded, but the trends remain unknown. In response, we provide a systematic overview of GEE-based NTL studies from its inception. We searched the Google Scholar database, which returned 359 articles, 73 of which were eligible. Results indicated NTL-GEE research has evolved into studies of urbanization, environmental, and socio-economic areas worldwide. Studies grew steadily since 2014 and peaked in 2021. VIIRS-DNB is the widely used product due to its superior properties to DMSP-OLS that followed, and the Luojia01-1 data is increasing, although not currently available on GEE. Almost two-thirds of NTL products was used as the primary dataset and the remaining as auxiliary; along with daytime sensors. Overall, the NTL-GEE research has been a success and supported by many governments and institutions.
1. Introduction
Satellite remote sensing is one of the most attractive and practical means that has greatly improved our ability to monitor human developmental and environmental features on Earth. Its extensive coverage, high temporal acquisition and rich information content have made remote sensing a prime candidate for characterizing the time-space dynamics of human-Earth systems at a lower cost than traditional field-based methods (Szuster et al. Citation2011). Over the past two decades, rapid advances in remote sensing, including improved sensor technology (Ma et al. Citation2015), the introduction of open data policies, and a growing demand on the application side have led to the success of some innovative systems for storing, managing, processing, and analyzing Earth observation data (Sudmanns et al. Citation2020). These developments lead to new ways to track terrestrial changes consistently and faster than before (Zhang et al. Citation2015).
The advent of the Google Earth Engine (GEE) cloud-based geo-computational platform in 2010 opened up unprecedented opportunities in geospatial field with its planetary-scale analysis capabilities (Google 2015; Gorelick et al. Citation2017). The platform leverages parallel computing on Google’s cloud infrastructure to accelerate big data analytics, resolve challenges associated with processing large volumes of geospatial data, and provide convenient and free on-demand access to millions of geospatial datasets (Alonso et al. Citation2016). GEE provides a complete record of analysis-ready satellite products, including daytime and nighttime light (NTL) data, socio-economic and other geospatial datasets (Mutanga and Kumar Citation2019). It also offers a flexible analysis workspace, processing functions, transfer packages and the ability to upload external georeferenced data, ensuring that users are no longer limited by the software’s accessibility (Gorelick et al. Citation2017; Tamiminia et al. Citation2020).
Remote sensing imageries has provided essential means of mapping and monitoring urban change using daytime and nighttime data (Zhang et al. Citation2015). Daytime datasets such as Landsat and MODIS have found wide application in characterizing socio-economic dynamics, while NTL data have expanded the ability to record these attributes by providing a unique window to distinguish impervious surfaces that are spectrally similar to natural surfaces (Levin et al. Citation2020). Some daytime sensors are unavailable to distinguish human developments from natural classes in heterogeneous environments, limiting thematic accuracy (Zhang et al. Citation2015). For this reason, NTL sensors have become popular in socio-economic characterization efforts (Liu et al. Citation2021). This is reflected in the growing number of studies that have integrated these data products (Zhang et al. Citation2015).
NTL data has been consistently available since 1992 through the Defense Meteorological Satellite Program – Operational Linescan System (DMSP-OLS) sensor (1992–2013), while the Visible Infrared Imaging Radiometer Suite (VIIRS) extended the observations from 2012 to the present (Jeswani et al. Citation2019). The DMSP-OLS recorded nocturnal light radiance using 6-bit quantization digital numbers (DNs) at a ground sampling distance of 2.7 km (Baugh et al. Citation2010), with data available as annual composites. Several improvements to the VIIRS make it superior to the former, including (a) a refined temporal frequency at monthly intervals and (b) a spatial resolution of 742 m; (c) reduced minimum detectable radiance; (d) VIIRS has a built-in calibration that accurately measures radiance while OLS does not, (e) overcomes the saturation problem evident in OLS data with a much wider dynamic range (Elvidge et al. Citation2013). Since 1992, these products have enabled the spatio-temporal quantification of NTL, consistently linking them to myriad socio-economic indicators such as urbanization (Chen et al. Citation2021), electricity consumption (Zhao et al. Citation2020), household poverty (Liao et al. Citation2022), and so on.
With these attractive resources, there is now an excellent opportunity to integrate datasets and deploy high-density NTL time-series analysis that will allow users to comprehensively describe human-induced changes on Earth. Given the convenience and power of the GEE for geo-temporal analysis, it is being used in a growing number of nocturnal light detection studies. Therefore, the synthesis, analysis, and classification of these GEE-based NTL applications are of crucial importance. Hitherto, literature reviews have been conducted to discover patterns in the existing knowledge and to identify gaps for further research (Shaffril et al. Citation2020). Previous reviews of NTL remote sensing include Huang et al. (Citation2014), who discussed the application of DMSP-OLS NTL data. Levin et al. (Citation2020) examined the newly developed nocturnal light data sensor, VIIRS DNB, and NTL applications such as human activity and infrastructure monitoring in urban areas. They concluded that the development of NTL data in terms of data availability and the spectral, temporal, and spatial resolution could potentially address new applications and themes in the future. Zhao et al. (Citation2019) reviewed challenges, prospects, and advances related to remote sensing of NTL data. However, they also uncover difficulties related to the algorithms and technologies required to access and generate data. They then proposed strategies to improve the use of NTL data by combining it with other forms to obtain better results. More recently, Adelabu and Olusola (Citation2021) evaluated the NTL literature on Africa and noted the limited application of this dataset on the continent. All NTL reviews have mainly focused on evaluating the techniques, applications, and limitations based on representative literature. Despite the practical and widespread use of the data-rich GEE platform, no study has yet provided insight into the impact and value of GEE for NTL applications, and our study fills this gap.
This article provides a systematic evaluation of NTL peer-reviewed articles that used the GEE platform as an analysis tool. Our aim is not to argue that all researchers should adopt the GEE platform, but rather to understand how GEE facilities have enabled and contributed to NTL research. For this purpose, 73 articles (as of May 2022) that met our search criteria were selected, evaluated, and compiled into a database for analysis. The rest of the article is structured as follows: First, we outline the methodology for the systematic selection and review of the GEE-NTL applications. Second, we report the results and implications of our systematic literature review. Third, we discuss the main results of the review and, finally, we highlight limitations and future prospects before making concluding remarks.
2. Review methodology
2.1. Systematic review
Systematic literature review is a multi-step procedural review and aggregation of related research evidence through structured, transparent, and reproducible processes (Higgins et al. Citation2011). This has become a popular and widely used tool to better understand existing knowledge, patterns, implications, and gaps for further research exploration in a specific area of interest (Kitchenham Citation2004). The goal of a systematic review is usually very focused and specific, aiming to answer certain specific questions compared to a general review which has a very broad context (Munn et al. Citation2018). It is able to uncover all the evidence researchers need to make more informed decision on various topics they are evaluating (Aromataris and Pearson Citation2014). The current review is expected to shed light on NTL applications in the GEE platform by showing the context in which these studies were conducted, hotspot areas, trends since GEE adoption, where they were published, and so on.
2.2. Data collection
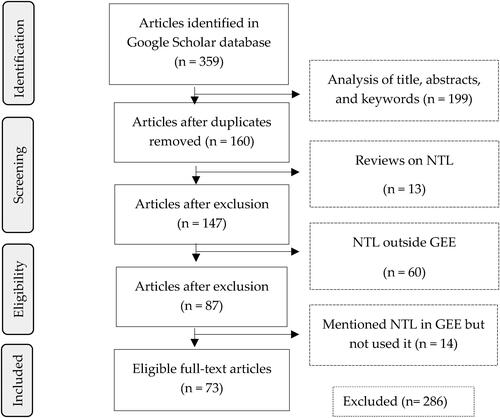
We searched for relevant peer-reviewed articles with the keywords ‘nighttime light’ OR ‘DMSP-OLS’ OR ‘VIIRS’ AND ‘google earth engine’ OR ‘remote sensing’ from the Google Scholar database. We selected Google Scholar over subscription platforms such as Web of Science for our literature search. Then, we followed a Preferred Reporting Items for Systematic Reviews and Meta-Analyses (PRISMA) (Moher et al. Citation2009) to select articles. All selected articles were then vetted manually in the ‘data used’ section to identify their relevance to our research objective. The search returned a total of 359 journal papers of which 73 publications were relevant to our review (). We excluded studies that were not published as peer-reviewed journal articles and conference papers (e.g. book chapters, reports, etc.), studies that mention NTL in GEE but did not use it as a data source or platform for research, studies that have used NTL outside of the GEE platform and the review articles on NTL for the analysis.
Figure 1. Flow diagram of the publication selection process.
2.3. Data organization from the included articles
We compiled a database with key information for each article, including the first author(s), publication date, title, sensor used, location, journal name and an overview of these studies is shown in . Not all features are shown in the table and journal names are abbreviated for convenience.
Table 1. Overview of studies that used NTL data within GEE platform.
3. Results
Our results are based on 73 publications on the use of GEE for nighttime light detection. Here, we characterize these articles in terms of their temporal evolution, geographic location, the sensor used, associated themes, and scope.
3.1. Historical trends of publications
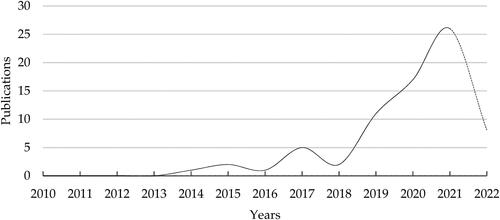
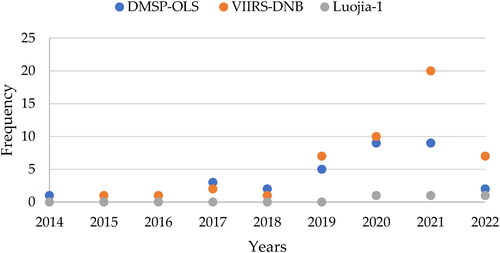
The historical evolution of GEE-based nocturnal light research is displayed in . As can be seen, the articles have been published every year since 2014 up to now. From the beginning, the articles increased to 5 in 2017. From 2018, a sharp rise in the number of articles is notable, reaching their peak (26 articles) in 2021. This pattern shows that the use of GEE for NTL is becoming more widespread. At the completion of this study, 8 articles on the use of the GEE in nighttime light applications were recorded for 2022 (May 2022), surpassing all pre-2018 records and this is a testament to active research in this area.
Figure 2. The number of peer-reviewed articles used Google Earth Engine to analyze nighttime lights from 2010 to 2022 (May).
A variety of factors can influence the utilization of GEE for NTL applications and data script sharing is one of them. While many studies stated ‘data available upon request from the author(s),’ some of the studies such as De Klerk and Droogers (Citation2017), Chen et al. (Citation2021) and Ye et al. (Citation2021), shared the codes used in their GEE-NTL research. This, along with multiple blogs and forums such as GitHub has the potential to further increase of GEE-NTL research outputs.
3.2. Geographical distribution of publications
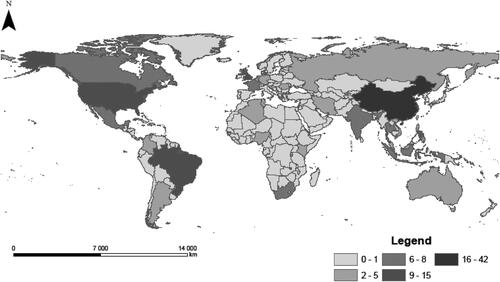
Research evidence have shown that the use of GEE in NTL applications is a global subject with studies at country, continent, and global scales. Out of 73 articles, 60 were country-specific research applications, the geographic distribution of which is shown in . About 9 articles covered 3 continents (4 in Africa, 3 in Asia and 2 in Europe) and the remaining 4 the entire globe (See ). shows that the most GEE-NTL publications came from China (31), followed by the USA (5), Indonesia (4), Brazil (3) and the rest of the publications were distributed in other countries. Few publications are observed in African countries, with South Africa falling into the 6 to 8 publications category.
Figure 3. Geographic distribution of articles based on their location by country.
3.3. General information and applications
All 73 articles that met the search criteria were published in 42 subject journals spanning pivotal remote sensing and multidisciplinary peer-reviewed journals, and their proportions are shown in . Of the total, 4 articles were published as conference-related journals, and 69 were published in peer-reviewed journals. Most of the articles were published in Remote Sensing (19), possibly due to a series of special issues on the NTL research in that journal (see e.g. Link).
Figure 4. The number of GEE-based NTL articles published in each journal.
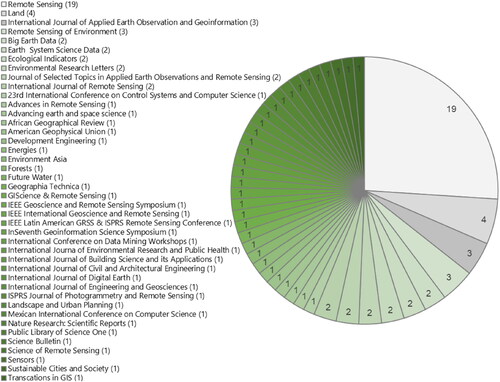
This is followed by Land (4), International Journal of Applied Earth Observation and Geoinformation and Remote Sensing of Environment (3 each), Big Earth Data, Earth System Science Data, Ecological Indicators, Environmental Research Letters, Journal of Selected Topics in Applied Earth Observations and Remote Sensing, International Journal of Remote Sensing (2 each) and the rest had one articles published in them.
It is important to note that NTL studies have used DMSP-OLS, VIIRS-DNB, or Luojia-1 sensors as the primary and ancillary dataset and in some cases combined NTL sensors, and therefore the number of sensors could exceed to the number of articles. This is illustrated in , which summarizes the frequency of NTL sensors as extracted from the literature. As expected, the VIIRS NTL sensor was the most used product (49) due to improved properties as summarized in (Elvidge et al. Citation2013). The use of the NTL VIIRS-DNB has increased over time, and in 2021 alone, VIIRS was deployed over 20 times. With its current longest record, the DMSP-OLS sensor is the second most used sensor in GEE-NTL studies with a total of 33 applications. The Luojia01-1 sensor, which is a relatively new NTL sensor launched in 2018, has only a few applications (3) so far. Although DMSP-OLS data is still used, its popularity has since become largely overtaken – but not completely – by the VIIRS.
Figure 5. NTL sensors used in GEE.
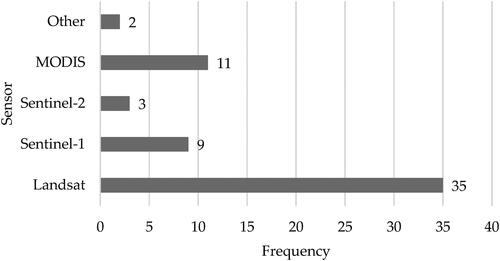
The GEE platform offers several benefits for geospatial analysis, including access to analysis-ready products. The NTL studies also took advantage of GEE and their analysis was often complemented by the use of single or multiple datasets, and the products commonly used are shown in . Landsat appears to be the most widely used dataset, and its longevity may be the main reason for its preference. The Moderate Resolution Imaging Spectroradiometer (MODIS) is another widely used NTL complementary product that is freely available with high temporal resolution than its counterparts, and is mainly applied at large geographic scales. A number of NTL studies also used Sentinel-1 (9) and Sentinel-2 (3) datasets to achieve their goals. Few articles used Google Earth for their analysis. It should be noted that some studies used NTL data as an auxiliary dataset to various other datasets for verification purposes.
Figure 6. Remotely sensed products used along with NTL data.
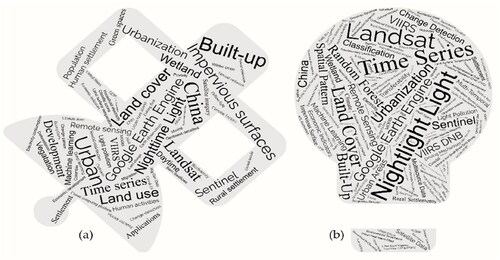
Keyword and title analysis is an important way to uncover the core content of the research article. Here, we used word cloud to analyze the frequency of keywords of eligible articles and the results showing the size of each word in relation to its frequency are shown in . The terms ‘Google Earth Engine,’ ‘Nighttime light,’ ‘Built-up,’ ‘Land cover,’ and ‘Urban’ amongst the commonly used words in titles (). The main keywords or index terms as given in each publication were used to create the word cloud of keywords in . The main words used in the keywords of the papers are ‘Google Earth Engine,’ ‘Nighttime light,’ ‘Landsat,’ ‘Urbanization,’ and so on.
Figure 7. Word cloud of titles (a) and keywords (b) of GEE-based NTL studies.
3.4. Associated themes in the GEE-NTL applications
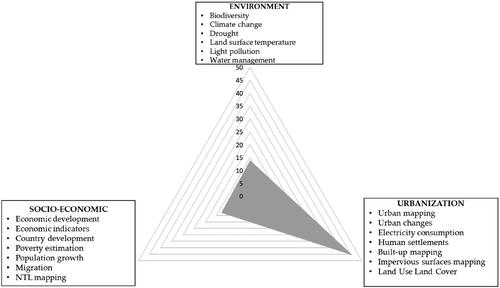
The transformational potential offered by GEE is particularly attractive and has enabled researchers to exploit NTL data for a variety of thematic applications. Overall, we find it convenient to group the applications into three related but distinct broad categories: urbanization (urban studies), environment, and socio-economic characteristics of the population, all of which are illustrated in . Most articles (46) were on urbanization issues, 14 studies focused on environmental applications, and socio-economic studies occupied the last 13 of the total.
Figure 8. Associated themes in the GEE-NTL applications.
3.4.1. Urbanization
Almost two-thirds of the eligible articles focused on urbanization cities, most of which were conducted in Asia, including China, Vietnam, and India. China is known as a country of rapid urbanization and with the economic reform that was introduced in 1978, the country’s economy continues to develop. Rapidly urbanizing cities like Shanghai, Beijing and Tangshan are prime candidates for detection analysis via NTL data (Chen et al. Citation2019). The VIIR-DNB sensor seems to be the preferred choice for this application over the DMSP-OLS sensor due to its enhanced detection capabilities (Zheng et al. Citation2021). Studies assessing the development and land changes of urban areas and urbanization in general are the main studies using VIIRS-DNB NTL data, followed by mapping of artificial or impervious surfaces in urban areas and settlements (Hutasavi and Chen Citation2021). Land change studies range from examining and mapping LULC changes and their driving mechanisms to studies assessing the changes in coastal areas and assessing the impacts of human-induced activities on various aspects of LULC for example, human impacts on vegetation cover and impacts of mining activities on environmental health (Li et al. Citation2020; Chu et al. Citation2020; Kimijima et al. Citation2021). Using NTL imagery within the GEE environment, it was possible to identify urban boundaries and observe large-scale urban classifications. For example, Luqman et al. (Citation2019) proposed the Built-up, Nighttime Light, and Travel time for Urban Size (BUNTUS) algorithm to delineate urban boundaries. The algorithm integrates built-up area from Landsat, NTL classification of VIIR-DNB and DMSP-OLS products sampled at a native Landsat resolution of 30 m - all retrieved from the GEE, and travel time calculation. The algorithm aims to analyze issues such as the energy efficiency of cities in terms of size and development, and links to pollutants (Thompson et al. Citation2020). The GEE also offers a unique ability to overlay true color or street images, where users can manually visualize the classification result. Most of these studies used DMSP-OLS and VIIRS-DNB NTL products to improve the accuracy of built-up land classification. The first GEE-NTL publication observed in 2014 was under the category of urbanization studies, and the urbanization category has become a dominant application in this context. The first GEE-NTL publication in 2014 fell under the urbanization studies category and the urbanization category has become a dominant application in this context. Other studies in this category have mapped human settlements (Trianni et al. Citation2014; Patel et al. Citation2015; Gong et al. Citation2019; Shi et al. Citation2022). Zhang and Zhang (Citation2020) and Guo et al. (Citation2022) used NTL data in distinguish artificial surfaces from bare land. More recently, Rudiastuti et al. Citation2021; Tang et al. Citation2021; Huang et al. Citation2021; Zheng et al. Citation2021; Kovács Citation2022) used GEE for NTL mapping.
3.4.2. Environmental studies
The NTL has been used to a great effect in the study of environmental issues related to human activities, ranking third in the studies reviewed. The DMSP-OLS NTL sensor was observed in the environmental studies as the most commonly used NTL data source. This was likely influenced by nearly two decades of its recording (Beresford et al. Citation2020). Studies range from land surface temperature and urban heat island assessment, to wetland mapping and assessment, to threats to key biodiversity areas (Duan et al. Citation2019; Beresford et al. Citation2020; Shen et al. Citation2022). De Klerk and Droogers (Citation2017) examined the capabilities of satellite imagery in water management. GEE offers extensive datasets containing NTL data that can be used for various purposes in environmental studies (Zhao et al. Citation2020; Chu et al. Citation2020). This includes datasets used for wetland mapping and classification, identifying threats to important biodiversity areas, and studying other environmental issues such as mapping local climates (Shi and Ling Citation2021). For example, Beresford et al. (Citation2020) utilized GEE to access the threats to key biodiversity areas by mapping tree cover loss versus the spread of stable nighttime lights using both the DMSP-OLS and VIIRS-DNB NTL imagery.
3.4.3. Socio-economic dynamics
While there is a large overlap in the human development issues detected by NTL, the socio-economic characterization of the population accounted for the smallest number of studies reviewed. Again, China seems to dominate this application using the GEE. Compared to the GDP of the area, NTL works well as an indicator of economic development. (Mellander et al. Citation2015; Li et al. Citation2022), hence, VIIRS-DNB and DMSP-OLS NTL data are almost equally used in the socio-economic studies. These studies range from the assessment of economic development, estimation of economic indicators, and exploring anthropogenic changes and migrations (Wu and Tan Citation2019; Che and Gamba Citation2020; Chen et al. Citation2021; Drăghici and Ciobanu, Citation2021). Agapiou (Citation2017) assessed opportunities that big satellite data such as Landsat series and DMSP-OLS NTL data can offer when applied in GEE. Landsat and Sentinel imageries were mainly utilized to aid with urban extraction in some of these studies. GEE offers ease of access to broad geological coverage and good temporal resolution NTL data. This data was used by Fu et al. (2021) to investigate stable light sources that were correlated with the economic data (GDP) to analyze economic development of developing Asian and African countries.
4. Discussion
An objective historical and contextual analysis of the GEE-NTL research revealed a high potential of free cloud computing for nocturnal quantification, offering an accurate, inexpensive and unprecedented way to map the global distribution and concentration of human development. Our results have shown that the GEE has evolved over the years into a critical scientific research platform for nighttime light analysis. As expected, the GEE-based NTL applications are broad: geographically, they include 73 articles conducted in 33 countries around the world; thematically, they range from urbanization, land cover and land use, environment and socio-economic characteristics that strongly correlate with the NTL signature. Of these, China has attracted much attention in the literature due to its dramatic urbanization (Chen et al. (Citation2016). Most GEE-NTL studies have provided insights into urbanization and myriad human-induced activities, particularly where statistical data is lacking, underscoring the value of nocturnal light data in understanding human development around the world (Bennett and Smith Citation2017).
The GEE-NTL studies have integrated a wide assortment of sensors to validate or examine related human-induced activities. These include the widely utilized Landsat series, which corresponds with common NTL sensors (DMSP-OLS; 1992–2013), (VIIRS DNB; 2014–present) and (Luojia01-1; 2018–present) due to their longest record. Despite their useful application, Landsat data in some cases presented challenges from frequent cloud contamination, severely compromising accuracy (Xu et al. Citation2021). In addition, good-quality Landsat scenes are limited in earlier years, adding an element uncertainty (Gong et al. Citation2019). The recent launch of Landsat-9 combined with Landsat-8 offers an 8-day revisit period; this increases the likelihood of cloudless scenes (Hemati et al. Citation2021), which could further escalate its use in NTL studies. Also, the GEE built-in algorithms ‘ee.reduceResolution’ and ‘ee.reproject’ allow NTL data to aggregate smaller pixels into a larger pixel and enforce the image to be computed and analyzed in a specific projection that correspond to native Landsat resolution (Guo et al. Citation2022). For example, Zhang et al. (Citation2015) successfully delineated global urban areas with a spatial resolution of 30 m using Landsat-derived Normalized Difference Vegetation Index and DMSP-OLS NTL in GEE. Other sensors include high temporal resolution MODIS, Sentinel-1 and −2 satellite products, while Google Earth has also been used to a lesser extent. These satellite products provide important information on human development issues, moreover, NTL data have greatly improved the detection of concentrated developments, which is important for applications such as LULC (Ye et al. Citation2021). Embedding NTL data in the GEE platform greatly improves the detection of areas of rapid development growth through the burden of data management and processing. This is further enhanced by the GEE data sharing capabilities where users, including non-professionals, can exchange script codes and seek guidance from specialists; this has the potential to take the NTL research to a higher level. The main feature of GEE-based NTL research is that the mapping can be performed quickly (Guo et al. Citation2022), even on a global scale (Gong et al. Citation2019), which can be limited when using other geospatial tools.
Despite these encouraging results, there appear to be relatively few instances where NTL have been less successful. Rural areas with scattered light are often considered hard to map and as invisible in the NTL images. This is due to the sparse distribution of economic activities in rural area of which are often too weak to be detected by sensors and also its low population density making rural areas to have inconsistent NTLs (Xu et al. Citation2021). This has resulted in rural areas receiving less attention when it comes to NTL applications compared to urban areas. The relatively small, low density of NTL coverage and fragmented organization results in the validity of analysis in the rural areas to be somewhat low and insignificant (Zhao et al. Citation2020; Li et al. Citation2020). Researchers should therefore be advised to be careful when applying NTL data in rural areas.
On the other hand, the GEE platform also has its own limitations and challenges. Due to low-end servers underlying GEE’s computing system, which limit the scaling of datasets that can be loaded onto any server, it is difficult for users to use the Earth Engine library’s parallel processing primitives to define complex computations. The GEE platform has a memory limit of 200 bytes per pixel and a limit of 100 MB on the amount of individual objects that can be cached (Gorelick et al. Citation2017). For example, when extracting data to train a machine learning algorithm, this limitation is common and can limit the total number of points in a training set. Complex and large data analysis therefore requires the use of anexternal programming language such as Python for effective analysis interaction. Wu (Citation2020) developed ‘geemap,’ a Python package that improves the documentation and functionality when visualising results in GEE. The development of this type of packages has led to a growing rate of integration of GEE and Python, opening opportunities for greater adoption of this application (Tamiminia et al. Citation2020).
5. Future prospects
The world population continues to grow, resulting in rapid growth of urban areas in many countries around the world. Given the importance of this expected pattern, the GEE has become the popular tool to quantify and map the manifestations of these events around the world. These studies have revealed the possibilities of mapping NTL in the context of various human developments and paved the way for users in data-poor countries to leverage these resources in regions progressing at varying levels. The current and future algorithms in this context are both a task and an opportunity, as the BUNTUS also hold much promise to reveal complex patterns related to human activities. New NTL products like Luojia01-1 with improved spatio-temporal details are hoped to be made available in GEE and including sensors to be launched in future. Apart from these resources, what is most promising is that institutions and governments of different countries support this kind of studies.
6. Conclusions
This article provides an integrated overview of studies using the Google Earth Engine for nocturnal light detection. Research has grown steadily over the years, with much work being conducted in rapidly urbanizing cities, including China. Beyond urbanization, GEE-NTL studies extensively examined environmental and socio-economic dynamics of different regions of the world. The NTL product VIIRS-DNB has been widely used due to its relatively better properties than the DMSP-OLS, and the recently launched Luojia01-1 also shows growing application, although it is not currently available in the GEE archive. The studies also integrated various multi-source satellite products to validate the expansion of human activity, including the widely used Landsat, others being Sentinel, and MODIS satellite datasets. The combined 8-day temporal resolution of Landsat-8 and −9 increases the likelihood of cloudless scenes, particularly over tropical regions, and could further enhance this product’s integration for NTL applications.
Overall, the GEE should be considered a useful platform to conduct all aspects of NTL research, although few limitations exist. This review paper provided all the basic information needed to understand the dynamics of NTL application studies conducted using the GEE platform and its benefits, which include the ability to store, download, analyze and virtualize large or massive data. GEE provides regularly updated, ready-to-use medium and high resolution data that can be evaluated with different algorithms and approaches for different NTL applications. Almost all of the studies reviewed in this paper had an organization that had provided them with funds.
Disclosure statement
The authors declare no conflict of interest.
Additional information
Funding
References
- Adelabu SA, Olusola AO. 2021. Remote sensing of nighttime light: progress, prospects and possibilities in Africa (2013–2021). In Proceedings of the 2021 IEEE Internatioanl Geoscience andRemote Sensing Symposium IGARSS; July 11–16; Brussels, Belgium, pp. 4484–4487. [Accessed 2022 April 01] https://doi.org/10.1109/IGARSS47720.2021.9553473.
- Agapiou A. 2017. Remote sensing heritage in a petabyte-scale: satellite data and heritage earth engine\copyright applications. Int J Digit Earth. 10(1):85–102.
- Alonso A, Muñoz-Carpena R, Kennedy RE, Murcia C. 2016. Wetland landscape spatio-temporal degradation dynamics using the new google earth engine cloud-based platform: opportunities for non-specialists in remote sensing. Trans ASABE. 59(5):1331–1342.
- Amani M, Brisco B, Afshar M, Mirmazloumi SM, Mahdavi S, Mirzadeh SMJ, Huang W, Granger JA. 2019. Generalized supervised classification scheme to produce provincial wetland inventory maps: an application of google earth engine for big geo data processing. Big Earth Data. 3(4):378–394.
- Aromataris E,Pearson A. 2014. The systematic review: An overview. Am J Nurs. 114(3):53–58.
- Ayudyanti AG, Hidayati IN. 2021. The identification of relationship between light pollution and roosting sites of Barn Swallows using VIIRS DNB imagery (Case study: Java and Bali Islands). Environ Asia. 14(2):64–74
- Bagheri S, Karimzadeh S, Feizizadeh B. 2022. Investigation and modeling of physical development of urban areas and its effects on light pollution using night light data. Int J Eng Geosci. 8(1):98–110.
- Baugh K, Elvidge CD, Ghosh T, Ziskin D. 2010. Development of a 2009 stable lights product using DMSP-OLS data. APAN Proc. 30(0):114.
- Bennett MM, Smith LC. 2017. Advances in using multitemporal night-time lights satellite imagery to detect, estimate, and monitor socioeconomic dynamics. Remote Sens Environ. 192:176–197.
- Benz SA, Burney JA. 2021. Widespread race and class disparities in surface urban heat extremes across the United States. Earth’s Future. 9(7):e2021EF002016.
- Beresford AE, Donald PF, Buchanan GM. 2020. Repeatable and standardised monitoring of threats to key biodiversity areas in Africa using google earth engine. Ecol Indic. 109:105763.
- Camargo G, Sampayo AM, Peña Galindo A, Escobedo FJ, Carriazo F, Feged-Rivadeneira A. 2020. Exploring the dynamics of migration, armed conflict, urbanization, and anthropogenic change in Colombia. PLoS One. 15(11):e0242266.
- Che M, Gamba P. 2020. Change pattern exploration with hierarchical bi-clustering on Sentinel-1 SAR and nighttime light data. In 2020 IEEE Latin American GRSS & ISPRS Remote Sensing Conference (LAGIRS); March 22–26; Santiago, Chile, pp. 48–53. [Accessed 2022 April 14]. https://doi.org/10.1109/LAGIRS48042.2020.9165612
- Chen D, Wang Y, Shen Z, Liao J, Chen J, Sun S. 2021. Long time-series mapping and change detection of coastal zone land use based on google earth engine and multi-source data fusion. Remote Sens. 14(1):1.
- Chen M, Liu W, Lu D. 2016. Challenges and the way forward in China’s new-type urbanization. Land Use Policy. 55:334–339.
- Chen THK, Prishchepov AV, Fensholt R, Sabel CE. 2019. Detecting and monitoring long-term landslides in urbanized areas with nighttime light data and multi-seasonal Landsat imagery across Taiwan from 1998 to 2017. Remote Sens Environ. 225:317–327.
- Chen Z, Yu B, Ta N, Shi K, Yang C, Wang C, Zhao X, Deng S, Wu J. 2019. Delineating seasonal relationships between Suomi NPP-VIIRS nighttime light and human activity across Shanghai, China. IEEE J Sel Top Appl Earth Observ Remote Sens. 12(11):4275–4283.
- Chen Z, Yu B, Yang C, Zhou Y, Yao S, Qian X, Wang C, Wu B, Wu J. 2021. An extended time series (2000–2018) of global NPP-VIIRS-like nighttime light data from a cross-sensor calibration. Earth Syst Sci Data. 13(3):889–906.
- Chu L, Oloo F, Bergstedt H, Blaschke T. 2020. Assessing the link between human modification and changes in land surface temperature in Hainan, China using image archives from google earth engine. Remote Sens. 12(5):888.
- Chu L, Oloo F, Sudmanns M, Tiede D, Hölbling D, Blaschke T, Teleoaca I. 2020. Monitoring long-term shoreline dynamics and human activities in the Hangzhou Bay, China, combining daytime and nighttime EO data. Big Earth Data. 4(3):242–264.
- Chung LCH, Xie J, Ren C. 2021. Improved machine-learning mapping of local climate zones in metropolitan areas using composite earth observation data in google earth engine. Build Environ. 199:107879.
- De Klerk M, Droogers P. 2017. Earth by night: exploring night light satellites imagery for water management. Wageningen: FutureWater.
- Dlamini WM, Dlamini LC. 2021. Spatial assessment and monitoring of household electricity access and use using nighttime lights and ancillary spatial data: a case of Eswatini. Afr Geogr Rev. 47:1–19.
- Drăghici MR,Ciobanu RI. 2021. Insights Into Romania’s Economic Development Using Satellite Imagery. In: 2021 23rd International Conference on Control Systems and Computer Science (CSCS). IEEE(2021):536–543.
- Drăghici MR, Ciobanu RI. 2021. Insights into Romania’s economic development using satellite imagery. In Proceedings of the 2021 23rd International Conference on Control System Computer Science (CSCS); May 26–28; Bucharest, Romania, pp. 536–543. [Accessed 2022 April 20]. https://doi.org/10.1109/CSCS52396.2021.00093.
- Duan Q, Tan M, Guo Y, Wang X, Xin L. 2019. Understanding the spatial distribution of urban forests in China using Sentinel-2 images with google earth engine. Forests. 10(9):729.
- Elvidge CD, Baugh KE, Zhizhin M, Hsu FC. 2013. Why VIIRS data are superior to DMSP for mapping nighttime lights. Proc Asia-Pac Adv Netw. 35(0):62.
- Falchetta G, Noussan M. 2019. Interannual variation in night-time light radiance predicts changes in national electricity consumption conditional on income-level and region. Energies. 12(3):456.
- Fu XH, Zarro C, De Pasquale D, Ullo SL. 2021. Investigating development of countries through nightlights. In Proceedings of the 2021 International Geoscience and Remote Sensing Symposium IGARSS; July 11–16; Brussels, Belgium, pp. 5795–5798. [Accessed 2022 April 19]. https://doi.org/10.1109/IGARSS47720.2021.9554736.
- Goldblatt R, Deininger K, Hanson G. 2018. Utilizing publicly available satellite data for urban research: mapping built-up land cover and land use in Ho Chi Minh City, Vietnam. Dev Eng. 3:83–99.
- Goldblatt R, Stuhlmacher MF, Tellman B, Clinton N, Hanson G, Georgescu M, Wang C, Serrano-Candela F, Khandelwal AK, Cheng W-H, et al. 2018. Using Landsat and nighttime lights for supervised pixel-based image classification of urban land cover. Remote Sens Environ. 205:253–275.
- Goldblatt R, You W, Hanson G, Khandelwal AK. 2016. Detecting the boundaries of urban areas in India: a dataset for pixel-based image classification in google earth engine. Remote Sens. 8(8):634.
- Gong P, Li X, Zhang W. 2019. 40-Year (1978–2017) human settlement changes in China reflected by impervious surfaces from satellite remote sensing. Sci Bull. 64(11):756–763.
- Gorelick N, Hancher M, Dixon M, Ilyushchenko S, Thau D, Moore R. 2017. Google earth engine: planetary-scale geospatial analysis for everyone. Remote Sens Environ. 202:18–27.
- Gu C, Zhang Y, Liu L, Li L, Li S, Zhang B, Cui B, Rai MK. 2021. Qualifying land use and land cover dynamics and their impacts on ecosystem service in Central Himalaya transboundary landscape based on google earth engine. Land. 10(2):173.
- Guo X, Ye J, Hu Y. 2022. Analysis of land use change and driving mechanisms in Vietnam during the period 2000–2020. Remote Sens. 14(7):1600.
- Hemati M, Hasanlou M, Mahdianpari M, Mohammadimanesh F. 2021. A systematic review of Landsat data for change detection applications: 50 years of monitoring the earth. Remote Sens. 13(15):2869.
- Higgins JP, Altman DG, Gøtzsche PC, Jüni P, Moher D, Oxman AD, Savović J, Schulz KF, Weeks L, Sterne JA. 2011. The cochrane collaboration’s tool for assessing risk of bias in randomised trials. BMJ. 343(oct18 2):d5928–d5928.
- Hu Y, Hu Y. 2019. Land cover changes and their driving mechanisms in central Asia from 2001 to 2017 supported by google earth engine. Remote Sens. 11(5):554.
- Huang Q,Yang X,Gao B,Yang Y,Zhao Y. 2014. Application of DMSP/OLS nighttime light images: A meta-analysis and a systematic literature review. Remote Sens. 6(8):6844–6866.
- Huang C, Xu N. 2022. Climatic factors dominate the spatial patterns of urban green space coverage in the Contiguous United States. Int J Appl Earth Obs Geoinf. 107:102691.
- Huang C, Yang J, Clinton N, Yu L, Huang H, Dronova I, Jin J. 2021. Mapping the maximum extents of urban green spaces in 1039 cities using sense satellite images. Environ Res Lett. 16(6):064072.
- Hutasavi S, Chen D. 2021. Multi-temporal mapping of built-up areas using daytime and nighttime satellite images based on google earth engine platform. Int J Civil Eng Archit. 15(6):345–353.
- Jeswani R,Kulshrestha A,Gupta PK,Srivastav S. 2019. Evaluation of the consistency of DMSP-OLS and SNPP-VIIRS Night-time Light Datasets. J Geomat. 13:98–105.
- Ji H, Li X, Wei X, Liu W, Zhang L, Wang L. 2020. Mapping 10-m resolution rural settlements using multi-source remote sensing datasets with the google earth engine platform. Remote Sens. 12(17):2832.
- Kimijima S, Sakakibara M, Nagai M. 2021. Detection of artisanal and small-scale gold mining activities and their transformation using earth observation, nighttime light, and precipitation data. IJERPH. 18(20):10954.
- Kitchenham B. 2004. Procedures for performing systematic reviews. Keele: Keele University. 33, pp. 1–26.
- Kovács KD. 2022. Nighttime light emissions explain the decline in NO2 during a COVID-19-induced total lockdown in France. GT. 17(1/2022):104–115.
- Levin N, Kyba CC, Zhang Q, Sánchez de Miguel A, Román MO, Li X, Portnov BA, Molthan AL, Jechow A, Miller SD, et al. 2020. Remote sensing of night lights: a review and an outlook for the future. Remote Sens. Environ. 237:111443.,
- Li G, Li L, Lu D, Guo W, Kuang W. 2020. Mapping impervious surface distribution in China using multi-source remotely sensed. Data. GIsci. Remote Sens. 57(4):543–552.
- Li H, Wan W, Fang Y, Zhu S, Chen X, Liu B, Hong Y. 2019. A google earth engine-enabled software for efficiently generating high-quality user-ready landsat mosaic images. Environ Model Softw. 112:16–22.
- Li J, Wang J, Zhang J, Liu C, He S, Liu L. 2022. Growing-season vegetation coverage patterns and driving factors in the China-Myanmar economic corridor based on google earth engine and geographic detector. Ecol Indic. 136:108620.
- Li Q, Qiu C, Ma L, Schmitt M, Zhu XX. 2020. Mapping the land cover of Africa at 10 m resolution from multi-source remote sensing data with google earth engine. Remote Sens. 12(4):602.
- Li X, Gong P, Zhou Y, Wang J, Bai Y, Chen B, Hu T, Xiao Y, Xu B, Yang J, et al. 2020. Mapping global urban boundaries from the global artificial impervious area (GAIA) data. Environ Res Lett. 15(9):094044.,
- Li X, Zhou Y, Zhao M, Zhao X. 2020. A harmonized global nighttime light dataset 1992–2018. Sci Data. 7(1):168.
- Liao YA, Garcia-Mondragon L, Konac D, Liu X, Ing A, Goldblatt R, Barker E. 2022. Nighttime lights, urban features, household poverty, depression, and obesity. Curr Psychol. 41(1):1–17.
- Liu Q, Zhang Y, Liu L, Wang Z, Nie Y, Rai M. 2021. A novel Landsat-based automated mapping of marsh wetland in the headwaters of the Brahmaputra, Ganges and Indus Rivers, Southwestern Tibetan Plateau. Int J Appl Earth Obs Geoinf. 103:102481.
- Liu X, de Sherbinin A, Zhan Y. 2019. Mapping urban extent at large spatial scales using machine learning methods with VIIRS nighttime light and MODIS daytime NDVI data. Remote Sens. 11(10):1247.
- Liu X, Hu G, Chen Y, Li X, Xu X, Li S, Pei F, Wang S. 2018. High-resolution multi-temporal mapping of global urban land using Landsat images based on the google earth engine platform. Remote Sens Environ. 209:227–239.
- Luqman M, Rayner PJ, Gurney KR. 2019. Combining measurements of built-up area, nighttime light, and travel time distance for detecting changes in urban boundaries: introducing the BUNTUS algorithm. Remote Sens. 11(24):2969.
- Ma Y, Wu H, Wang L, Huang B, Ranjan R, Zomaya A, Jie W. 2015. Remote sensing big data computing: challenges and opportunities. Future Gener Comput Syst. 51:47–60.
- Mahdianpari M, Brisco B, Granger J, Mohammadimanesh F, Salehi B, Homayouni S, Bourgeau-Chavez L. 2021. The third generation of Pan-Canadian wetland map at 10 m resolution using multisource earth observation data on cloud computing platform. IEEE J Sel Top Appl Earth Observ Remote Sens. 14:8789–8803.
- Mellander C, Lobo J, Stolarick K, Matheson Z. 2015. Night-time light data: a good proxy measure for economic activity? PLoS One. 10(10):e0139779.
- Moher D, Liberati A, Tetzlaff J, Altman DG, Group P. 2009. Preferred reporting items for systematic reviews and meta-analyses: the PRISMA statement. Ann Intern Med. 151(4):264–269, W64.
- Munn Z, Peters MD, Stern C, Tufanaru C, McArthur A, Aromataris E. 2018. Systematic review or scoping review? Guidance for authors when choosing between a systematic or scoping review approach. BMC Med Res Methodol. 18(1):1–7.
- Mutanga O, Kumar L. 2019. Google earth engine Applications. Remote Sens. 11(5):591.
- Pan L, Xia H, Zhao X, Guo Y, Qin Y. 2021. Mapping winter crops using a phenology algorithm, time-series Sentinel-2 and Landsat-7/8 images, and google earth engine. Remote Sens. 13(13):2510.
- Patel NN, Angiuli E, Gamba P, Gaughan A, Lisini G, Stevens FR, Tatem AJ, Trianni G. 2015. Multitemporal settlement and population mapping from Landsat using google earth engine. Int J Appl Earth Obs Geoinf. 35:199–208.
- Patel NN, Stevens FR, Huang Z, Gaughan AE, Elyazar I, Tatem AJ. 2017. Improving large area population mapping using geotweet densities. Trans GIS. 21(2):317–331.
- Rudiastuti AW, Farda NM, Ramdani D. 2021. Mapping built-up land and settlements: a comparison of machine learning algorithms in google earth engine. In Proc. Seventh Geoinformarion Science Symposium SPIE; December 22; Yogyakarta, Indonesia. Vol. 12082, p. 42–52. [Accessed 2022 April 20]. https://doi.org/10.1117/12.2619493.
- Ruiz J, Caballero I, Navarro G. 2019. Sensing the same fishing fleet with AIS and VIIRS: a seven-year assessment of Squid Jiggers in FAO major fishing area 41. Remote Sens. 12(1):32.
- Sánchez de Miguel A, Bennie J, Rosenfeld E, Dzurjak S, Gaston KJ. 2021. First estimation of global trends in nocturnal power emissions reveals acceleration of light pollution. Remote Sens. 13(16):3311.
- Sanchez de MA, Kyba C, Zamorano J, Gallego J, Gaston KJ. 2020. The nature of the diffuse light near cities detected in nighttime satellite imagery. Sci Rep. 10(1):1–16.
- Savory DJ, Andrade-Pacheco R, Gething PW, Midekisa A, Bennett A, Sturrock HJ. 2017. Intercalibration and Gaussian process modeling of nighttime lights imagery for measuring urbanization trends in Africa 2000–2013. Remote Sens. 9(7):713.
- Sengupta D, Chen R, Meadows ME, Choi YR, Banerjee A, Zilong X. 2019. Mapping trajectories of coastal land reclamation in nine deltaic megacities using google earth engine. Remote Sens. 11(22):2621.
- Shaffril H,Ahmad N,Samsuddin SF,Samah AA,Hamdan ME. 2020. Systematic literature review on adaptation towards climate change impacts among indigenous people in the Asia Pacific regions. J Clean Prod. 258:120596.
- Shen Z, Wang Y, Su H, He Y, Li S. 2022. A bi-directional strategy to detect land use function change using time-series landsat imagery on google earth engine: a case study of Huangshui river basin in China. Sci Remote Sens. 5:100039.
- Shi L, Ling F. 2021. Local climate zone mapping using multi-source free available datasets on google earth engine platform. Land. 10(5):454.
- Shi L, Wurm M, Huang X, Zhong T, Leichtle T, Taubenböck H. 2022. Estimating housing vacancy rates at block level: the example of Guiyang, China. Landsc Urban Plan. 224:104431.
- Sudmanns M,Tiede D,Lang S,Bergstedt H,Trost G,Augustin H,Baraldi A,Blaschke T. 2020. Big Earth data: Disruptive changes in Earth observation data management and analysis?. Int J Digit Earth. 13(7):832–850.
- Sun J, Di L, Sun Z, Wang J, Wu Y. 2020. Estimation of GDP using deep learning with NPP-VIIRS imagery and land cover data at the county level in CONUS. IEEE J Sel Top Appl Earth Observ Remote Sens. 13:1400–1415.
- Sun Y, Wang S, Wang Y. 2020. Estimating local-scale urban heat island intensity using nighttime light satellite imageries. Sustain Cities Soc. 57:102125.
- Sun Z, Xu R, Du W, Wang L, Lu D. 2019. High-resolution urban land mapping in China from Sentinel-1 A/2 imagery based on google earth engine. Remote Sens. 11(7):752.
- Szuster BW,Chen Q,Borger M. 2011. A comparison of classification techniques to support land cover and land use analysis in tropical coastal zones. Appl Geogr. 31(2):525–532.
- Tamiminia H, Salehi B, Mahdianpari M, Quackenbush L, Adeli S, Brisco B. 2020. Google earth engine for geo-big data applications: a meta-analysis and systematic review. ISPRS J. Photogramm. Remote Sens. 164:152–170.
- Tang Y, Shao Z, Huang X, Cai B. 2021. Mapping impervious surface areas using time-series nighttime light and MODIS imagery. Remote Sens. 13(10):1900.
- Tapia-McClung R, Silván-Cárdenas JL. 2021. Exploring spatiotemporal urbanization through a hybrid remote sensing-geovisual analytics approach. In Proceedings of the 2021 Mexican International Conference on Computer Science (ENC); August 9–11; Morelia, Mexico. pp. 1–8. [Accessed 2022 April 19]. https://doi.org/10.1109/ENC53357.2021.9534805.
- Thompson J, Stevenson M, Wijnands JS, Nice KA, Aschwanden GD, Silver J, Nieuwenhuijsen M, Rayner P, Schofield R, Hariharan R, et al. 2020. A global analysis of urban design types and road transport injury: an image processing study. Lancet Planet Health. 4(1):e32–e42.
- Trianni G, Angiuli E, Lisini G, Gamba P. 2014. Human settlements from Landsat data using google earth engine. IEEE Geoscience and Remote Sensing Symposium; July 13–18; Quebec City, QC, Canada. pp. 1473–1476. [Accessed 2022 April 20]. https://doi.org/10.1109/IGARSS.2014.6946715.
- Tu Y, Chen B, Zhang T, Xu B. 2020. Regional mapping of essential urban land use categories in China: a segmentation-based approach. Remote Sens. 12(7):1058.
- Venter ZS, Sydenham MA. 2021. Continental-scale land cover mapping at 10 m resolution over Europe (ELC10). Remote Sens. 13(12):2301.
- Wang L, Diao C, Xian G, Yin D, Lu Y, Zou S, Erickson TA. 2020. A summary of the special issue on remote sensing of land change science with google earth engine. Remote Sens. Environ. 248:112002.
- Wang X, Huang W, Lin X, Liu X, Sun B, Wang H. 2020. Using remote sensing data at google earth engine to analyze the deforestation at the state of Mato Grosso in twenty years. In Proceedings of the AGU Fall Meeting Abstracts; Vol. 2020:p. SY033–0001.
- Wu P, Tan Y. 2019. Estimation of economic indicators using residual neural network Resnet50. In Proceedings of the 2019 International Conference on Data Mining Workshops (ICDMW); November 08–11; Beijing, China. pp. 206–209. [Accessed 2022 April 20]. https://doi.org/10.1109/ICDMW.2019.00039.
- Wu P, Tan Y. 2019. Estimation of poverty based on remote sensing image and convolutional neural network. ARS. 08(04):89–98.
- Wu Q. 2020. Geemap: a Python package for interactive mapping with google earth engine. JOSS. 5(51):2305.
- Xia N, Li M, Cheng L. 2021. Mapping impacts of human activities from nighttime light on vegetation cover changes in Southeast Asia. Land. 10(2):185.
- Xu J, Xiao W, He T, Deng X, Chen W. 2021. Extraction of built-up area using multi-sensor data—a case study based on google earth engine in Zhejiang Province, China. Int. J. Remote Sens. 42(2):389–404.
- Xu R. 2021. Mapping rural settlements from Landsat and Sentinel time series by integrating pixel- and object-based methods. Land. 10(3):244.
- Ye J, Hu Y, Zhen L, Wang H, Zhang Y. 2021. Analysis on land-use change and its driving mechanism in Xilingol, China, during 2000–2020 using the google earth engine. Remote Sens. 13(24):5134.
- Zhang DD, Zhang L. 2020. Land cover change in the central region of the lower Yangtze River based on Landsat imagery and the google earth engine: a case study in Nanjing, China. Sensors. 20(7):2091.
- Zhang Q, Levin N, Chalkias C, Letu H. 2015. Nighttime light remote sensing: monitoring human societies from outer space. Chapter 5 in Remote sensing handbook. Boca Raton, USA: CRC Press, Taylor and Francis; p. 289–310.
- Zhang X, Liu L, Wu C, Chen X, Gao Y, Xie S, Zhang B. 2020. Development of a global 30 m impervious surface map using multisource and multitemporal remote sensing datasets with the google earth engine platform. Earth Syst Sci Data. 12(3):1625–1648.
- Zhang Q, Li B, Thau D, Moore R. 2015. Building a better urban picture: combining day and night remote sensing imagery. Remote Sens. 7(9):11887–11913.
- Zhao F, Ding J, Zhang S, Luan G, Song L, Peng Z, Du Q, Xie Z. 2020. Estimating rural electric power consumption using NPP-VIIRS night-time light, toponym and POI data in ethnic minority areas of China. Remote Sens. 12(17):2836.
- Zhao J, Yu L, Xu Y, Li X, Zhou Y, Peng D, Liu H, Huang X, Zhou Z, Wang D, et al. 2020. Exploring difference in land surface temperature between the city centres and urban expansion areas of China’s major cities. Int J Remote Sens. 41(23):8965–8985.
- Zhao M, Zhou Y, Li X, Cao W, He C, Yu B, Li X, Elvidge CD, Cheng W, Zhou C. 2019. Applications of satellite remote sensing of nighttime light observations: advances, challenges, and perspectives. Remote Sens. 11(17):1971.
- Zheng Q, Weng Q, Wang K. 2021. Characterizing urban land changes of 30 global megacities using nighttime light time series stacks. ISPRS J Photogramm Remote Sens. 173:10–23.
- Zheng Q, Weng Q, Zhou Y, Dong B. 2022. Impact of temporal compositing on nighttime light data and its applications. Remote Sens Environ. 274:113016.