
 ?Mathematical formulae have been encoded as MathML and are displayed in this HTML version using MathJax in order to improve their display. Uncheck the box to turn MathJax off. This feature requires Javascript. Click on a formula to zoom.
Abstract
In this research, the spatial distribution map of agricultural greenhouses in Tartus (Syria) was created using Sentinel-2 and high-resolution Google Earth Pro images in 2020. The potential expansion map of agricultural greenhouses was created by a set of topographic, climatic, ecological, infrastructure and land use-land cover criteria using GIS and remote sensing techniques. Our results show that the area covered by protected agriculture was about 5% of the total study area. Slightly more than half of the study area has constraints on the potential expansion of greenhouses, and two-third of the remaining area has high potential. Assessment of the methodology used in this research indicates high effectiveness with an overall accuracy of 96.6%. The obtained maps can provide vital information for land-use planning and management in Syria. The methodology proposed in this research could be used to map and assess the potential expansion of different cultivations.
1. Introduction
One of the significant challenges facing the future world is to secure food for the ever-growing population. Protected agriculture has developed tremendously and spread widely in more than 50 countries to meet such challenges. In the last decade, a positive trend was observed in protected agriculture at the global and international levels (Sun et al. Citation2021). This growth is mainly due to the main advantages, including the quantitative and qualitative improvement of agricultural production throughout the year, the possibility of reducing diseases and pests, and the effective management of irrigation water.
The agricultural plastic greenhouse has a simple design that uses plastic as covering materials, which can slightly control the climate with low-cost heating and cooling systems (Tognoni et al. Citation1999; Pardossi et al. Citation2004). Plastic greenhouses, as a rule, are mainly located in the Mediterranean countries, in particular, Spain, Italy, Turkey, Syria and Lebanon, as well as in East Asian countries: China, South Korea and Japan. In the Mediterranean basin, vegetables such as tomatoes, peppers, marrows, melons and watermelons are the most common types of greenhouse products.
GIS technologies have been widely and effectively used to solve many practical-scientific tasks in protected agriculture, for example, to reduce the visual impact of greenhouse parks in rural landscapes in Germany (Rogge et al. Citation2008) and to optimize the management of agricultural plastic waste in Italy (Scarascia-Mugnozza et al. Citation2008). They also have been effectively used to analyze agricultural plastic-covered landscapes in Italy (Picuno et al. Citation2011), to create a database of plastic-covered greenhouses in Turkey (Sönmez and Sari Citation2006) and to assess the influence of multiple factors on the state and dynamic of the protected agriculture in China (Ou et al. Citation2019). Conducting such studies requires information on the distribution of greenhouses. Today, satellite images are one of the most effective methods of obtaining such information. GIS and remote sensing techniques have been widely applied to assess the spatial and temporal distribution of agricultural plastic greenhouses, for example, in Kenya (Justus and Yu Citation2014), Oman (Al-maimani et al. Citation2019) and China (Yu et al. Citation2017). Few papers have examined the potential expansion of agricultural greenhouses (Aguilera et al. Citation2008) using the cellular automata model based on the dynamic process of plastic-covered greenhouses. The limitation of using the cellular automata model is that it requires accurate multi-time land cover maps to derive meaningful spatio-temporal relationships between agricultural greenhouses and other land cover types.
Remote sensing techniques to obtain information about plastic-covered greenhouses divide into visual-interactive interpretation and automated methods. The latter has been used extensively for the automatic extraction of greenhouses from high-resolution spatial satellite images: QuickBird (Agüera et al. Citation2006), Ikonos (Agüera et al. Citation2008; Agüera and Liu Citation2009), WorldView-2 (Koc-san Citation2013), GeoEye-1 (Aguilar et al. Citation2014) and GaoFen-2 (Shi et al. Citation2020; Zhang et al. Citation2021). The high cost of high-resolution images has made such studies extremely limited. Freely access satellite images have been used for the detection and mapping of plastic greenhouses: Landsat (Novelli and Tarantino Citation2015; Chaofan et al. Citation2017; Ou et al. Citation2019), Sentinel-2 (Perilla and Mas Citation2019; Sun et al. Citation2021) and multi-sensor imagery (Aguilar et al. Citation2016; Novelli et al. Citation2016). In most of these studies, high accuracy (70–90%) has been achieved, but this accuracy was calculated based on training samples and for relatively small and homogeneous regions. The plastic-covered greenhouse spectral response may vary in large and heterogeneous areas due to the mixed pixels, the different crops inside the greenhouses, and the characteristics of the plastic-covered materials (age, presence of dust and thickness). The automated methods were discussed in detail in the paper (Jiménez-Lao et al. Citation2020). In contrast to automated methods, which reduce the time and effort spent to obtain information, the visual-interactive interpretation method allows obtaining very high accuracy in assessing the spatial distribution of agricultural plastic greenhouses.
Due to the increasing development in GIS technologies and availability of spatial data, in recent years, а multi-criteria analysis has been widely used to assess the suitability of land for various types of crops (Bandyopadhyay et al. Citation2009; Cengiz and Akbulak Citation2009; Mustafa et al. Citation2011; Akıncı et al. Citation2013; Zolekar and Bhagat Citation2015; Herzberg et al. Citation2019). Furthermore, a multi-criteria approach has been widely used to assess the land suitability for growing specific types of agriculture, for example, olive (Elaalem Citation2013), citrus (Zabihi et al. Citation2015, Citation2019; Mokarram and Mirsoleimani Citation2018; Tercan and Ali Citation2020; Orhan Citation2021), wheat (Karimi et al. Citation2018; Yohannes and Soromessa Citation2018; Mohammed et al., 2022) and vineyard (Alganci et al. Citation2019; Alsafadi et al. Citation2020). A GIS-based multi-criteria approach also has been effectively used to assess the suitability of land for tropical and subtropical crops (Elsheikh et al. Citation2013), perennial crops (Shalaby et al. Citation2006), irrigated crops (Feizizadeh and Blaschke Citation2013; Aldababseh et al. Citation2018; Al-taani et al. Citation2021) and rangeland use (Jafari and Zaredar Citation2010). The potential expansion of agricultural greenhouses is related to the suitability of the land, which justifies the use of multi-criteria analysis in our research. Although multi-criteria analysis has been widely performed for land suitability assessment, this analysis, to our knowledge, was not conducted to assess the potential expansion of agricultural lands.
This research aims to map and assess the spatial distribution and potential expansion of agricultural plastic greenhouses in Tartus (Syria) by a set of topographic, climatic, ecological, infrastructure and land use-land cover criteria using GIS and remote sensing techniques.
2. Description of the study area
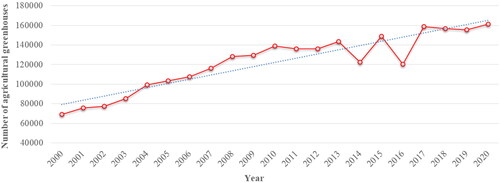
Syria is an agrarian country, where the value of agricultural production is about 20% of the gross domestic product (GDP). Plastic-covered greenhouses began in Syria in 1972 by growing flowers. In 1976, greenhouse cultivation in Syria widely spread when the Food and Agriculture Organization of the International (FAO) established several specialized centres for protected agriculture. According to government statistics, the number of agricultural plastic greenhouses in Syria has increased from 68,905 in 2000 to 161,374 in 2020. The plastic-covered greenhouses in Syria grew linearly from 2000 to 2013 (). During the war between 2011 and 2020, there was hesitation due to fear among farmers facing the risk of price fluctuations and high prices for raw materials needed for greenhouse production. In addition, difficulties arose in exporting products due to the economic sanctions imposed on Syria and the lack of adequate marketing policies.
Figure 1. Evolution and trend of agricultural greenhouses in Syria throughout the first two decades of the 21st century.
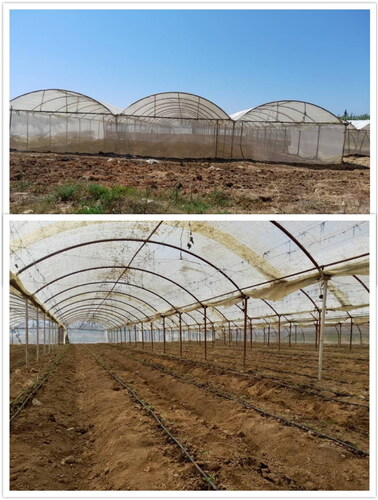
More than 90% of agricultural plastic greenhouses in Syria are located mainly on the coast of the Mediterranean Sea. As a rule, plastic-covered greenhouses in Syria have a low level of technology and simple heating technology, allowing vegetables (mainly tomatoes and cucumbers) to be grown in the winter. Farmers also grow ornamental plants, strawberries, eggplants and other species under greenhouses. Using plastic films as covering materials () and low-cost heating systems, cultivation in plastic greenhouses on the Syrian coast extends from October to June due to the mild winter climate. In Syria, very few crops are grown inside plastic-covered greenhouses in summer due to the relatively high temperatures. Generally, in summer, farmers spread plastic films on the ground to sterilize the soil. Protected cultivation in high-temperature conditions requires using particular plastic films and cooling systems (Abdel-Ghany et al. Citation2016; Dehbi et al. Citation2017). The latter is still not widespread in Syria.
Figure 2. Typical agricultural greenhouse covering materials in Syria.
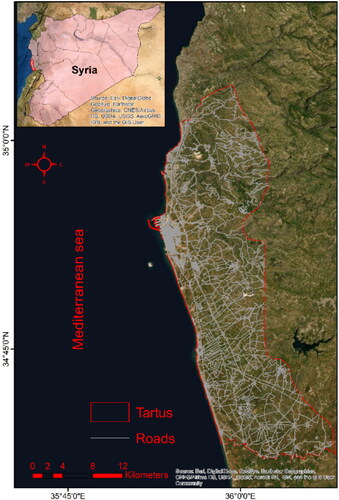
The study area is the city of Tartus, located about 100 km south of Latakia in the Syrian Mediterranean region (). The population is about 200,000 people, most of whom work in the agricultural sector, trade and government and private institutions. Export and import through the city’s seaport are a primary economic resource for the city. Tartus is a tourist centre for those arriving from other cities and countries to relax on the sea in summer. Agriculture is the main economic activity, and protected agriculture is a source of income for many families in Tartus (Ibrahim et al. Citation2014; Khatib and Malinnikov Citation2021a).
Figure 3. The geographical location of the study area.
The dominant soil in Tartus is Red Mediterranean Soil, which is suitable for cultivation. The elevations in the city vary within (–14 to 563 m), increasing from the coast to the east. Tartus has a Mediterranean climate characterized by hot and humid summer and cold and rainy winter. The mean annual temperature is 23 °C, and the warmest month is August, where a mean temperature of 30 °C. January and February are the coldest months, where the mean temperature is 16 °C. The annual rainfall is 814 mm. January, December and February, with a mean rainfall of 161, 152 and 122 mm, respectively, are the rainiest months. The sunniest month is October. The number of sunny days in a year is 118. Protected agriculture, olives and citrus trees are the most widespread agriculture in the eastern Mediterranean basin (Ibrahim et al. Citation2014; Khatib and Malinnikov Citation2021b).
According to government statistics, the number of agricultural plastic greenhouses in the city for 2020 is 83,821. Tomatoes, cucumbers, green peppers and eggplants are the main species cultivated in greenhouses. A sufficiently large number of sunny days and high rainfall with a mild temperature in the city made it possible to grow vegetables in agricultural plastic greenhouses with a low level of technology.
3. Materials and methods
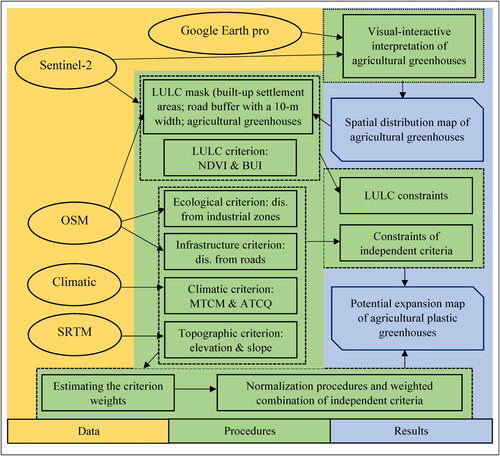
A flowchart of the proposed methodology for mapping the spatial distribution and potential expansion of agricultural plastic greenhouses using GIS and remote sensing techniques in Tartus is shown in .
Figure 4. Flowchart of the proposed methodology.
3.1. Visual-interactive interpretation of plastic-covered greenhouses
Sentinel-2 data (Level-2 product atmospherically corrected to surface reflectance values) from 7 October 2020 were obtained. The bands: B2—Blue (490 nm), B3—Green (560 nm), B4—Red (660 nm), B8—Near-infrared (842 nm) with a resolution of 10 m; B11—shortwave infrared-1 (1610 nm), B12—shortwave infrared-2 (2190 nm) with 20 m-resolution were used. The resolution of the bands B11 and B12 was resampled to 10 m.
Different band combinations were formed to get the best representation of the greenhouses. It was found that the use of natural colours (RGB = 432), where the plastic-covered greenhouses appear on the satellite images in light colours between pink and white, has a high representation (). We conducted a visual-interactive interpretation based on Sentinel-2 and high-resolution Google Earth Pro images (spatial resolution is about 1 m) to digitize plastic-covered greenhouses in ArcGIS (). In cases where we could not digitize the individual agricultural greenhouses, we merged several greenhouses into one polygon and determined the number of greenhouses in attributes to provide information about the number of greenhouses in the city.
Figure 5. Plastic-covered greenhouses: (a) on Sentinel-2 images, (b) on Google Earth pro images and (c) digitized greenhouses.
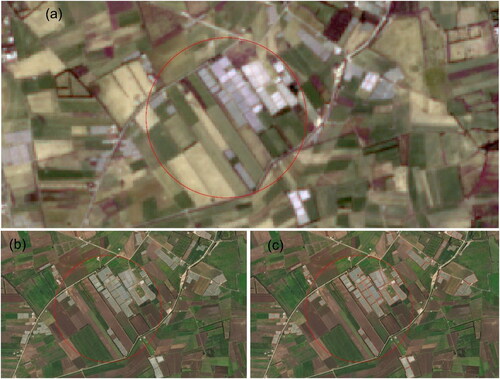
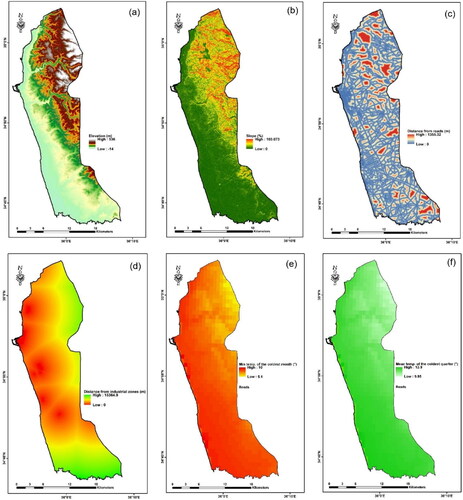
Figure 6. Criteria: (a) elevation, (b) slope, (c) distance from roads, (d) distance from industrial zones, (e) MTCM and (f) ATCQ.
3.2. Decision criteria
In this step, we analyzed the criteria used in the land suitability studies to select the ones affecting the potential expansion of agricultural plastic greenhouses. Varied criteria were divided into topographic, climatic, land use-land cover, socio-economic, infrastructure, soil, hydrological and ecological ().
Table 1. Criteria used in various researches..
The availability of digital elevation models with an accuracy of 30 m, such as SRTM, contributed to their widespread use to solve many practical-scientific tasks. Moreover, free access to climate data METAR contributed to their wide use, which may give more accurate information than ground stations when the number of stations is relatively few. The spread of free road layers, especially from Open Street Map (OSM) data, contributed to the widespread use of infrastructure criteria in studies of land suitability assessment. Soil criteria have been widely used, especially after guideline-recommended criteria on suitability were provided (FAO Citation1976; Sys et al. Citation1993). These guidelines did not provide information on different criteria for protected cultivation. Although soil characteristics play an important role in studies of land suitability assessment for agriculture, the intensive use of fertilizers in protected agriculture reduces the importance of soil characteristics for the potential expansion analysis of protected agriculture. The hydrological criteria have been widely used to analyze the suitability of irrigation-based crops, while protected agriculture, as a rule, depends on groundwater. In the study area, farmers rely on privately owned wells to irrigate crops inside greenhouses. There is still no spatial information about groundwater levels and the distribution of wells to be used as a criterion in this research.
Choosing criteria to achieve a specific task is related to their importance on the one hand and the possibility of obtaining spatial information about them on the other. In this article, based on the analysis of related scientific literature, expert’s opinion and available data, a combination of topographic, climatic, ecological, infrastructure and land use-land cover criteria was considered to analyze the potential expansion of agricultural plastic greenhouses. We will discuss these criteria in more detail.
In our analysis, the topographic criterion includes the elevation and slope. Elevation in the study area ranges between −14 and 536 m, while slope ranges between 0 and 103%. Agricultural plastic greenhouses are usually located on flat land patches or low slopes and placed at low elevations due to the fear of frost in winter. Thus, the potential expansion of agricultural plastic greenhouses will also be at low elevations and slopes.
The climatic criterion includes the minimum temperature of the coldest month (MTCM) and the average temperature of the coldest quarter (ATCQ). Farmers mainly grow vegetables in agricultural plastic greenhouses in winter. Greenhouses in the study area have a low level of technology, so it is necessary to place them in relatively warm regions. Thus, MTCM and ATCQ are crucial climatic criteria for the potential expansion analysis of agricultural plastic greenhouses.
The ecological criterion includes the distance from industrial zones. Air pollution factors should be taken when analyzing the potential expansion of agricultural plastic greenhouses in terms of the effects on the plants themselves and residues deposited in the greenhouse that can limit solar radiation (e.g. dust from factories) or damage the greenhouse material. Thus, the distance from industrial zones is crucial for the potential expansion analysis of agricultural plastic greenhouses.
The infrastructure criterion includes the distance from roads. The road network plays a pivotal role in agricultural greenhouses expansion. The closer the plastic greenhouses are to the road network, the lower the cost of transporting products to market centres. Thus, the distance from the road criterion is crucial for the potential expansion analysis of agricultural plastic greenhouses.
The land use-land cover (LULC) criterion includes the type of LULC. The potential expansion analysis of agricultural plastic greenhouses should consider the existing LULC types. Agricultural greenhouses are not found in built-up areas, water or forests. Thus, LULC constraints should be identified when analyzing the potential expansion of plastic greenhouses.
The correct multi-criteria analysis for the potential expansion of agricultural plastic greenhouses requires using independent criteria. Accordingly, we carried out the following sequential steps:
We created elevation and slope layers based on Shuttle Radar Topography Mission (SRTM) data with a spatial resolution of 30 m (,b).
Roads and industrial zones were derived from OSM data to great layers of distance (,d).
MTCM and ATCQ raster layers were created based on World Clim-2 data with a spatial resolution of 1 km (Fick and Hijmans Citation2017; ,f).
For subsequent spatial analyses, all layers were referenced to the world geodetic coordinate system WGS-84 and UTM projection (Zone-37N) with a resolution of 30 m (the coarsest resolution between the Google Earth Pro images, Sentinel-2 and SRTM data).
We conducted a correlation analysis between each pair of considered criteria to exclude dependent ones.
3.3. Boolean constraints
After defining the independent criteria and based on the distribution of the greenhouses and Sentinel-2 data, a set of Boolean constraints on the potential expansion of agricultural plastic greenhouses was determined and applied.
3.3.1. Constraints on independent criteria
From the GIS perspective, the constraints eliminate specific data values of the criteria from consideration (Malczewski and Rinner Citation2015). We assumed that the spatial distribution of existing agricultural plastic greenhouses contains information about their potential expansion. Therefore, the presence of 99% of the plastic-covered greenhouses at a specific threshold for criterion values allows us to determine a set of constraints.
In this step, we used ArcGIS spatial analyst tools to overlay the digitized plastic-covered greenhouses and criterion layers and analyzed the distribution of greenhouses by the data values of the independent criteria. As a result, a set of Boolean constraints on the potential expansion of agricultural greenhouses was identified and applied.
3.3.2. Constraints on land use-land cover criterion
Since land use-land cover detection is primarily aimed in this research to identify the potential expansion of agricultural plastic greenhouses, image indexes can be appropriate to apply. A comparison of classification and thresholding techniques using image indexes for land cover detection is not within the framework of our current research.
Image indexes, especially normalized difference vegetation index (NDVI), proposed by Tucker (Citation1979) and built-up index (BUI) (Zha et al. Citation2003), have been effectively used to detect vegetation and built-up areas. These indices based on Sentinel-2 are calculated as follows:
(1)
(1)
(2)
(2)
where
is the narrow infrared band values;
is the red band values; and
is the shortwave infrared-1 band values.
In this research, positive values of BUI and negative values of NDVI were fixed as thresholds to detect built-up areas and water. We also used high positive values of the NDVI to identify dense vegetation, which mainly includes forests. We also digitized built-up settlement area polygons using the visual-interactive interpretation of satellite images and created a road buffer with a 10-m width. Consequently, built-up areas, forests, water and land covered by plastic greenhouses, were considered constraints on the potential expansion of the agricultural greenhouses.
3.4. Estimating the criterion weights
Global multi-criteria assessment technics can be grouped into four methods: ranking, rating, pairwise comparison and entropy. The first three methods apply external assessment, meaning that the criterion weights are evaluated by the opinions of a group of experts without considering the variability and range of the criteria data values. The pairwise comparison method is based on measuring the relative importance of criteria (T. L. Saaty Citation2008). It has been the most often used global method for assessing the criterion weights and has been generally accepted as superior to any alternatives in practice (Malczewski and Jankowski Citation2020). The pairwise comparison method employs an underlying scale with values 1–9 () to rate the preferences concerning a pair of criteria i and j (R. W. Saaty Citation1987).
Table 2. The scale for pairwise comparison of criteria i and j.
The consistency ratio (CR), which is typically used to assess the consistency of pairwise comparisons, is calculated by the formula:
(3)
(3)
where n is the number of criteria; RI is the consistency index, which depends on the value of n. For example, for n = 4, 5, 6, 7, 8, 9 and 10, RI = 0.90, 1.12, 1.24, 1.32, 1.41, 1.45 and 1.49, respectively;
is the largest eigenvalue of the matrix.
The criterion weights w1, w2, …, wk vary in the range [0–1], where ∑wi = 1. A consistency ratio (CR) of 0.10 or less indicates a reasonable level of consistency (T. L. Saaty Citation1990).
Unlike the pairwise comparison, the entropy-based method applies internal assessment, meaning that the criterion weights are evaluated based on measuring the heterogeneity of the criterion values (Malczewski Citation2006). The more diverse information contained in the criterion values, the higher the value of its weight. The entropy-based criterion weights are defined as:
(4)
(4)
where
measured as follows:
(5)
(5)
is the entropy, defined as:
(6)
(6)
where
measured as follows:
(7)
(7)
where
is the value of the kth criterion for the ith alternatives.
In this research, we conducted a statistical questionnaire for a group of 16 specialists in the scope of protected agriculture to build the matrix of pairwise comparison matrix. Pairwise comparison and entropy-based methods were combined to assess the independent criterion weights. The combined criterion weight by entropy-based and the pairwise comparison methods is defined as follows:
(8)
(8)
where
is the kth criterion combined weight;
is the kth criterion weight using the entropy-based method;
is the kth criterion weight using the pairwise comparison method.
3.5. Weighted combination
Normalization procedures for converting criteria data values to a comparable scale are a fundamental issue in multi-criteria analysis tasks (Malczewski Citation2004). In this research, we applied an MSLarge function, which makes high values in the input raster get high on a given scale to the criterion, and An MSSmall, which makes smaller values in the input raster get a high value on a given scale, to normalize independent criteria data values. The implementation of the MSSmall and MSLarge functions is specified by the values of mean and standard deviation multipliers. In this work, the multipliers were defined as follows: Mean multiplier = 1 and Standard deviation multiplier = 1 on a scale of 1–100.
We applied a weighted linear combination method to map the potential expansion of agricultural plastic greenhouses. The potential expansion index by using this method is defined as:
(9)
(9)
where
is the kth criterion combined weight;
is the normalized value of the kth criterion for the ith alternatives.
We converted the continuous potential expansion map of agricultural plastic greenhouses to a thematic map in which potential expansion areas were divided into four classes using natural division. We also replaced the values of small clusters, in which the number of connected pixels did not exceed 4, with neighbouring values to smooth the obtained map.
3.6. Accuracy assessment
Accuracy assessment is essential when using remote sensing and GIS techniques for mapping purposes (Congalton Citation1991). To assess the accuracy of the proposed methodology when applying Boolean constraints, we created a potential expansion map of greenhouses in 2016, and we formed a random training sample containing about 350 polygons to represent the expansion of greenhouses in the period from 2016 to 2020 and calculated overall accuracy. To assess the consistency of potential expansion areas, we analyzed the correlation of the potential expansion relative areas with the training polygons in each category and evaluated the coefficient of determination R2.
4. Results and discussion
4.1. The spatial distribution of agricultural plastic greenhouses
shows the spatial distribution map of agricultural greenhouses in Tartus. The number of polygons digitized is 15,419, and the number of plastic-covered greenhouses is 83,034. According to government statistics, the number of plastic-covered greenhouses in the city is 83,821. This insignificant difference in their number (less than 1%) may be due to removing some greenhouses between the acquisition of government statistics and space survey periods. According to digitized greenhouses in this research, the area covered by protected agriculture in Tartus was 2651 ha (4.8% of the total study area).
Figure 7. Spatial distribution of agricultural greenhouses in Tartus (Syria).
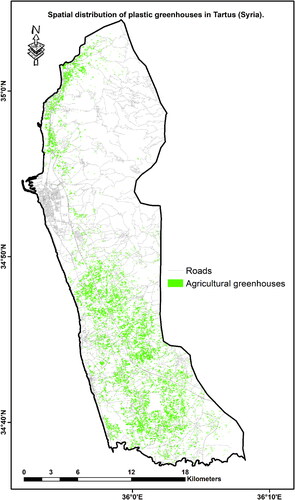
As in our research, the visual-interactive interpretation was conducted to digitize agricultural greenhouse polygons using satellite images in southern Italy (Cillis et al. Citation2022). The methodology proposed in our work allows not only to digitize the greenhouse polygons but also to provide information about the number of greenhouses in each polygon.
4.2. Correlation analysis
The obtained correlation matrix is shown in . The conducted correlation analysis shows a strong positive correlation (correlation coefficient of 0.97) between the minimum temperatures of the coldest month (MTCM) and the average temperatures of the coldest quarter (ATCQ). It also shows a strong negative correlation between climatic criteria (MTCM and ATCQ) and the elevation (correlation coefficient of −0.9 and −0.94, respectively). This strong correlation can be explained by the fact that the variation of the Earth’s surface elevations is the primary determinant of temperature in the study area. Based on conducted correlation analysis, we excluded the climatic criteria (MTCM and ATCQ) from the subsequent analyses.
Table 3. Correlation matrix.
4.3. Boolean constraints on the potential expansion of agricultural plastic greenhouses
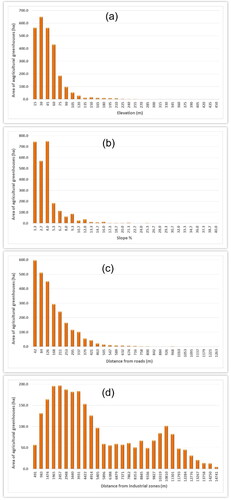
shows the distribution of agricultural plastic greenhouses by elevation and slope. Results show that more than 99% of the area covered by plastic greenhouses in Tartus is located at elevations less than 200 m and slopes of less than 18%. shows the distribution of agricultural plastic greenhouses by distance from roads and industrial zones. The results show that more than 99% of the area covered by plastic greenhouses is at distances from roads less than 600 m and greater than 100 m from industrial zones.
Figure 8. The distribution of agricultural plastic greenhouses by criteria: (a) elevation, (b) slope, (c) distance from roads and (d) distance from industrial zones.
Therefore, we applied the following Boolean constraints on the potential expansion of agricultural plastic greenhouses:
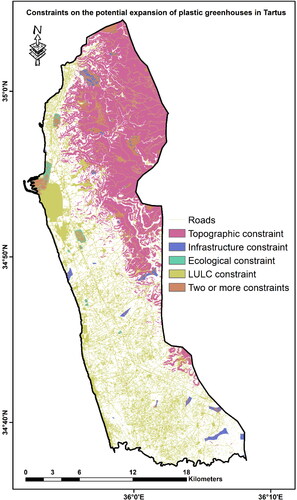
Topographic constraint, where elevation >200 m or slope >18%;
Infrastructure constraint, where the distance from roads >600 m;
Ecological constraint, where the distance from industrial zones <100 m;
LULC constraint, where located plastic-covered greenhouses or Sentinel-2 data values of BUI > 0, NDVI < 0 or NDVI > 0.6. LULC constraint also includes a 10-meter wide road buffer and built-up settlement areas.
The constraints applied to the potential expansion of agricultural plastic greenhouses are shown in . The topographical constraint area was the largest, which reached up to 32% of the study area. LULC constraint came second with about 21% of the study area, while the remained constraints were less than 5% (3% for the infrastructure and 1% for the ecological). However, due to the spatial overlap on the map, the total area of constraints on the potential expansion of agricultural plastic greenhouses constituted about 53% of the study area.
Figure 9. Constraints on the potential expansion of agricultural greenhouses in Tartus (Syria).
4.5. The potential expansion of agricultural plastic greenhouses
The pairwise comparison matrix of the considered criteria is given in . The consistency ratio CR was 0.05, indicating the consistency of the pairwise comparison matrix. The calculated pairwise comparison-based criterion weights, entropy-based criterion weights and combined weights of the considered criteria are given in .
Table 4. Pairwise comparison matrix.
Table 5. Criterion weights.
Results show that the distance from roads is the most significant criterion for protected agriculture in Tartus, followed by elevation, slope and distance from industrial zones. Agricultural plastic greenhouse placement at a great distance from the roads leads to great difficulties and a significant increase in the cost of transporting products to the market. Our results are consistent with findings (Al-maimani et al. Citation2019; Gao et al. Citation2022) that distance from roads is one of the primary driving forces in the distribution of greenhouses. The ecological criterion (distance from the industrial zones) did not have a high weight, perhaps, due to the small number of industrial zones in Tartous.
The elevation criterion also plays a key role. The higher the elevation, the greater the risk of exposure to strong winds and the greater the risk of building plastic-covered greenhouses. The slope is the third most important criterion that can be explained by the dangers of soil erosion in high slope areas. Lower temperatures during the cooler months lead to higher heating costs, and lower heating technologies in plastic-covered greenhouses may not allow protected plantings to withstand frost. Temperatures have a strong correlation with the high elevations in the study area. Therefore, our results agree with the study (Saltuk and Artun Citation2019), which concluded that the minimum temperature of the coldest month and elevation criteria have greater importance than the slope criterion in the distribution of agricultural greenhouses.
We applied an MSLarge function to normalize criterion data values of distance from industrial zones and an MSSmall function for criteria: elevation, slope and distance from roads. A weighted linear combination of criteria data values was applied. A potential expansion map of agricultural plastic greenhouses in Tartus was converted to a thematic map using natural division (). Values of small clusters were replaced with neighbouring values to smooth the obtained map.
Figure 10. Potential expansion map of agricultural greenhouses in Tartus (Syria).
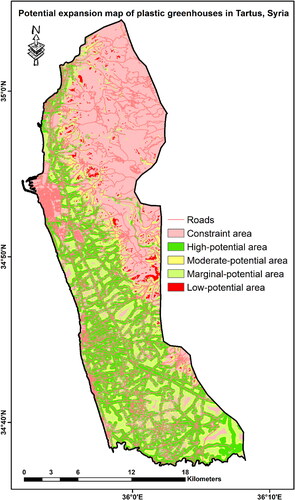
shows the proportions of each class on the potential expansion map of agricultural plastic greenhouses in Tartus.
Table 6. Area of thematic classes.
The results show that 52.5% of the study area is a constraint on the potential expansion area of agricultural plastic greenhouses. The results also show that about 64% of potential expansion lands have high potential while 36% is distributed among moderate, marginal and low potential areas. The high-potential expansion area is located mainly in the coastal strip and the southern part of the city, where the land is relatively flat in nonresidential areas. Our findings indicate a potential expansion of agricultural plastic greenhouses from 4.8% up to 34% in the city of Tartous.
Assessment of the methodology used in this research indicates high reliability in mapping the potential expansion of agricultural plastic greenhouses with an overall accuracy of 96.6%. Assessment of the correlation of the potential expansion relative areas with the training polygons in each category indicates the consistency of potential expansion areas with a coefficient of determination R2 of 99.5%.
Future environmental and economic studies, such as managing plastic waste, aesthetic issues, building greenhouse parks, constructing seawater desalination plants to reduce water demand and others could be performed using obtained maps. The constraints determined in this research on the potential expansion of agricultural plastic greenhouses could be used in studies of automated classification to increase the accuracy of mapping agricultural greenhouses using satellite imagery data. The methodology used in this research could also be used to study the potential expansion of different cultivations.
5. Conclusions
This article presents the methodology and results of conducting a multi-criteria analysis for assessing and mapping the potential expansion of agricultural plastic greenhouses using GIS and remote sensing techniques. In this research, first, we digitized agricultural plastic greenhouses in Tartus from Sentinel-2 and high-resolution Google Earth Pro images in 2020 using a visual-interactive interpretation method. We identified a set of topographic, climatic, ecological, infrastructure and land use-land cover criteria and performed correlation analysis to determine independent ones. After that, we excluded climatic criteria from subsequent analyses due to the strong correlation with topographic ones. Second, we assessed the spatial distribution of plastic-covered plastic greenhouses for independent criteria to determine and apply Boolean constraints on the potential expansion area. The combined criterion weights were calculated using a pairwise comparison and entropy-based methods. Third, criterion data values were normalized, and then a weighted linear combination was applied to the considered criteria to obtain a potential expansion map of agricultural plastic greenhouses. Finally, we assessed the obtained results and the accuracy of the methodology used in this research.
Our results show that the distance from roads was the most significant criterion for assessing the potential expansion area of agricultural plastic greenhouses in Tartus, followed by elevation, slope and distance from industrial zones. The resulting map shows that slightly more than half of the study area has constraints on the potential expansion of greenhouses and two-third of the remaining area has high potential.
Our findings demonstrate high effectiveness in using GIS and remote sensing techniques for assessing the potential expansion of agricultural plastic greenhouses with an accuracy of 96.6%. The maps obtained in this research can provide vital spatial and statistical information for land-use planning and management in Syria. The methodology proposed in this research could be used to map and assess the potential expansion of different cultivations.
Acknowledgement
The authors would like to thank farmers of greenhouse cultivation in Tartous, and experts who contributed to the study.
Data availability statement
The data used in this research were derived from the following public resources: Shuttle Radar Topography Mission (SRTM) data from (https://earthexplorer.usgs.gov/); Sentinel-2 data from the Copernicus open access hub (https://scihub.copernicus.eu/dhus/#/home); World Clim-2 data from (http://www.worldclim.com/version2); OSM data in Syria from (http://www.openstreetmap.org); Official statistics from (http://moaar.gov.sy/main/archives/24005).
Disclosure statement
No potential conflict of interest was reported by the authors.
References
- Abdel-Ghany AM, Al-Helal IM, Picuno P, Shady MR. 2016. Modified plastic net-houses as alternative agricultural structures for saving energy and water in hot and sunny regions. Renew Energy. 93:332–339. https://doi.org/10.1016/j.renene.2016.02.084.
- Agüera F, Aguilar F, Aguilar M. 2008. Using texture analysis to improve per-pixel classification of very high resolution images for mapping plastic greenhouses. ISPRS J Photogramm Remote Sens. 63(6):635–646. https://doi.org/10.1016/j.isprsjprs.2008.03.003.
- Agüera F, Aguilar MA, Aguilar FJ. 2006. Detecting greenhouse changes from QuickBird imagery on the Mediterranean coast. Int J Remote Sens. 27(21):4751–4767. https://doi.org/10.1080/01431160600702681.
- Agüera F, Liu JG. 2009. Automatic greenhouse delineation from QuickBird and Ikonos satellite images. Comput Electron Agric. 66(2):191–200. https://doi.org/10.1016/j.compag.2009.02.001.
- Aguilar M, Bianconi F, Aguilar F, Fernández I. 2014. Object-based greenhouse classification from GeoEye-1 and WorldView-2 stereo imagery. Remote Sens. 6(5):3554–3582. https://doi.org/10.3390/rs6053554.
- Aguilar MA, Nemmaoui A, Novelli A, Aguilar FJ, Lorca AG. 2016. Object-based greenhouse mapping using very high resolution satellite data and Landsat 8 time series. Remote Sens. 8(6):513. https://doi.org/10.3390/rs8060513.
- Aguilera FB, Matarán AR, Pérez RC, Valenzuela LM. 2008. Simulating greenhouse growth in urban zoning on the coast of Granada (Spain). In Modelling environmental dynamics. Environmental science and engineering. Berlin, Heidelberg: Springer; p. 269–295. https://doi.org/10.1007/978-3-540-68498-5_10.
- Akıncı H, Özalp Y, Turgut B. 2013. Agricultural land use suitability analysis using GIS and AHP technique. Comput Electron Agric. 97:71–82. https://doi.org/10.1016/j.compag.2013.07.006.
- Al-maimani AM, Al-ismaili AM, Al-maktoumi AK, Charabi Y. 2019. Spatio-temporal distribution of greenhouses and affecting driving factors in Al-Batinah South, Oman, using GIS mapping. Am-Eursion J Sustain Agric. 13(2):13–33. https://doi.org/10.22587/aejsa.2019.13.2.2.
- Al-taani A, Al-husban Y, Farhan I. 2021. Land suitability evaluation for agricultural use using GIS and remote sensing techniques: the case study of Ma’an Governorate, Jordan. Egypt J Remote Sensing Space Sci. 24(1):109–117. https://doi.org/10.1016/j.ejrs.2020.01.001.
- Aldababseh A, Temimi M, Maghelal P, Branch O, Wulfmeyer V. 2018. Multi-criteria evaluation of irrigated agriculture suitability to achieve food security in an arid environment. Sustainability. 10(3):803–833. https://doi.org/10.3390/su10030803.
- Alganci U, Kuru GN, Algan IY, Sertel E. 2019. Vineyard site suitability analysis by use of multicriteria approach applied on geo-spatial data. Geocarto Int. 34(12):1286–1299. https://doi.org/10.1080/10106049.2018.1493156.
- Alsafadi K, Mohammed S, Habib H, Kiwan S, Hennawi S, Sharaf M. 2020. An integration of bioclimatic, soil, and topographic indicators for viticulture suitability using multi-criteria evaluation: a case study in the Western slopes of Jabal Al Arab—Syria. Geocarto Int. 35(13):1466–1488. https://doi.org/10.1080/10106049.2019.1583291.
- Bandyopadhyay S, Jaiswal RK, Hegde VS, Jayaraman V. 2009. Assessment of land suitability potentials for agriculture using a remote sensing and GIS based approach. Int J Remote Sens. 30(4):879–895. https://doi.org/10.1080/01431160802395235.
- Cengiz T, Akbulak C. 2009. Application of analytical hierarchy process and geographic information systems in land-use suitability evaluation: a case study of Dumrek village (Canakkale, Turkey). Int J Sustain Dev World Ecol. 16(4):286–294. https://doi.org/10.1080/13504500903106634.
- Chaofan W, Jinsong D, Ke W, Ligang M, Tahmassebi A. 2017. Object-based classification approach for greenhouse mapping using Landsat-8 imagery. Int J Agric Biol Eng. 9(1). https://doi.org/10.3965/j.ijabe.20160901.1414.
- Cillis G, Statuto D, Schettini E, Vox G, Picuno P. 2022. Implementing a GIS‐based digital atlas of agricultural plastics to reduce their environmental footprint. Part I: a deductive approach. Appl Sci. 12(3):1330. https://doi.org/10.3390/app12031330.
- Congalton RG. 1991. A review of assessing the accuracy of classifications of remotely sensed data. Remote Sens Environ. 37(1):35–46. https://doi.org/10.1016/0034-4257(91)90048-B.
- Dehbi A, Youssef B, Chappey C, Mourad AHI, Picuno P, Statuto D. 2017. Multilayers polyethylene film for crop protection in harsh climatic conditions. Adv Mater Sci Eng. 2017:1–7. https://doi.org/10.1155/2017/4205862.
- Elaalem M. 2013. A comparison of parametric and fuzzy multi-criteria methods for evaluating a comparison of parametric and fuzzy multi-criteria methods for evaluating land suitability for olive in Jeffara Plain of Libya. APCBEE Procedia. 5:405–409. https://doi.org/10.1016/j.apcbee.2013.05.070.
- Elsheikh R, Rashid A, Shariff M, Amiri F, Ahmad NB, Balasundram SK, Soom MAM. 2013. Agriculture Land Suitability Evaluator (ALSE): a decision and planning support tool for tropical and subtropical crops. Comput Electron Agric. 93:98–110. https://doi.org/10.1016/j.compag.2013.02.003.
- FAO. 1976. A framework for land evaluation. https://www.fao.org/3/x5310e/x5310e00.htm.
- Feizizadeh B, Blaschke T. 2013. Land suitability analysis for Tabriz County, Iran: a multi-criteria evaluation approach using GIS. J Environ Plan Manage. 56(1):1–23. https://doi.org/10.1080/09640568.2011.646964.
- Fick SE, Hijmans RJ. 2017. WorldClim 2: new 1-km spatial resolution climate surfaces for global land areas. Int J Climatol. 37(12):4302–4315. https://doi.org/10.1002/joc.5086.
- Gao C, Wu Q, Dyck M, Lv J, He H. 2022. Greenhouse area detection in Guanzhong Plain, Shaanxi, China: spatio-temporal change and suitability classification. Int J Digit Earth. 15(1):226–248. https://doi.org/10.1080/17538947.2021.2023667.
- García JL, Alvarado A, Blanco J, Jiménez E, Maldonado AA, Cortés G. 2014. Multi-attribute evaluation and selection of sites for agricultural product warehouses based on an Analytic Hierarchy Process. Comput Electron Agric. 100:60–69. https://doi.org/10.1016/j.compag.2013.10.009.
- Herzberg R, Pham TG, Kappas M, Wyss D, Tran CTM. 2019. Multi-criteria decision analysis for the land evaluation of potential agricultural land use types in a hilly area of central Vietnam. Land. 8(6):90–25. https://doi.org/10.3390/land8060090.
- Ibrahim WY, Batzli S, Menzel WP. 2014. Agricultural policy effects on land cover and land use over 30 years in Tartous, Syria, as seen in Landsat imagery. J Appl Remote Sens. 8(1):083506. https://doi.org/10.1117/1.jrs.8.083506.
- Jafari S, Zaredar N. 2010. Land suitability analysis using multi attribute decision making approach. IJESD. 1(5):441–445. https://doi.org/10.7763/IJESD.2010.V1.85.
- Jiménez-Lao R, Aguilar FJ, Nemmaoui A, Aguilar MA. 2020. Remote sensing of agricultural greenhouses and plastic-mulched farmland: an analysis of worldwide research. Remote Sens. 12(16):2649–2620. https://doi.org/10.3390/RS12162649.
- Justus F, Yu D. 2014. Spatial distribution of greenhouse commercial horticulture in Kenya and the role of demographic, infrastructure and topo-edaphic factors. IJGI. 3(1):274–296. https://doi.org/10.3390/ijgi3010274.
- Karimi F, Sultana S, Babakan AS, Royall D. 2018. Land suitability evaluation for organic agriculture of wheat using GIS and multicriteria analysis. Pap Appl Geogr. 4(3):326–342. https://doi.org/10.1080/23754931.2018.1448715.
- Khatib A, Malinnikov VA. 2021a. Automated classification of the vegetation cover of Mediterranean landscape using spectral-textural and topographic features of high spatial resolution satellite imagery. Sovr Probl DZZ Kosm. 18(2):51–63. https://doi.org/10.21046/2070-7401-2021-18-2-51-63.
- Khatib A, Malinnikov VA. 2021b. Method for estimating vegetation cover transformations in the Syrian Mediterranean region based on remotely sensed satellite data using heuristic rules. Sovr Probl DZZ Kosm. 18(4):115–127. https://doi.org/10.21046/2070-7401-2021-18-4-115-127.
- Koc-san D. 2013. Evaluation of different classification techniques for the detection of glass and plastic greenhouses from WorldView-2 satellite imagery. J Appl Remote Sens. 7(1):073553–073520. https://doi.org/10.1117/1.JRS.7.073553.
- Malczewski J. 2004. GIS-based land-use suitability analysis: a critical overview. Prog Plan. 62(1):3–65. https://doi.org/10.1016/j.progress.2003.09.002.
- Malczewski J. 2006. GIS‐based multicriteria decision analysis: a survey of the literature. Int J Geogr Inf Sci. 20(7):703–726. https://doi.org/10.1080/13658810600661508.
- Malczewski J, Jankowski P. 2020. Emerging trends and research frontiers in spatial multicriteria analysis. Int J Geogr Inf Sci. 34(7):1257–1282. https://doi.org/10.1080/13658816.2020.1712403.
- Malczewski J, Rinner C. 2015. Multicriteria decision analysis in geographic information science. 1st ed. Springer.
- Mohammed S, Alsafadi K, Ali H, Nasir SM, Kiwan S, Hennawi S, Harsanyie E, Pham QB, Thi N, Linh T, et al. 2022. Assessment of land suitability potentials for winter wheat cultivation by using a multi criteria decision support-geographic information system (MCDS-GIS) approach in Al-Yarmouk Basin (S Syria). Geocarto Int. 37(6):1645–1663. https://doi.org/10.1080/10106049.2020.1790674.
- Mokarram M, Mirsoleimani A. 2018. Using fuzzy-AHP and order weight average (OWA) methods for land suitability determination for citrus cultivation in ArcGIS (Case study: Fars province Iran). Physica A. 508:506–518. https://doi.org/10.1016/j.physa.2018.05.062.
- Mustafa AA, Singh M, Sahoo RN, Ahmed N, Khanna M, Sarangi A, Mishra AK. 2011. Land suitability analysis for different crops: a multi criteria decision making approach using remote sensing and GIS. Researcher. 3(12):61–84.
- Novelli A, Aguilar MA, Nemmaoui A, Aguilar FJ, Tarantino E. 2016. Performance evaluation of object based greenhouse detection from Sentinel-2 MSI and Landsat 8 OLI data: A case study from Almería (Spain). Int J Appl Earth Observ Geoinf. 52:403–411. https://doi.org/10.1016/j.jag.2016.07.011.
- Novelli A, Tarantino E. 2015. Combining ad hoc spectral indices based on LANDSAT-8 OLI/TIRS sensor data for the detection of plastic cover vineyard. Remote Sens Lett. 6(12):933–941. https://doi.org/10.1080/2150704X.2015.1093186.
- Orhan O. 2021. Land suitability determination for citrus cultivation using a GIS-based multi-criteria analysis in Mersin, Turkey. Comput Electron Agric. 190:106433–106414. https://doi.org/10.1016/j.compag.2021.106433.
- Ou C, Yang J, Du Z, Liu Y, Feng Q, Zhu D. 2019. Long-term mapping of a greenhouse in a typical protected agricultural region using Landsat imagery and the Google Earth Engine. Remote Sens. 12(1):55–23. https://doi.org/10.3390/rs12010055.
- Pardossi A, Tognoni F, Incrocci L. 2004. Mediterranean greenhouse technology. Chronica Horticult. 44(2):28–34.
- Perilla GA, Mas J. 2019. High-resolution mapping of protected agriculture in Mexico, through remote sensing data cloud geoprocessing sensing data cloud geoprocessing. Eur J Remote Sens. 52(1):532–541. https://doi.org/10.1080/22797254.2019.1686430.
- Picuno P, Tortora A, Capobianco RL. 2011. Analysis of plasticulture landscapes in Southern Italy through remote sensing and solid modelling techniques. Landscape Urban Plan. 100(1–2):45–56. https://doi.org/10.1016/j.landurbplan.2010.11.008.
- Rogge E, Nevens F, Gulinck H. 2008. Reducing the visual impact of ‘greenhouse parks’ in rural landscapes. Landscape Urban Plan J. 87(1):76–83. https://doi.org/10.1016/j.landurbplan.2008.04.008.
- Saaty RW. 1987. The analytic hierarchy process—what it is and how it is used. Math Model. 9(3–5):161–176. https://doi.org/10.1016/0270-0255(87)90473-8.
- Saaty TL. 1990. How to make a decision: the analytic hierarchy process. Eur J Oper Res. 48(1):9–26. https://doi.org/10.1016/0377-2217(90)90057-I.
- Saaty TL. 2008. Decision making with the analytic hierarchy process. IJSSCI. 1(1):83–98. https://doi.org/10.1504/IJSSCI.2008.017590.
- Saltuk B, Artun O. 2019. Multi-criteria decision system for greenhouse site selection in Gediz basin, Turkey using geographic information systems (GIS). Fresenius Environ Bull. 28(8):6358–6365.
- Scarascia-Mugnozza G, Sica C, Picuno P. 2008. The optimisation of the management of agricultural plastic waste in Italy using a geographical information system. Acta Hortic. 801:219–226. https://doi.org/10.17660/ActaHortic.2008.801.20.
- Shalaby A, Ouma Y, Tateishi R. 2006. Land suitability assessment for perennial crops using remote sensing and geographic information systems: a case study in northwestern Egypt. Arch Agron Soil Sci. 52(3):243–261. https://doi.org/10.1080/03650340600627167.
- Shi L, Huang X, Zhong T, Taubenböck H. 2020. Mapping plastic greenhouses using spectral metrics derived from GaoFen-2 satellite data. IEEE J Sel Top Appl Earth Observ Remote Sens. 13:49–59. https://doi.org/10.1109/JSTARS.2019.2950466.
- Sönmez K, Sari M. 2006. Use of remote sensing and geographic information system technologies for developing greenhouse databases. Turk J Agric For. 30:413–420.
- Sun H, Wang L, Lin R, Zhang Z, Zhang B. 2021. Mapping plastic greenhouses with two-temporal Sentinel-2 images and 1D-CNN deep learning. Remote Sens. 13(14):2820–2822. https://doi.org/10.3390/rs13142820.
- Sys C, Ranst E, Van, Debaveye J, Beernaert F. 1993. Land evaluation, Part III: Crop requirements. International Training Centre for Post-Graduate Soil Scientists. https://biblio.ugent.be/publication/233235.
- Tercan E, Ali M. 2020. Development of a land suitability model for citrus cultivation using GIS and multi-criteria assessment techniques in Antalya province of Turkey. Ecol Indic. 117:106549–106511. https://doi.org/10.1016/j.ecolind.2020.106549.
- Tognoni F, Pardossi A, Serra G. 1999. Strategies to match greenhouses to crop production. Acta Hortic. 481:451–462. https://doi.org/10.17660/ActaHortic.1999.481.52.
- Tucker CJ. 1979. Red and photographic infrared linear combinations for monitoring vegetation. Remote Sens Environ. 8(2):127–150. https://doi.org/10.1016/0034-4257(79)90013-0.
- Yohannes H, Soromessa T. 2018. Land suitability assessment for major crops by using GIS-based multi-criteria approach in Andit Tid watershed, Ethiopia. Cogent Food Agric. 4(1):1470481. https://doi.org/10.1080/23311932.2018.1470481.
- Yu B, Song W, Lang Y. 2017. Spatial patterns and driving forces of greenhouse land change in Shouguang City, China. Sustainability. 9(3):359–315. https://doi.org/10.3390/su9030359.
- Zabihi H, Ahmad A, Vogeler I, Nor M, Golmohammadi M, Golein B, Nilashi M. 2015. Land suitability procedure for sustainable citrus planning using the application of the analytical network process approach and GIS. Comput Electron Agric. 117:114–126. https://doi.org/10.1016/j.compag.2015.07.014.
- Zabihi H, Alizadeh M, Langat PK, Karami M, Shahabi H, Ahmad A, Said MN, Lee S. 2019. GIS multi-criteria analysis by ordered weighted averaging (OWA): toward an integrated citrus management strategy. Sustainability. 11(4):1009–1017. https://doi.org/10.3390/su11041009.
- Zha Y, Gao J, Ni S. 2003. Use of normalized difference built-up index in automatically mapping urban areas from TM imagery. Int J Remote Sens. 24(3):583–594. https://doi.org/10.1080/01431160304987.
- Zhang X, Cheng B, Chen J, Liang C. 2021. High-resolution boundary refined convolutional neural network for automatic agricultural greenhouses extraction from GaoFen-2 satellite imageries. Remote Sens. 13(21):4237. https://doi.org/10.3390/rs13214237.
- Zolekar RB, Bhagat VS. 2015. Multi-criteria land suitability analysis for agriculture in hilly zone: remote sensing and GIS approach. Comput Electron Agric. 118:300–321. https://doi.org/10.1016/j.compag.2015.09.016.