
 ?Mathematical formulae have been encoded as MathML and are displayed in this HTML version using MathJax in order to improve their display. Uncheck the box to turn MathJax off. This feature requires Javascript. Click on a formula to zoom.
Abstract
A new multi-channel expanded convolutional neural network (MCE-CNN) model was proposed for landslide hazard analysis based on ‘dynamic and static’ + ‘internal and external’ factors. Firstly, 102 landslide samples were collected in Kongtong area, of the total samples, 75% were utilized for training, and the remaining 25% were applied for validation. At the same time, 14 landslide evaluation indicators including dynamic surface deformation rate were collected. Then, the result was validated using overall accuracy (OA) and area under curve (AUC) measurements. In order to further prove the effectiveness of the proposed method, comparative experiments were designed from two aspects, different models (MCE-CNN, SVM, RF) and different factors (‘dynamic and static’ + ‘internal and external’ and only on the static ‘internal and external’). The results show that the AUC results of three models (MCE-CNN, SVM, RF) based on ‘dynamic and static’ + ‘internal and external’ factors were 95.4%, 83.7%, 84.1% respectively. The AUC results of three models (MCE-CNN, RF, SVM) based only on the static ‘internal and external’ factors were 92.3%, 82.9% and 81.8% respectively. Therefore, the results of hazard analysis by the method proposed in this paper are more reasonable and reliable, and the proposed method has great potential in practical landslide hazard analysis.
1. Introduction
China has been suffering long from frequently occurring geological hazards, especially landslides, which is the most common and widely distributed type of geo-hazard landslide represents the movement of soil sliding down the slope due to gravity (Pirasteh et al. Citation2020). Since the reform and opening up, large-scale engineering constructions have led to the growth of landslides, both size, and frequency (Wang Citation2007). According to the record of the National Bureau of Statistics in 2017, 74.5% of the total 10,997 geological hazards are landslide hazards. Landslides are responsible for at least 17% of all natural hazard fatalities (Bui et al. Citation2018).
Loess Plateau soil loose, porous, vertical joint development, more calcium carbonate in loess, rainfall easily lead to clay and fine particle material loss, so prone to landslides and other disasters (Xu et al. Citation2014). Pingliang is an important town on the Loess Plateau. With the deepening of urban construction, the fragile geography, geological environment and precipitation concentration have caused frequent landslide disasters, posing a major threat to the safety of people’s lives and property. Therefore, scientific and effective preventive research is necessary to ensure the stable development of landslide-prone areas in the loess region.
Landslide hazard analysis refers to the temporal and spatial probability of landslide occurrence given a temporal and spatial extent, i.e. the probability, extent and strength of landslide occurrence is obtained by analysing various environmental factors that predispose to landslides, which is of great value to regional disaster prevention and mitigation (Pradhan Citation2010). In hazard evaluation, the evaluation system and model determine the accuracy of the evaluation results. Most conventional landslide hazard analysis systems only take into account topography, geomorphology, stratigraphy, rainfall and seismic factors, which has achieved good results (Hong et al. Citation2017), but in this case it is default that all slopes are in the same state of evolution, but the actual situation is that different slopes are in different states, and landslides are mostly caused by slope instability, so this method is incapable of long-term sustainable evaluation and prediction, and it is difficult to express the changes in landslide hazard during the evolution of slopes, so that accurate and effective prevention and control measures can not be made. Therefore, how to analyze and obtain indicators of the slope’s own activity and to construct an evaluation system is still a major challenge in today’s hazard analysis.
The Interferometry Synthetic Aperture Radar (InSAR) data has the advantages of data accuracy, not affected by the cloud or irradiation conditions, as well as high resolution and repetition rate at a large observation scale (Zhang et al. Citation2018b), InSAR technology provides great convenience to obtain the slope’s own activity, i.e. slope deformation. In recent years, scholars at home and abroad have achieved fruitful results in the exploration and research of InSAR technology, and developed many techniques such as D-InSAR, PS-InSAR and SBAS-InSAR, which have been widely used (Calvello et al. Citation2017). However, these techniques have not been extended in the field of landslide hazard analysis, and more studies have only used empirical values based on deformation cumulative displacement-time curves to predict or evaluate landslide hazards, as well as constructing look-up tables for landslide hazard analysis using the results derived from landslide hazard evaluation and InSAR subsidence rates (Ciampalini et al. Citation2016; Hussain et al. Citation2021, Citation2022), which have improved the evaluation accuracy, but neglected the coupling between surface deformation rate and other factors. As the process of landslide incubation and occurrence is a dynamic change with time, surface deformation is the most direct manifestation, and the information extracted by SBAS-InSAR is also based on multi-temporal phase to express the surface deformation information, therefore, the surface deformation and other information extracted by SBAS-InSAR technology can be used as an intrinsic indicator of landslide hazard analysis, and explore the coupling effect between it and other incubation factors.
Researchers have applied mass of statistical models to landslide hazard analysis, such as the frequency ratio (FR) model (Hong et al. Citation2018), the logistic regression (LR) model (Wang et al. Citation2017), the random forest (RF) model (Pourghasemi and Kerle Citation2016, Nhu et al. Citation2020), and the support vector machine (SVM) model (Wang et al. Citation2019a, Zhang et al. Citation2018b). However, these models extract shallow learning features with at most one hidden layer, are not able to make full use of the input features as they lack complex nonlinear characteristics extractability. Meanwhile, the shortcomings such as long training time, unstable convergence, local optimization (Huang et al. Citation2018), and unideal model accuracy, widely exist. What’s more, the landslide formation is complex, the types of predisposing factors are often non-linear-correlated and the coupling rules vary from different regions, analyzing only shallow numerical features would not be enough convincing. In recent years, deep learning (DL) models, also known as multilayer deep neural simulation networks, have been developing rapidly, and the convolutional neural network (CNN) model is a typical DL model (Ghorbanzadeh et al. Citation2019). It was equipped with advanced structures like convolution kernel weight sharing and hidden layer local connection, which greatly helped to reduce the number of weight parameters and the complexity of the model, prevent over-fitting (Ghorbanzadeh et al. Citation2021), and improve the calculating speed. Currently, CNN has become the most popular method for image processing in the field of DL and has made great progress, such as target detection (Seeliger et al. Citation2018), image classification (Wang et al. Citation2016), object recognition (Huang et al. Citation2016), etc. Despite extracting the shallow features, CNN can extract deeper features and explore the complex nonlinear relationships between objects (Ghorbanzadeh et al. Citation2022). At present, studies have proved that CNN can achieve better results and have considerable application prospects in landslide hazard analysis (Wang et al. Citation2019b).
In general, in terms of landslide hazard analysis systems, most of the evaluation systems used in previous studies only incorporate triggering factors such as rainfall and earthquakes. However, landslides are often caused by slope instability, and the development and evolution of slopes have cyclical and phased characteristics, and their own evolution and deformation processes reflect changes in hazard, thus the previous evaluation systems are unable to indicate such changes, so that accurate and effective prevention and control measures cannot be made. Therefore, this paper uses SBAS-InSAR to monitor surface deformation, obtain slope deformation results, and combines deformation with traditional trigger factors as the landslide hazard analysis system. In terms of evaluation models, although landslide hazard analysis can be achieved by a variety of models, previous evaluation models have problems such as poor timeliness and excessive weight calculation. The rapid development of CNN and its powerful advantages in solving complex non-linear problems in recent years have brought new opportunities to solve the above problems, so it is of great research significance and application value to build CNN models suitable for hazard analysis. Therefore, this paper constructed the MCE-CNN model, and taking Kongtong District of Pingliang City as an example to carry out landslide hazard anslysis experiment. The experimental results can provide important reference for policy makers in Kongtong, and even the proposed method are of great significance for disaster prevention and mitigation in Loess regions
2. Materials and methods
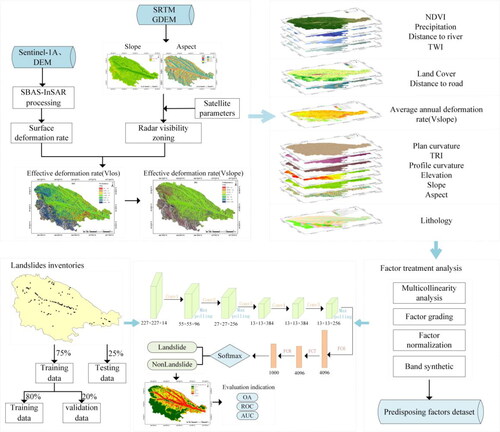
The methodology of this study consisted of four parts (see ). Firstly, data on topography and geology, meteorology and hydrology, human activities, historical landslides and radar images were collected in the study area, and the collected data were used as regional physical geography and engineering environment analysis. Secondly, the surface deformation rate at the line of sight (LOS) radar direction was extracted from the SBAS-InSAR using Sentinel-1A radar images and precise orbit determination, convert the LOS direction to slope direction, and use it as a dynamic indicator for landslide evaluation. Landslide evaluation indicators such as lithology, land use, rainfall and human activities were extracted, and they were subjected to multi-collinearity analysis to screen out the indicators suitable for landslide hazard analysis in the region. Then, the MCE-CNN model was proposed and constructed for landslide hazard analysis, and the RF and SVM models were also constructed for comparison experiments. Finally, to prove the validity of the dynamic change factors of the ground surface, the hazard evaluation system of ‘dynamic and static’ + ‘internal and external’ factors was constructed, and the landslide hazard analysis was carried out under three models (MCE-CNN, RF and SVM) respectively, and multiple statistical metrics were utilized for evaluation and validation.
Figure 1. The flowchart of this study.
2.1. Study area
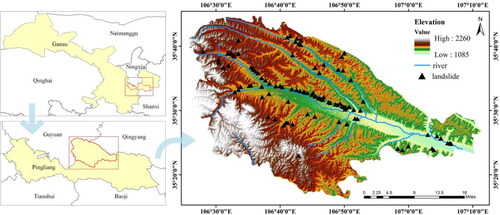
The study area is the Kongtong District, Pingliang City, Gansu Province, China, located at the eastern foot of Liupan Mountain and northwest of Loess Plateau, with a geographical location of 106°25′–107°21′ E and 35°12′–35°45′ N. The total width of the study area was 75 km in the east-west direction and 43 km in the north-south direction. Affected by the Liupan Mountain uplift, its terrain was high in the west and low in the east. The highest altitude reached 2260 m, while the lowest was 1085 m, covering an area of 1930 km2 in total (). The region was located in the temperate zone and has been dominated by a semi-arid continental monsoon climate with long winters and short summers. The annual average temperature has been 9.4 °C, and 503.7 mm for the average precipitation. Groundwater was mainly divided into 2 types, the Quaternary loose rock pore water and the Pre Quaternary clastic rock fissure water (Liu et al. Citation2014).
Figure 2. Location of the study area.
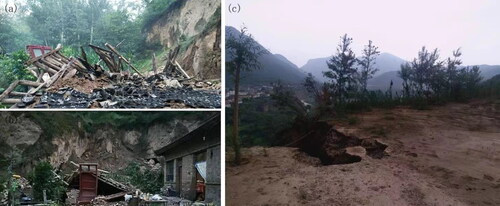
The urban built-up and planned areas include the Kongtong Town, the Liuhu Town, and the Sishilipu Town (Wang Citation2018). With the deepening of urban construction, the fragile geography, geological environment and precipitation concentration have caused frequent landslide disasters in Kongtong area, posing a major threat to the safety of people’s lives and property, as shown in . There were 193 geological hazards and hidden dangers, including avalanches, landslides, mud-rock flows, and unstable slopes. Most of the hazards were distributed on the north and south banks of the Jinghe River in a belt-like distribution, including 8 collapses, 102 landslides, 30 debris flow gullies, 45 unstable slopes, and 8 ground fissures, in total 102, all were loess-type landslides. Detailed information about each hazard was recorded in the landslide inventory dataset catalog.
Figure 3. Landslide sites in Kongtong District available online. (a) & (b) Baishui Town, July 11 2018 (https://www.sohu.com/a/241243234_681138); (c) Kongtong Town, July 27 2018 (https://mp.weixin.qq.com/s/rNpuW3930kZevN6LUDUZoA).
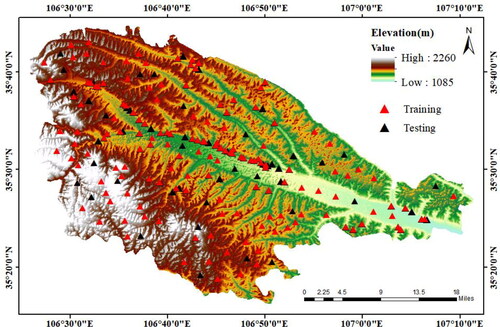
Landslide inventory affects the regional evaluation results and therefore be a basis of landslide hazard analysis (Yan et al. Citation2019; Lv et al. Citation2020a; Tran et al. Citation2020). In this study, the landslide inventory was interpreted from the remote sensing images and validated by regional geo-survey reports. A 1 km landslide-point-buffer were generated for each landslide point in ArcGIS 10.2, and 102 non-landslide points were randomly generated outside the buffer range within the study area through the random point creation tool of ArcGIS. Finally, the landslide points and non-landslide points were combined to establish the sample dataset (). During the experiment, 102 landslide points were broken up and 75% landslide points were randomly selected by non-return sampling. At the same time, 102 non-landslide points were broken up and 75% non-landslide points were randomly selected by the same method. The sample points above were combined and used as training samples, and the remaining data were used as validation samples.
Figure 4. Distribution of labeled data.
2.2. Synthetic aperture radar data
Launched on April 3, 2014, Sentinel-1A is the first ground observation radar satellite launched by ESA after ERS-1/2 and ENVISAT ASAR. The satellite was equipped with a C-band SAR sensor. Because of its advantages of easy data acquisition, all day, all-weather, and short revisit period, the Sentinel-1A has been widely used to monitor slow surface deformation. In this study, the Sentinel-1A satellite images (downloaded from https://search.asf.alaska.edu) were used to obtain the surface deformation rate. The orbital parameters were 693 km (height), 98.18 (inclination), and 12 days (revisit period), with 2 orbit direction ascending type and descending type. The Sentinel-1A data products included Ground Distance Image (GRD), Level-2 Ocean (OCN), and single look complex (SLC). In this study, the data product is SLC in the ascending direction. The spatial resolution is 5 × 20 m. A total of 21 scenes of images were used at a period from October 19, 2018, to February 11, 2020, and images were taken every 24 days. The detailed parameters were shown in .
Table 1. Basic parameters of the Sentinel-1A images.
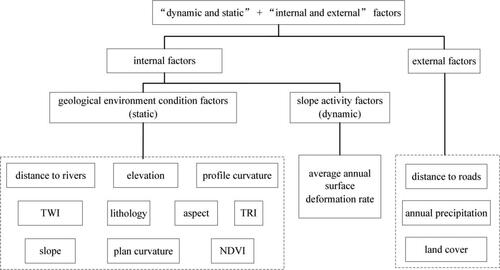
2.3. ‘Dynamic and static’ + ‘internal and external’ factors
Landslide hazard analysis is the process of analysing the relationship between landslide influencing factors and landslides, describing the temporal probability of slope instability in a given geological setting, and assessing the intensity and extent of landslide damage. There are two ways to describe the temporal probability of slope instability. The first way is to predict the probability of future landslide instability based on past landslide research patterns with similar characteristics, while the second way is to extract the landslide triggers with periodic characteristics over time as one of the evaluation indicators to indirectly assess the temporal probability. This study adopts the second evaluation method and combines external triggers of landslides such as rainfall to evaluate landslide hazards by constructing MCE-CNN models. However, landslides are often caused by slope instability, the development and evolution of slopes have cyclical and stage-specific characteristics, and their evolution process reflects the changes in landslide hazard, which cannot be reflected by the previous evaluation system. Therefore, this study also considers the activity changes during slope evolution, based only on the static ‘internal and external’ factors, a landslide hazard analysis method based on ‘dynamic and static’ + ‘internal and external’ factors was proposed.
The evolution of slope can be divided into 4 stages, i.e. gestation, initial deformation, isometric deformation and accelerated deformation stages. The gestation stage means no deformation has started and the slope is stationary, so the slope activity is weak; the initial deformation means the slope starts to deform and the deformation rate is irregular, so the slope activity is weak; isometric deformation stage deformation with time is linear, when the slope activity is strong; accelerated deformation indicates that the deformation rate and deformation acceleration increase more, when the slope activity is strong.
According to the evolutionary stages of slopes, it is known that different slopes are in different deformation stages and present different hazards. Most of the previous studies on hazard evaluation system only considered indicators such as topography and geomorphology, lithology, rainfall and earthquake, etc. Although they achieved good results, but in this case the default is that all slopes are in the same evolutionary state, however, different slopes are in different evolutionary states, which undoubtedly reduces the accuracy of hazard evaluation results. Therefore, in this study, for slopes with weak activity, the conventional nurturing environmental factors and external trigger indicators are used to describe, while for slopes with strong activity, slope activity indicators are used to portray, and on the basis of the conventional evaluation system, slope activity indicators (due to data limitation, only surface deformation rate indicators are considered at present) are integrated into the hazard evaluation system for landslide hazard analysis.
According to the scientific data selection and processing principles, combined with the slope’s own activity state indicators, the hazard evaluation system based on ‘dynamic and static’ + ‘internal and external’ factors was determined as shown in . The elevation, slope, aspect, plan curvature, profile curvature, topographic roughness index (TRI), topographic wetness index (TWI), distance to rivers, lithology, normalized differences vegetation index (NDVI) are taken as static geological environment condition factors; distance to roads, land cover, Annual precipitation are taken as external trigger factors, and surface deformation rate as dynamic slope activity factors for landslide hazard analysis.
Figure 5. Flow chart of surface deformation rate acquisition by SBAS-InSAR.
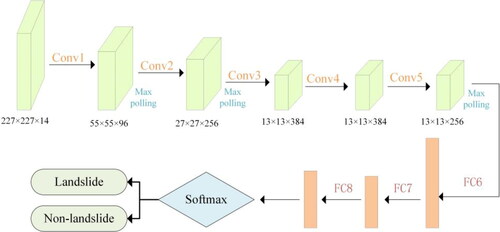
2.4. MCE-CNN model
The DL methods have been a hot-spot research topic in recent years. DL models have complex neural-similar structures that can automatically extract image features and learn the pattern of its distribution (Xu et al. Citation2022). Relevant algorithms have already made significant progress in object detection and classification (Lv et al. Citation2020b). In recent years, a large number of studies have proved that CNN performs better in feature extraction and data processing, which would also benefit the landslide hazard mapping. Therefore, in this study, a CNN model was constructed to explore various complex nonlinear relationships between the predisposing factors and landslides and to solve the modeling problem between complex data structures.
CNN's unique convolution layers and pooling layers could be arbitrarily combined into varieties of network models, among which AlexNet has been a widely used one. In this study, we obtained MCE-CNN model based on AlexNet model and improved it (Chen et al. Citation2021). The channels of the model had been expanded for AlexNet required 3-bands-patches while the predisposing factor datasets contained far more bands. The original 227 × 227 × 3 was changed to 227 × 227 × 14. Meanwhile, in the original version, 4096 outputs from the seventh layer were fully connected to 1000 neurons in the eighth layer, which means 1000 float values were output as the prediction results after training. But the results needed in this study were the probability of a sample be classified as landslide, so the number of neurons in the last layer was set to 2. In addition, to avoid insufficient model training due to the shortage of training data, a model migration strategy was adopted in the training process, that is, to load the weight parameter file pre-trained under bigger datasets, and then fine-tuning the parameters based on the training data, to ensure the full fitting of the model and improve the efficiency.
The network structure of MCE-CNN model was shown in .
Figure 6. The ‘Dynamic and Static’ + ‘Internal and External’ factors in landslide hazard analysis system.
3. Experiments
3.1. Surface deformation rate extraction
3.1.1. Surface deformation rate extraction in LOS direction
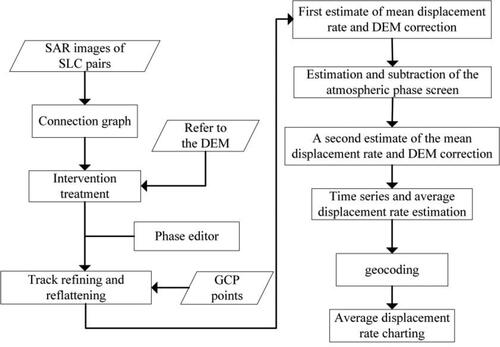
The SBAS-InSAR was obtained by combining the optimal solution of the normal-temporal baselined SAR images obtained in the same time series, the data was adjusted by the study area’s bound line and digital elevation model (DEM). Based on this method, several datasets were obtained. The SAR images in the set have good coherence due to the similar condition of normal-temporal baseline distance and other features. With the development of science and technology, various unwrapping algorithms and error removal algorithms have been proposed one after another, which also greatly improved the core technologies of InSAR (Hooper et al. Citation2012). The SBAS-InSAR method has been improved corporately, as a result, the accuracy of measurement has been higher. To obtain the surface deformation information, singular value decomposition (SVD) was needed, and geocoding was required afterward (Lanari et al. Citation2007).
The SARscape platform of ENVI software was used to process the SAR data in the study area, and the specific process was shown in . The SBAS-InSAR method generated the surface deformation over time by processing the interferogram with a shorter baseline and smaller decorrelations, which makes the deformation results more reliable.
Figure 7. MCE-CNN network architecture.
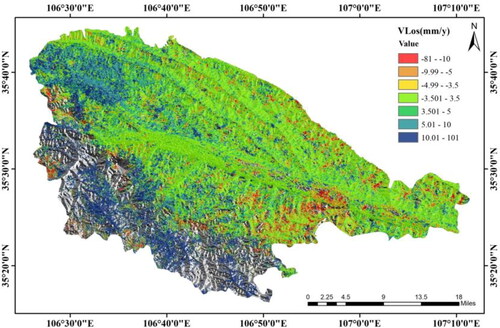
Except for the 21 SAR images introduced in section 2.2, we used the ASTER GDEM data (http://www.gscloud.cn/) and the precise Orbit Ephemerides (POD) data (from Sentinel-1A satellite). The ASTER GDEM data was used as the auxiliary data to remove terrain effects, while the POD data was used to eliminate the orbit error of the InSAR data, then the final annual average deformation rate was mapped, as shown in .
Figure 8. Average annual deformation rate in LOS direction, ranging from −81 to 101 mm/y.
3.1.2. Surface deformation rate extraction in slope direction
The surface deformation rate along LOS direction can be obtained by the SBAS technology, but most landslides slide were along the slope, so the SBAS technology cannot effectively monitor the real situation. In this paper, through the angle between LOS and slope direction proposed by Colesant and Cassini (EquationEquations 1–3), the surface deformation rate along LOS direction was transformed into the slope direction to express the surface deformation information (Colesanti and Wasowski Citation2006; Cascini et al. Citation2010).
(1)
(1)
(2)
(2)
(3)
(3)
where
and
indicated the surface deformation rate in slope direction and LOS direction, respectively.
was the included angle between LOS and slope direction,
was the aspect,
represented the slope,
was the incident angle, and
represented the angle between the azimuth direction and the north direction.
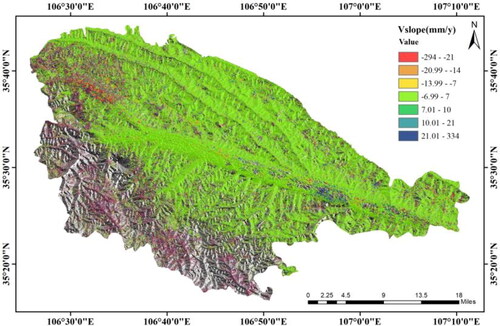
The surface deformation rate in the slope direction could be obtained through EquationEquations 1–3 (). When was near
and
was near 0,
would be approaching infinity. Therefore, in order to correct the abnormal value in
Herrera proposed a way, taking
as the fixed threshold. When
when
(Silvia et al. Citation2013). When
was negative, it would indicate that the landslide moved downward along the slope, and when
was positive, it would indicate that the landslide moved upward along the slope.
Figure 9. Average annual deformation rate in slope direction.
3.2. Evaluation indicator system construction
3.2.1. Production of landslide evaluation factors
The evaluation factors that once caused landslides are more likely to cause new ones, therefore, the geo-condition dataset has been the basis. Currently, there have been few universal standards for factors’ selection, but it’s generally agreed that the evaluation factors should be operable, non-uniformed, measurable, and non-redundant (Ayalew and Yamagishi Citation2005). After referring to the previous researches in Kongtong District (Li et al. Citation2007a, Citation2007b), 14 factors were selected (), including elevation, slope, aspect, plan curvature, profile curvature, TRI, TWI, distance to rivers, distance to roads, annual average precipitation, land cover, NDVI, lithology, and annual average surface deformation rate (The sources of factors are shown in ). The factors were stacked into a dataset that contains multiple layers, while data processing and analysis were based on ArcGIS 10.2, ENVI 5.3, as well as SARscape platform.
Figure 10. Landslide evaluation factors: (a) Elevation; (b) Aspect; (c) Slope; (d) Plan curvature; (e) Profile curvature; (f) TRI; (g) Lithology; (h) Distance to roads; (i) TWI; (j) Annual precipitation; (k) NDVI; (l) Land cover; (m) Distance to rivers; (n) Average annual deformation rate in slope direction.
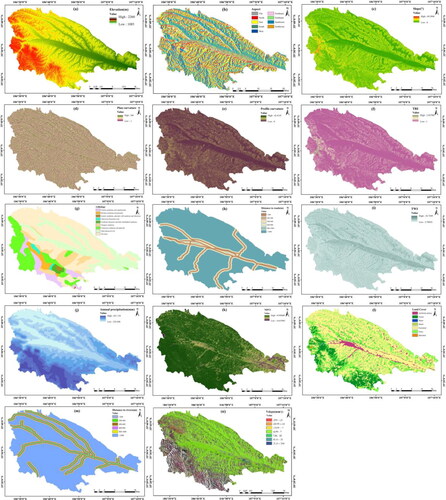
Table 2. Sources of factors.
To make sure all the factors were under the same data frame, the projection, conversion, and resample measures were adopted. All factors in the geo-condition dataset were converted into grid format and the spatial resolution was set as 30 m. Elevation, slope, aspect, plan curvature, profile curvature, and TRI were all calculated from the DEM. The DEM was derived from the geospatial data cloud (http://www.gscloud.cn/). The river network diagram was derived from the vectorized topographic map, while distance to rivers was generated by creating buffer rings, where the interval was set to 200 m. TWI was calculated from DEM, and NDVI was extracted from Landsat 8 remote sensing images (http://www.gscloud.cn/) based on the ENVI5.3 platform. The raw data of annual average precipitation with a spatial resolution of 1000 m was derived from the National Science and Technology Infrastructure Platform-National Earth System Science Data Center (http://www.geodata.cn). The data was interpolated and resampled in ArcMap 10.2 platform, and the annual average precipitation was obtained.
The lithology factor was extracted from a 1:1 million digital geological map. Distance to roads was obtained in the same way as to distance to rivers, by creating buffer rings. The GlobeLand30 dataset with a spatial resolution was used to extract the land cover. The annual average surface deformation rate was the dynamic factor and was extracted from Sentinel-1A images and the precision orbit data, the data procession platform was ENVI5.3 SARscape. Since different factors had different value ranges and types, the original geo-condition factors cannot be used directly, standardization, as well as reclassification, were demanded. The values of each factor were normalized to 0–255, and the stacked geo-condition dataset was band superimposed to input in the MCE-CNN.
3.2.2. Multi-collinearity analysis of evaluation factors
The high correlation among factors would affect the calculation and convergence speed of the CNN and therefore affect the accuracy of the landslide hazard analysis. Thus, a multi-collinearity evaluation was performed before training, the factors with significant collinearity would be eliminated. The indicators were variance inflation factor (VIF) and tolerance (TOL). The VIF value was usually higher than 1, when it appeared to be higher than 10, the correlation among the selected factors would be considered high. The TOL value was usually between 0 and 1, when TOL was less than 0.1, the correlation among factors would be considered high. In this study, the SPSS software was used for multi-collinearity analysis. Landslide or Non-landslide was taken as the dependent variables and 14 factors were taken as independent variables to calculate each factor’s VIF and TOL, the result was shown in . For each factor, VIF was less than 10 and TOL was higher than 0.1, therefore, the dataset was considered linear uncorrelated.
3.3. Landslide hazard analysis
Landslide hazard analysis was carried out with the MCE-CNN model. Since it required multi-layer data with the neighborhood information of each pixel, the data of the input was converted to a two-dimensional array format. In this study, a 14-bands two-dimensional image was obtained by multi-band synthetic processing. The platform used for model training and predicting was the Tensorflow, and the evaluation unit was the regular grid unit. In the evaluation, the synthesized two-dimensional image was taken as the input image, and the data in each grid cell was taken as the original data. After the training, the grid cells were divided into separated multi-band small images.
A total of 204 samples were used, 50% of which were landslide units derived from the interpretation of Kongtong area remote sensing images and regional survey reports, and 50% were non-landslide units (refer to Section 2.1 for the generation process). During the experiment, 102 landslide points were broken up and 75% landslide points were randomly selected by non-return sampling. At the same time, 102 non-landslide points were broken up and 75% non-landslide points were randomly selected by the same method. The sample points above were combined and used as training samples, and the remaining data were used as validation samples. In the training process, the parameter setting was optimized by trial-and-error method, and finally, the best combination of parameters was calculated, the batch size was set as 12, the data size was set as 35, the number of training cycles was set as 100, the initial learning rate was set as 0.01, and the activation function was ReLU.
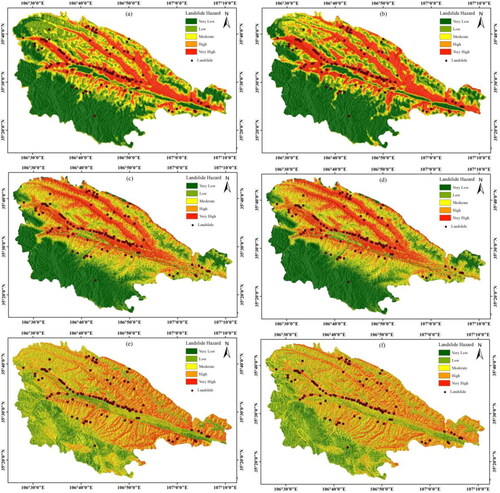
To further demonstrate the effectiveness of the MCE-CNN landslide hazard analysis based on ‘dynamic and static’ + ‘internal and external’ factors proposed in this paper, despite the MCE-CNN model, RF model and SVM model were also used for comparison experiments. Meanwhile, for each model, the comparison experiments based on ‘dynamic and static’ + ‘internal and external’ factors and only on the static ‘internal and external’ factors were tested separately. The hazard analysis methods for the three models based on ‘dynamic and static’ + ‘internal and external’ factors are referred to as SBAS-MCE-CNN, SBAS-SVM and SBAS-RF in this paper. The hazard analysis methods for the three models based only on the static ‘internal and external’ factors are referred to as MCE-CNN, SVM and RF in this paper. The natural breakpoint method was used to grade all results, which were divided into five levels, namely: very high, high, moderate, low, and very low. The results were shown in .
Figure 11. Results: (a) MCE-CNN; (b) SBAS-MCE-CNN; (c) SVM; (d) SBAS-SVM; (e) RF; (f) SBAS-RF.
3.4. Accuracy validation
To evaluate the feasibility of the methods used in this study, two evaluation methods, the OA and the ROC curve, were used. The OA value counted the number of correctly classified grid units and calculated the proportion against the total number of grid units. The higher the OA value, the higher the accuracy of the classification result. The OA value calculated is shown in . It can be seen from the table that the highest OA values is obtained for the landslide hazard analysis based on the MCE-CNN model and the ‘dynamic and static’ + ‘internal and external’ factors. In the comparison of the same models, the OA values obtained by using the slope activity state factor are all higher than those obtained by not using this factor.
Table 3. Multi-collinearity diagnostics for the variables used in this study.
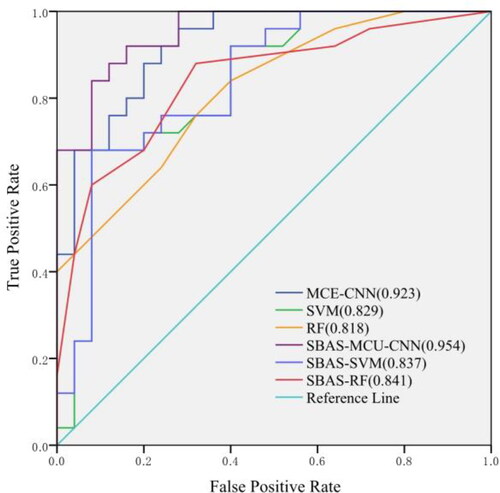
The ROC curve and AUC were used for further accuracy evaluation. The statistical results were shown in . The higher the AUC value, the higher the accuracy of the classification result. From the figure, it can be seen that the highest AUC value is obtained by the proposed method in this paper. In the comparison of the same model, the AUC values obtained using the slope activity state factor are higher, and in the comparison of different models, the AUC values obtained using the MCE-CNN model are higher than the other models, and both sets of values obtained by this model reach a high accuracy level.
Figure 12. Comparison of ROC curves of different methods.
4. Discussion
4.1. Model accuracy assessment and comparison
In this paper, MCE-CNN model was constructed for landslide hazard analysis based only on the static ‘internal and external’ factors and based on the ‘dynamic and static’ + ‘internal and external’ factors. Despite MCE-CNN model, SVM model and RF model were constructed for comparison tests. The MCE-CNN model proposed in this study is improved on the basis of AlexNet model with channel number expansion and transfer learning, which can extract deeper features of the objects and explore various complex nonlinear relationships between objects, which is of great help to improve the accuracy of landslide hazard analysis results. The SVM model has better advantages in improving generalization performance, solving high-dimensional problems, and avoiding the problems of neural network structure selection and local minima. The RF model is simpler to implement, faster to train, and has a strong generalization capability, which is a great advantage over other algorithms on many current datasets (Nhu et al. Citation2020). The experimental results of this paper show that the AUC values obtained from the three models based only on the static ‘internal and external’ factors are 0.923, 0.829, and 0.818, respectively, and the AUC values obtained based on the ‘dynamic and static’ + ‘internal and external’ factors are 0.954, 0.837, and 0.841, respectively, indicating that all three models can accurately evaluate the hazard of Kongtong district, but the MCE-CNN model proposed in this paper performs the best.
Among all evaluation factors used, there are more or less correlations between factors, for example, topographic factors such as slope and aspect are extracted from elevation, and deformation rate is also influenced by rainfall and rivers, etc. Moreover, due to the different formation mechanisms of different landslides, the landslides show irregular shapes and different sizes on the remote sensing images after occurrence, which are typical nonlinear features. However, MCE-CNN model has the advantage of fully mining the deep features among the factors as well as the landslides, and is able to fully express the nonlinear relationships. In previous studies, the results of hazard analysis using CNN models are more accurate compared to various other machine learning methods (Wang et al. Citation2019b, Huang et al. Citation2018, Zhang et al. Citation2018a), and this study also proves this through experiments.
From the results of the study, it can be seen that the analysis results obtained by the MCE-CNN model are higher in both OA and AUC values than those obtained by the other two machine learning models, and the accuracy of the MCE-CNN model is improved by 4% with and without the slope activity state factor, which is more favorable to the accuracy of the analysis results because the MCE-CNN method is more capable of learning features compared to the maximum 2% improvement of machine learning.
4.2. Advantages of hazard analysis based on ‘dynamic and static’ + ‘internal and external’ factors
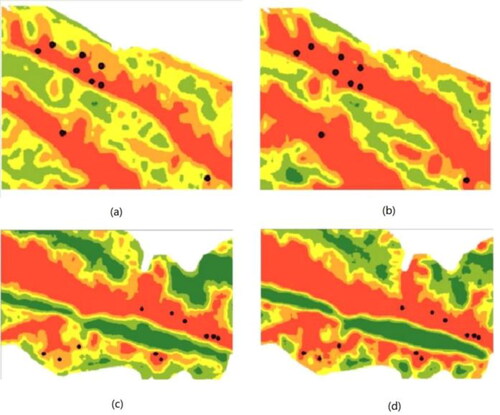
In this paper, we compare the details of the results of the best-performing MCE-CNN model for hazard analysis based only on the static ‘internal and external’ factors and based on the ‘dynamic and static’ + ‘internal and external’ factors, as shown in , where (a) and (c) show the details of the hazard results based only on the static ‘internal and external’ factors, and (b) and (d) show the details of the zoning results based on the ‘dynamic and static’ + ‘internal and external’ factors. From the figure, it can be found that the hazard analysis based on the ‘dynamic and static’ + ‘internal and external’ factors contains more landslide points in the very high hazard zone, indicating the effectiveness of introducing the evaluation factor of slope activity status.
Figure 13. Detailed comparison of hazard analysis results.
In this study, as shown in , the MCE-CNN model combining the slope activity state factor for prediction yielded an OA value of 88% and an AUC value of 0.954, which were 4% and 3.1% higher, respectively, compared to this model without the factor. And from the statistical table of landslide zoning in , it can be seen that the evaluation results combining the slope activity status factor have a higher percentage of landslides in the very high and high hazard zones, reaching 85.29%. In order to further prove the validity of the activity state factor, this study conducted a comparison test using RF and SVM models, and the results showed that in the comparison of the same models, the landslide hazard analysis results based on ‘dynamic and static’ + ‘internal and external’ factors were both more accurate than those based only on the static ‘internal and external’ factors, indicating that the dynamic change process of geographic parameters is an important indicator of landslide hazard, Previous studies have also shown that surface deformation rate can be used to optimize mapping results (Ciampalini et al. Citation2016; Hussain et al. Citation2021a, Citation2021b), thus further confirm the scientific value of the hazard evaluation factors constructed in this paper.
Table 4. Comparison of OA values between different methods.
Table 5. Landslide zonal statistics.
Both SBAS-InSAR technique and MCE-CNN model play an important role in landslide hazard analysis, and the combination of them further improves the accuracy of hazard evaluation results. Only 102 landslides were mapped in this study area, and they cannot fully represent the total number of historical landslides, which can easily lead to misclassification, while SBAS-InSAR can monitor the surface deformation of long time series, among which the terrain affected by slope deformation and other factors are susceptible to interference leading to misclassification, and the landslide hazard analysis combined with slope activity state factor can effectively improve misclassification and further improve the accuracy of evaluation results. Therefore, the landslide hazard analysis method based on ‘dynamic and static’ + ‘internal and external’ factors and MCE-CNN model proposed in this paper can provide a new idea for regional landslide hazard analysis in the future.
5. Conclusion
Loess and fractured landforms were widely distributed in the Longdong region or Western China. A fragile geological environment makes it highly incident of landslide and landslide-induced geo-hazards, which raised conspicuous conflict between economic development and geo-hazards. The landslide hazard analysis could predict the landslide occurrence and spatial distribution and has been an important basis for geo-hazards prevention and mitigation. Thus, in this study, a typical landslide-prone region in Longdong, the Kongtong District, Pingliang City, Gansu Province, was selected as the study area, a new method of hazard evaluation based on SBAS-InSAR and MCE-CNN was proposed by analyzing the physical geography and engineering environment of the area.
The method first extracts the annual average surface deformation rate of the study area by SBAS-InSAR, and then combines it with landslide hazard analysis factors such as stratigraphic lithology, slope and land use in the region to construct an evaluation system based on ‘dynamic and static’ + ‘internal and external’ factors. At the same time, 204 landslide samples were collected in Kongtong area, including 102 landslide samples and 102 randomly selected non-landslide samples, of the total samples, 75% were utilized for training, and the remaining 25% were applied for validation. Then, the result was validated using overall accuracy (OA) and area under curve (AUC) approach. In order to further prove the effectiveness of the proposed method, comparative experiments were designed from two aspects of model (MCE-CNN, SVM, RF) and factors (‘dynamic and static’ + ‘internal and external’ and only on the static ‘internal and external’). The results show that the AUC results of three models (MCE-CNN, SVM, RF) based on ‘dynamic and static’ + ‘internal and external’ factors were 95.4%, 83.7%, 84.1% respectively. The AUC results of three models (MCE-CNN, RF, SVM) based only on the static ‘internal and external’ factors were 92.3%, 82.9% and 81.8% respectively. Thus, The MCE-CNN model based on ‘dynamic and static’ + ‘internal and external’ factors performed best for this research and is more suitable for landslide hazard analysis in the study area.
In summary, the landslide hazard analysis model proposed in this study can significantly improve the accuracy, especially in the areas where the SBAS-InSAR method is available and applicable. The results generated in this paper can provide a scientific basis for landslide prevention and mitigation in the study area.
Authors’ contributions
Yi Zhang proposed the concept, the method and the undertook data processing; Dongping Ming supervised the study and modified the manuscript; Yangyang Chen and Xiao Ling assisted in the design of the model; Yueqin Zhu, Xinyi Zhang and Xinyi Lian were involved in writing the manuscript. All authors have read and agreed to the published version of the manuscript.
Availability of data and material
The data used or analyzed during the current study are available from the corresponding author on reasonable request.
Acknowledgements
Many thanks to National Science and Technology Infrastructure Platform-National Earth System Science Data Center for providing precipitation data.
Code availability
The code used during the current study are available from the corresponding author on reasonable request.
Disclosure statement
The authors report there are no competing interests to declare.
Additional information
Funding
References
- Ayalew L, Yamagishi H. 2005. The application of GIS-based logistic regression for landslide susceptibility mapping in the Kakuda-Yahiko Mountains, Central Japan. Geomorphology. 65(1–2):15–31.
- Bui DT, Shahabi H, Shirzadi A, Chapi K, Alizadeh M, Chen W, Mohammadi A, Ahmad B, Panahi M, Hong H, et al. 2018. Landslide detection and susceptibility mapping by AIRSAR data using support vector machine and index of entropy models in Cameron Highlands, Malaysia. Remote Sens. 10(10):1527.
- Calvello M, Peduto D, Arena L. 2017. Combined use of statistical and DInSAR data analyses to define the state of activity of slow-moving landslides. Landslides. 14(2):473–489.
- Cascini L, Fornaro G, Peduto D. 2010. Advanced low- and full-resolution DInSAR map generation for slow-moving landslide analysis at different scales. Eng Geol. 112(1-4):29–42.
- Chen Y, Ming D, Ling X, Lv X, Zhou C. 2021. Landslide susceptibility mapping using feature fusion based CPCNN-ML in Lantau Island, Hong Kong. IEEE J Sel Top Appl Earth Observ Remote Sens. 14:3625–3639.
- Ciampalini A, Raspini F, Lagomarsino D, Catani F, Casagli N. 2016. Landslide susceptibility map refinement using PSInSAR data. Remote Sens Environ. 184:302–315.
- Colesanti C, Wasowski J. 2006. Investigating landslides with space-borne Synthetic Aperture Radar (SAR) interferometry. Eng Geol. 88(3):173–199.
- Ghorbanzadeh O, Blaschke T, Gholamnia K, Meena S, Tiede D, Aryal J. 2019. Evaluation of Different machine learning methods and deep-learning convolutional neural networks for landslide detection. Remote Sens. 11(2):196.
- Ghorbanzadeh O, Crivellari A, Ghamisi P, Shahabi H, Blaschke T. 2021. A comprehensive transferability evaluation of U-Net and ResU-Net for landslide detection from Sentinel-2 data (case study areas from Taiwan, China, and Japan). Sci Rep. 11(1):14629.
- Ghorbanzadeh O, Xu Y, Ghamisi P. 2022. Landslide4Sense: reference Benchmark Data and Deep Learning Models for Landslide Detection. CoRR abs/2206.00515.
- Hong H, Kornejady A, Soltani A, Termeh SVR, Liu J, Zhu A-X, hesar AY, Ahmad BB, Wang Y. 2018. Landslide susceptibility assessment in the Anfu County, China: comparing different statistical and probabilistic models considering the new topo-hydrological factor (HAND). Earth Sci Inform. 11(4):605–622.
- Hong H, Liu J, Zhu A-X, Shahabi H, Pham BT, Chen W, Pradhan B, Bui DT.,. 2017. A novel hybrid integration model using support vector machines and random subspace for weather-triggered landslide susceptibility assessment in the Wuning area (China). Environ Earth Sci. 76(19):652.
- Hooper A, Bekaert D, Spaans K, Arikan M. 2012. Recent advances in SAR interferometry time series analysis for measuring crustal deformation. Tectonophysics. 514–517:1–13.
- Huang B, Lu J, Wang J. 2016. Object recognition algorithm based on deep convolution neural networks. J Comput Appl. 36:3333–3340.
- Huang F, Yao C, Liu W, Li Y, Liu X. 2018. Landslide susceptibility assessment in the Nantian area of China: a comparison of frequency ratio model and support vector machine. Geomat Nat Hazards Risk. 9(1):919–938.
- Hussain S, Hongxing S, Ali M. 2021. Optimized landslide susceptibility mapping and modelling using PS-InSAR technique: a case study of Chitral valley, Northern Pakistan. Geocarto Int. 37:1–22.
- Hussain S, Hongxing S, Ali M. 2022. PS-InSAR based validated landslide susceptibility modelling: a case study of Ghizer valley, Northern Pakistan. Geocarto Int. 37(18):3941–3962.
- Lanari R, Casu F, Manzo M, Zeni G, Berardino P, Manunta M, Pepe A. 2007. An overview of the small BAseline subset algorithm: a DInSAR technique for surface deformation analysis. Pure Appl Geophys. 164(4):637–661.
- Li H, Yang Z, Gao Y, Fang Z. 2007a. Establishment of risk assessment index-system of loess landslides based on GIS. Ningxia Eng Technol. 6:70–72.
- Li T, Wen M, Cong W. 2007b. Research on the zonation methods of landslides triggered by rainfall. Earth Sci Front. 14:107–111.
- Liu T, Liu X, Yang Q. 2014. A study of geological hazards susceptibility zoning of Kongtong District. Sci Surv Mapp. 58–61:71.
- Lv Z, Liu T, Cheng S, Benediktsson JA. 2020a. Landslide Inventory Mapping With Bitemporal Aerial Remote Sensing Images Based on the Dual-Path Fully Convolutional Network. IEEE J Sel Top Appl Earth Obs Remote Sens PP.
- Lv Z, Liu T, Wang RY. 2020b. Automatic Landslide Inventory Mapping Approach Based on Change Detection Technique With Very-High-Resolution Images. IEEE Geosci Remote Sens Lett PP.
- Nhu V-H, Mohammadi A, Shahabi H, Ahmad BB, Al-Ansari N, Shirzadi A, Geertsema M, R. Kress V, Karimzadeh S, Valizadeh Kamran K, et al. 2020. Landslide detection and susceptibility modeling on Cameron Highlands (Malaysia): a comparison between random forest, logistic regression and logistic model tree algorithms. Forests. 11(8):830.
- Pirasteh S, Shamsipour G, Liu G, Zhu Q, Chengming YE. 2020. A new algorithm for landslide geometric and deformation analysis supported by digital elevation models. Earth Sci Inform. 13(2):361–375.
- Pourghasemi HR, Kerle N. 2016. Random forests and evidential belief function-based landslide susceptibility assessment in Western Mazandaran Province, Iran. Environ Earth Sci. 75(185):1–17.
- Pradhan B. 2010. Remote sensing and GIS-based landslide hazard analysis and cross-validation using multivariate logistic regression model on three test areas in Malaysia - ScienceDirect. Adv Space Res. 45(10):1244–1256.
- Seeliger K, Fritsche M, Güçlü U, Schoenmakers S, Schoffelen J-M, Bosch SE, van Gerven MAJ. 2018. Convolutional neural network-based encoding and decoding of visual object recognition in space and time. Neuroimage. 180(Pt A):253–266.
- Silvia B, Gerardo H, Rosa M. 2013. Landslide activity maps generation by means of persistent scatterer interferometry. Remote Sens. 5:6198–6222.
- Tran QC, Minh DD, Jaafari A, Al-Ansari N, Minh DD, Van DT, Nguyen DA, Tran TH, Ho LS, Nguyen DH, et al. 2020. Novel ensemble landslide predictive models based on the hyperpipes algorithm: a case study in the Nam Dam Commune, Vietnam. Appl Sci. 10(11):3710.
- Wang J, Yang Y, Mao J. 2016. CNN-RNN: a unified framework for multi-label image classification. In: Proceedings of the IEEE Computer Society Conference on Computer Vision and Pattern Recognition. IEEE, 345 E 47TH ST, NEW YORK, NY 10017 USA. p. 2285–2294.
- Wang Q, Wang Y, Niu R, Peng L. 2017. Integration of Information Theory, K-Means Cluster Analysis and the Logistic Regression Model for Landslide Susceptibility Mapping in the Three Gorges Area, China. Remote Sens. 9(9):938.
- Wang Y. 2018. Application of analytic hierarchy process for urban geological hazard susceptibility evaluation in Kongtong District, Pingliang. Gansu Geol. 27:79–84.
- Wang Y, Duan H, Hong H. 2019a. A comparative study of composite kernels for landslide susceptibility mapping: a case study in Yongxin County, China. Catena. 183:104217.
- Wang Y, Fang Z, Hong H. 2019b. Comparison of convolutional neural networks for landslide susceptibility mapping in Yanshan County, China. Sci Total Environ. 666:975–993.
- Wang Z. 2007. Remote sensing for landslide survey, monitoring and evaluation. Remote Sens L Resour.
- Xu L, Dai F, Tu X, Tham LG, Zhou Y, Iqbal J. 2014. Landslides in a loess platform, North-West China. Landslides. 11(6):993–1005.
- Xu L, Ming D, Du T, Chen Y, Dong D, Zhou C. 2022. Delineation of cultivated land parcels based on deep convolutional networks and geographical thematic scene division of remotely sensed images. Comput Electron Agric. 192:106611.
- Yan G, Liang S, Gui X, Xie Y, Zhao H. 2019. Optimizing landslide susceptibility mapping in the Kongtong District, NW China: comparing the subdivision criteria of factors. Geocarto Int. 34(13):1408–1426.
- Zhang T, Han L, Chen W, Shahabi H.,. 2018a. Hybrid integration approach of entropy with logistic regression and support vector machine for landslide susceptibility modeling. Entropy. 20(11):884. https://doi.org/10.3390/e20110884.
- Zhang Y, Meng X, Jordan C, Novellino A, Dijkstra T, Chen G. 2018b. Investigating slow-moving landslides in the Zhouqu region of China using InSAR time series. Landslides. 15(7):1299–1315.