
 ?Mathematical formulae have been encoded as MathML and are displayed in this HTML version using MathJax in order to improve their display. Uncheck the box to turn MathJax off. This feature requires Javascript. Click on a formula to zoom.
Abstract
Recently, hyperspectral image (HSI) super-resolution (SR) techniques based on deep learning have been actively developed. However, most hyperspectral image super-resolution reconstruction methods usually use all spectral bands simultaneously, leading to a mismatch of spectral properties between reconstructed HSI bands. Therefore, we proposed a new method of spatial-spectral dual path residual network (SGDPRN) based on spectral response function (SRF) to address the above problem. The SGDPRN is composed of the SRF guided grouping part, the spatial-spectral feature extraction part, and the final reconstruction part. Firstly, the reconstructed features for different spectral ranges are identified separately using SRF as a guide. Then, based on the grouping results, a spatial-spectral dual-path residual block is used to explore the spatial and spectral features by the designed parallel structure simultaneously. The spatial path is designed to extract sharp edges and realistic textures, and the spectral path is designed to model inter-spectral correlations to refine spectral features. At last, the third block of SGDPRN concatenates features of all groups and finishes the reconstruction of HSISR. QUST-1 satellite images have been applied in experiments, and the results showed that SGDPRN produced a higher peak signal to noise ratio, structural similarity metric, correlation coefficient, and lower spectral angle mapper, root mean square error than the other methods. This demonstrates that our method can effectively maintain the correlation of spectral bands while improving the spatial resolution.
1 Introduction
Hyperspectral images include hundreds of tiny spectral channels (Bioucas-Dias et al. Citation2013), which have strong spectral discrimination ability due to their rich spectral information (Gong et al. Citation2020). Therefore, HSI is often used in various studies, such as geological exploration (Khan et al. Citation2018), HSI classification, land-cover identification (Mei et al. Citation2020), and change detection (Qu et al. Citation2022). These applications are critical to human survival and development. For example, Hyperspectral unmixing (Zhu et al. Citation2021a) enables better HSI analysis and has great potential in applications such as geological exploration and mineral mapping. HSI classification, which assigns a label to each pixel, plays a crucial role in the interpretation of hyperspectral remote sensing images (Zhu et al. Citation2021b). Sub-pixel mapping technique performs land-cover type identification better by dividing pixels into sub-pixels and assigning land cover categories to each sub-pixel (Chen et al. Citation2020a). Change detection on remote sensing images is an important application for observing earth changes. Because it can provide a basis for environmental health and urban management (Chen et al. Citation2020b). However, HSIs are typically obtained with poor spatial resolution and are unable to capture of capturing detailed spatial information, it is of great importance to improve the spatial resolution of HSI. The purpose of HSI super-resolution (SR) reconstruction is to improve the spatial resolution of the input HSI through post-processing without changing the sensor, which is of great significance for accurate classification (Zhu et al. Citation2022a) and change detection (Zhu et al. Citation2022b). HSISR reconstruction has attracted much attention for its convenience and flexibility.
In recent years, many methods have been proposed to improve the spatial resolution of HSIs, which are mainly divided into two categories: image fusion and single image SR. For the method based on image fusion, it is necessary to use images with high spatial resolution in the same scene and similar time. In practice, these data are not always available because they are easily affected by the weather or other factors. Therefore, most current studies use synthetic datasets to prove the effectiveness of their methods. Methods based on image fusion have made great progress, such as more advanced methods based on coupled sparse tensor factorization (Li et al. Citation2018), deep HSI sharpening method (Dian et al. Citation2018), and subspace-based method (Dian and Li Citation2019; Dian et al. Citation2021). These methods have yielded excellent results with significant improvements in reconstruction accuracy and runtime. In contrast, single image SR, a signal post-processing technique designed to generate high-resolution (HR) images from low-resolution (LR) images, is more flexible and adaptable without the need for additional data.
In the past few years, various reconstruction algorithms based on convolutional neural networks (CNNs) (Lan et al. Citation2021; Yang and Qi Citation2021; Jiang et al. Citation2022) have been proposed for the SR of natural images. The first convolutional neural network applied to super-resolution (SRCNN) proposed by Dong et al. (Citation2014) proved that CNN is superior to traditional methods in terms of nonlinear mapping from LR to HR image information. Since then, researchers have designed more complex networks to improve the effect of experiments (Chen et al. Citation2021; Dong et al. Citation2021; Lan et al. Citation2021; Wang et al. Citation2021; Zhang et al. Citation2021).Super-resolution reconstruction is playing an increasing role in remote sensing (Zhang and Zhang Citation2022). HSISR reconstruction is being increasingly studied and will face more challenges in its work than natural image SR. On the one hand, although the abundant hyperspectral information of HSI is helpful to reflect the subtle spatial morphological characteristics of ground objects, it also makes feature extraction more challenging. Many researchers simply stack more layers to capture local spatial features through RB (residual block) (He et al. Citation2016), DB (dense block) (Huang et al. Citation2017), RDB (residual DB) (Zhi et al. Citation2019), and other methods to improve SR performance. However, these models are unable to provide adequate extraction of raw LR remote sensing images that lack detailed information, thus limiting the representation capability of CNNs. On the other hand, modelling all spectral bands during HSI reconstruction would result in mismatching between spectral information and ground truth, resulting in spectrum distortion (Qu et al. Citation2018). Therefore, studies in recent years have increased the spectral correlation of hyperspectral images by imposing spectral constraints, such as 3 D convolution (Hu et al. Citation2017), spectral tensor (Obukhov et al. Citation2021), and spectral difference learning (Liu et al. Citation2018). The method of convolution with the same weights to fuse the spatially localized information of each band causes a mismatch in the spectral characteristics, making it impossible to be identified between various bands (Lanaras et al. Citation2015; Galliani et al. Citation2017), and significant artificial artifacts and noise appear in each band.
To solve the above problems, this paper proposes a spectral response function (SRF) guided spatial-spectral dual path residual network (SGDPRN). With 3 D HSI as input, all the spectral bands are divided into different groups according to the SRF, which can alleviate the mismatch of spectral properties between different bands. The spatial path extracts high-level spatial features from rich low-level spatial features. Secondly, the spectral path uses spectral dimensional attention for spectral dimensional feature extraction, which maintains high spectral fidelity and improves the reconstruction quality by adaptively recalibrating the interband correlation and refining the band features. Adding channel attention mechanism (CAM) after the spatial-spectral dual path block can emphasize some of the information selectively. And also, it can use the global spatial-spectral information to model the spectral interdependencies so that feature interactions can make different contributions to the reconstruction. Finally, the deconvolution layer completes the final reconstruction. In conclusion, the main contributions of this paper can be summarized as follows.
A novel method named SGDPRN is designed for HSISR. It can improve the spatial resolution and reduce the distortion of spectral information simultaneously, providing a basis for advanced feature extraction and exploration of spectral correlation.
A spectral grouping block is designed to alleviate spectral disorder during HSI reconstruction. This block used the spectral response function to guide the band grouping from the aspect of imaging, maintaining the continuity and integrity of spectral information.
A Bi-residual block is proposed to explore spatial features. It can realize feature extraction and fusion from horizontal and vertical dimensions to make the feature representation more diversified, thus improving the reconstruction performance in the spatial dimension.
2 Related works
2.1. Super-resolution reconstruction of hyperspectral images based on deep learning
In general, the reconstruction pattern of HSISR mainly contains two ways. The first way is to increase the spatial resolution of each HSI channel individually. For example, Kwan et al. (Citation2018) used a single-image super-resolution algorithm combined with panchromatic (PAN) band images to improve the spatial resolution of HSI channel by channel. Also, (Yuan et al. Citation2017) applied natural image knowledge and transfer learning to each spectral band of HSI to improve hyperspectral image resolution. However, this kind of pattern neglects the spectral correlation features of the HSI, which will certainly decrease the accuracy of the reconstruction and cause the mismatch of spectrum characteristics. Another method is to use all channels of the HSI together as input and combine all features together to learn end-to-end mapping (Wang et al. Citation2017; Dou et al. Citation2020; Wan et al. Citation2020; Lu et al. Citation2021). For example, Hu et al. (Citation2020) developed a multiscale feature fusion and aggregation network with 3-D convolution (MFFA-3D) to process all channels of HSI simultaneously, greatly increasing the spectral correlation of reconstructed images. However, the HSI has a priori knowledge of adjacent spectral band correlations (Paul and Kumar Citation2021; Zhao et al. Citation2021), and fusing the features of all channels using 3 D convolution will add some noise to spectral signal inevitably, leading to spectral disorder problems.
2.2. Spectral correlation modelling
Compared with natural images, the striking feature of HSI is the correlation between spectral bands. This characteristic is the focus of hyperspectral image super-resolution reconstruction. Because adjacent spectral bands generally have similar spectral reflectance (Li et al. Citation2021), adjacent HSI spectral bands may share similar spectral properties. Therefore, in the HSISR task, the spectral information of the adjacent bands of the spectrum in LR-HSI is essential to maintain the spectral fidelity of HR-HIS (Akgun et al. Citation2005; Arun et al. Citation2020; Wang et al. Citation2022). Li et al. (Citation2019) proposed a spatial-spectral information separation strategy, in which 1 D convolution was used to encode small changes in the spectrum, and then the spatial-spectral information was gradually fused. The group attention block (GAB) is introduced into the progressive split-merge super-resolution (PSMSR) framework (Li et al. Citation2021) to focus on learning spectral information and improving the learning ability of spectral channels. The 3-d band attention mechanism in the Hybrid 2-D–3-D deep residual attentional network (HDRAN) (Li et al. Citation2021) recalibrates the band orientation to enhance context features. Therefore, correlation learning between spectral bands is crucial for coupling each spectral band of HSI with its local adjacent spectral band.
3 Methods
In this paper, we aim is to learn a mapping function that can reconstruct the corresponding
image from a given input
The image super-resolution reconstruction process of the whole model is as follows:
(1)
(1)
3.1. Network architectures
As shown in , the proposed SGDPRN framework consists of three main components: spectral response function (SRF) guided grouping, spatial-spectral feature extraction, and final reconstruction. Firstly, the SRF bootstrapping block consists of two layers of group convolution and grouping functions. when all the spectral bands were reconstructed simultaneously, it is usually caused spectral disorder. And the SRF can alleviate this problem by guiding the spectral grouping. Secondly, the spatial-spectral dual path block consists of a spatial dual-residual block and spectral dimension attention. It can extract each group of spatial features in parallel and skilfully establish the correlation model between spectral bands. At last, the final reconstruction part uses the channel attention mechanism to calibrate the out-of-group spectral information between groups to refine the band features, and achieve super-resolution through the deconvolution layer. The SGDPRN framework has as input and
as output. L, M, and C represent the height, width, and spectral dimension (channels), and r denotes the upsampling factor. In this paper, r is 4, and C is 32. Firstly, the HSI was grouped by the spectral response function guide block and the low-level features were extracted to obtain the output Ii. The formula is as follows:
(2)
(2)
where
represents spectral response function guided grouping and low-level feature extraction. Low-level feature extraction is carried out by group convolution, and i indicates the group number. Then, the low-level features
extracted from each group were sent into the corresponding spatial-spectral dual path block, where c was the number of channels in the feature map. The formula is as follows:
(3)
(3)
where
represents the operation of the nth spatial spectral path block (SSPB) of the ith spectral group, which is a parallel composite function composed of spatial branches and spectral branches. More details will be given in section 3.3.
Figure 1. Network framework diagram.
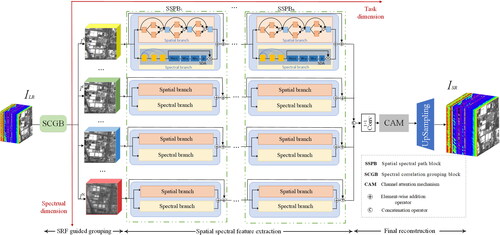
To obtain the complete HSI features, the grouped spatial-spectral features generated in the previous module are first concatenated, denoted as and the fused features are mapped to a new 32-channel output after a 1 × 1 group convolution. Then the correlation between the spectral bands is modelled using CAM, which further enhances the detailed contextual features of the spectral information and optimizes the hyperspectral image super-resolution reconstruction. The increase in resolution of the final reconstruction (FRE) section is completed by the upsampling layer. The above process can be expressed as:
(4)
(4)
where HFRE contains a 1 × 1 convolutional layer, CAM module and upsampling block.
3.2. Spectral response function guided grouping
SRF can provide spectral correlation between HSI bands from an imaging perspective. Different adjacent bands have the same spectral wavelength response, resulting in similar imaging. Therefore, bands with a common spectral response are spectrally correlated with each other. Therefore, the features of correlated spectral bands are extracted by the same set of convolution operators, enriching spatial features and alleviating spectral clutter. In contrast to traditional deep learning-based approaches, SRF guided is an assisted operation that allows for effective SR performance. In many types of studies, auxiliary physical manipulation has provided a great deal of help in processing image recovery (Zheng et al. Citation2017; Hang et al. Citation2020; Yan et al. Citation2020). The SRF-guided spectral correlation grouping block (SCGB) is proposed to group bands with the same spectral response and extract low-level image features. The SRF-guided spectral correlation block is shown in .
Figure 2. Spectral response function guide block.
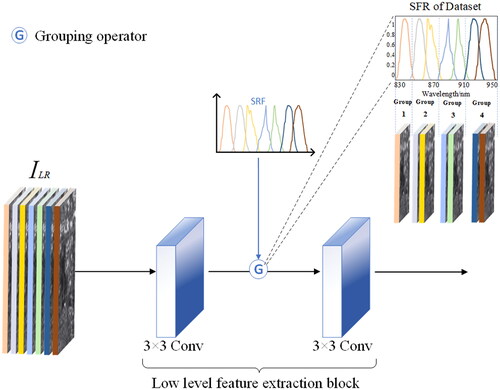
The reconstructed features for different spectral ranges are identified separately using SRF as a guide. The whole block area consists of two layers of group convolution and grouping functions. The data cube is fed into the first 3 × 3 group of convolutional layers to extract the spectral features. The spectral bands are then correlation grouped by using the SRF grouping function, and these features are fed into a second SRF-guided 3 × 3 convolution layer. The spectral correlation grouping is used to avoid distortion of the reconstruction due to the excessive spectral difference between different channels. The spectral correlation is roughly represented from the similarity of the imaging according to the spectral response function, while the detailed modelling of the spectral correlation is the responsibility of the SDA module as explained in detail in 3.3. The formula is expressed as follows:
(5)
(5)
For example, in the 32-band QUST-1 HSI satellite dataset, spectral ranges are grouped into 13 categories according to the spectral response function. The grouped spectral features are then fed separately into a shallow feature extraction block. Thus, the SRF-guided convolutional layer acts as a spectral grouping recovery.
3.3. Spatial-spectral dual path
Since both spatial features and spectral features contribute to learning for
mapping
a spatial-spectral feature extraction block is proposed to explore both spatial and spectral features of
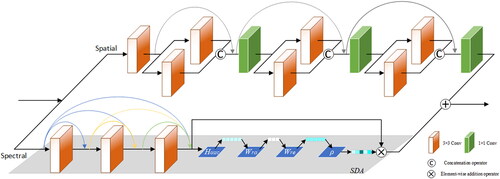
An illustration is presented in . Benefiting from this parallel structure, spatial and spectral information at the same level can be sufficiently fused to achieve constraints on spectral fidelity in the feature extraction process. The proposed spatial-spectral feature extraction block consists of a spatial branch and a spectral branch, where the spatial branch is used to extract spatial features from the
and the spectral branch extracts spectral features from the
The spatial and spectral information is then Integration to produce spatial-spectral features to generate
in subsequent operations.
Figure 3. Spatial-spectral dual pathway module structure.
3.3.1. Spatial branch
The module structure of the space-spectral feature extraction block is shown in the figure. The spatial branching model consists of a novel Bi-residual block (BRB). Compared with the traditional residual block, the dual path structure can extract more spatial features from hyperspectral remote sensing images that lack detailed information. At the same time, the latter layer of the module can fuse different feature images extracted from the dual branch convolutional layer of the previous layer, so feature expression is more diversified and refined. In this structure, there are parallel connections between the two paths, which can provide more possibilities for spatial feature extraction. The formula for the module is as follows:
(6)
(6)
where Xn is the input of the nth convolution, f1 and f2 are the first and second paths, respectively, and the convolution kernel is 3 × 3; Fn is the feature aggregation between different level features; and Yn is the fusion feature obtained by convolution with a 1 × 1 kernel. Then, the spatial features and spectral branch features are aggregated into the subsequent space-spectrum extraction blocks for further extraction and fusion.
3.3.2. Spectral branch
Most CNN-based HSISR reconstruction models pay little special attention to the inherent correlation between HSI bands. The spectral branching model can be adapted to recalibrate the correlation between spectral bands and refine band features to improve the ability to learn spectral information and maintain spectral fidelity. Spectral branching uses spectral dimensional attention for spectral dimensional feature extraction. The spectral dimensional attention is composed of a dense residual block integrated with a channel attention mechanism. With the dense residual block, the main spectral information is extracted so that the recovered spectral features are as consistent as possible with the ground truth HSI. The feature output of the dense residual block is where N × M is the feature size, C is the number of feature channels, and the overall output is
The CAM of the spectral branch takes advantage of the intrinsic interdependence between the HSI bands within the group to adaptively recalibrate the spectral dimensional feature response for enhanced discrimination learning. The CAM structure is shown in . The overall output U first undergoes a squeeze operation to generate a channel descriptor Z in the spatial dimension. While achieving dimensionality reduction, the computational complexity of subsequent operations is significantly reduced. After that, an excitation operation is performed to obtain the dependence degree between each spectral band. First, CAM uses the spatial global average pool to convert the global spatial information (GSIC) of the feature channel pattern into the feature channel descriptor
(
and the cth component of Z is calculated as Equationequation (7)
(7)
(7) . Uc(i, j) is the spectral response of the c feature graph uc at the
position.
(7)
(7)
Each channel descriptor represents the description information of all receptive fields in the channel, and the whole descriptor sequence represents the description information of all channels. By evaluating the entire descriptor, context information beyond a single channel can be leveraged. Secondly, to make full use of the information collected by descriptors, the correlation between spectral features is captured comprehensively. A simple gating mechanism is applied, and the formula is as follows:
(8)
(8)
wre is the convolution coefficient of the dimension reduction layer, wra is the convolution coefficient of the dimension increase layer, and the dimension reduction ratio is r.
and
are the sigmoid function and PReLU activation function respectively. Finally, Sp is the spectral correlation statistic. Sp is readjusted for the final output.
(9)
(9)
where spc and uc are the spectral correlation coefficient and feature map of channel C respectively. The spectral dimensional attention mechanism can be used to adaptively recalibrate spectral feature components in spectral branches and refine band features.
3.4. Final reconstruction and spatial-spectral loss
To maintain spectral correlation during the HSISR reconstruction, L2 loss and spectral angle mapping (SAM) loss are employed in our method as loss functions. The formula is as follows:
(10)
(10)
where
is the result of the reconstruction of HSI, X is the true value, and Xj is the restored spectral vector presented in the jth pixel. Xj is the true value, and α is a balance parameter.
The reconstruction part of SGDPRN aims to reconstruct the required high resolution HSI from the hyperspectral feature SF. First, the feature SFi of each group guided by the spectral response function was connected to obtain the feature SF of all the data. The group convolution of the 1 × 1 kernel is used for channel transformation to convert the SF channel into the channel output required by the HSI. We set up 32 channels according to our data output requirements. However, using the coiling kernel of the 1 × 1 kernel alone for channel transformation cannot maintain the spectral correlation of reconstructed HSI images (Zhang et al. Citation2018; Luo et al. Citation2019; Yang et al. Citation2019). To ensure that the continuity of the global spectra of the reconstructed HSI images is not affected by the grouping reconstruction operation of the proposed method, CAM is added after the group convolution of the 1 × 1 kernel. The CAM accesses the integral information of all spectral bands within and between groups and recalibrates the spectral features using the integral image information. Then the final super-resolution reconstruction image is obtained by an upsampling block to increase the resolution. The final reconstruction equation is as follows.
(11)
(11)
where
is the feature connection operation of each group, Conv1 the is a 1 × 1 convolution, HCAM is the channel attention mechanism, and Hus is the deconvolution operation.
4 Experiment and analysis
4.1. Datasets
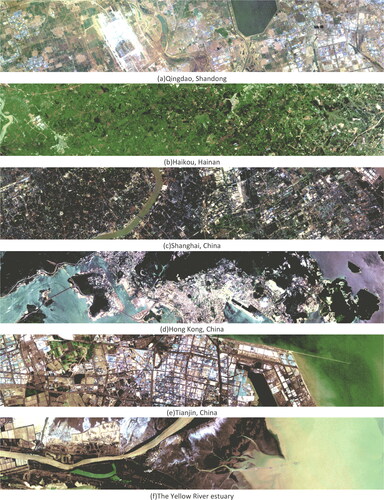
To evaluate the effectiveness of the proposed method, experiments were carried out on hyperspectral images collected by the QSTU-1 satellite. This dataset includes six regions: ① Qingdao, Shandong Province, ② Haikou, Hainan Province, ③ Shanghai, China, ④Hong Kong, China, ⑤ Tianjin, China, and ⑥ the mouth of the Yellow River. Each image has a size of 5056 × 5056, a spectral range of 400–1000 nm, and a total of 32 bands with a spatial resolution of 10 m. As shown in , the dataset has areas with typical land cover types, such as vegetation, suburbs, and various buildings, as well as a variety of geographical forms, such as plains, mountains, and oceans.
Figure 4. Partial data presentation for each dataset. (a) Qingdao, Shandong Province and (b) Tianjin, China.
Each of the six regions of data acquired by the QUST-1 satellite is treated as a sub-dataset. Each sub-dataset is divided into training data, test data, and validation data. The image of each region is separated into a set of 64 × 64 size images. Ten of 64 × 64 pixel images were randomly selected to evaluate the performance of our proposed framework, another ten images were used for verification, and the rest images were used for training. Hyperspectral remote sensing images are set as basic high-resolution images when making a super-resolution reconstruction training set. Adding Disk blur by simulating the fuzzy model of the remote sensing image, the LR image is obtained by bicubic interpolation. Different Disk blur cores are used to blur LR images so that the images have different blur degrees (Xie et al. Citation2019).
4.2. Implementation details
In the network proposed in this paper, zero padding is utilized to maintain the same size for all feature graphs. The number of SSPBs is set to 6, and the output of each SSPB is 128 feature maps. The network parameters were optimized using the Adam (Li et al. Citation2018) correction method. Considering the scale of the network, 32 LRHSI patches with a size of 64 × 64 × 32 were randomly selected from the training images as inputs for each training batch. The initial learning rate is set to The network was built using the open-source PyTorch deep learning framework and trained on an Ubuntu 10.4 system with an NVIDIA GTX3080Ti GPU device.
The spatial-spectral feature extraction part of SGDPRN consists of multiple spatial-spectral dual path blocks to obtain the features from the ILR features. In the spatial-spectral feature part, multiple spatial-spectral dual path blocks increase nonlinearity but also introduce too many weighting parameters. The number of spatial-spectral dual path blocks was set to 4, 5, 6, 7 and 8 for the experiments. shows the peak signal to noise ratio (PSNR) and the spectral angle mapper (SAM) of the SGDPRN. The best performance of the SGDPRN was obtained when the number of spatial-spectral dual path blocks was set to 6. Therefore, in the next experiments, the number of spatial-spectral dual path blocks in the spatial-spectral feature extraction part was set to 6.
Table 1. Comparison results of different numbers of SSPBs in the Qingdao dataset in Shandong.
4.3. Evaluation metrics
In this paper, five mainstream evaluation metrics are used: PSNR, structural similarity metric (SSIM), SAM, root mean square error (RMSE), and correlation coefficient (CC).
PSNR is an objective standard to evaluate images by calculating the mean square error of generated images and original images, which can be expressed as:
(12)
(12)
where IHR represents the original image, ISR represents the generated image, and
takes the maximum pixel value in the image. The higher the PSNR value is, the higher the reconstruction quality of the image and the smaller the gap with the original image.
SSIM emphasizes the structural consistency of generated images and original images, which can be defined as follows
(13)
(13)
where μSR and μHR denote the mean value of the original image and generated image, respectively σHR and σSR represent the standard deviation of the original image and generated image, respectively, and c1 and c2 are constants. Higher SSIM values are indicative of higher image quality.
The spectrum of each pixel in the image is regarded as a high-dimensional vector, and SAM measures the similarity between the spectra by calculating the included angle between the two vectors. The smaller the included angle is, the more similar the two spectra are. It can be calculated as:
(14)
(14)
RMSE is a global metric reflecting image quality according to the signal error between the generated image and the real scene image. It can be calculated as:
(15)
(15)
where L, M, and C represent the height and width of the generated image and the number of channels, respectively. The smaller the RMSE value is, the higher the quality of the generated image is.
The correlation coefficient (CC) reflects the geometric distortion of reconstructed images, and the ideal value is 1, which can be calculated as:
(16)
(16)
4.4. Experimental results
Six strategies, Bicubic, SRCNN (Dong et al. Citation2014), RCAN (Zhang et al. Citation2018), 3DFCNN (Mei et al. Citation2017), SSPSR (Jiang et al. Citation2020) and SGARDN (Liu et al. Citation2021), were selected as baselines and compared with a sampling factor of 4x. Bicubic is a classical interpolation method. SRCNN and RCAN are natural images SR methods based on CNN, representing different levels of depth and network structure. 3DFCNN and SSPSR are hyperspectral images SR methods based on CNN. The network parameters for the comparison method are set according to the corresponding references. SGARDN is a more advanced spectral packet residual dense network model.
The datasets for the six regions were divided into three types based on the type of land cover: large buildings including Qingdao, Shandong, and Tianjin, China; small building complex’s including Shanghai and Hong Kong, China; and natural environments, including the Yellow River estuary and Haikou, Hainan.
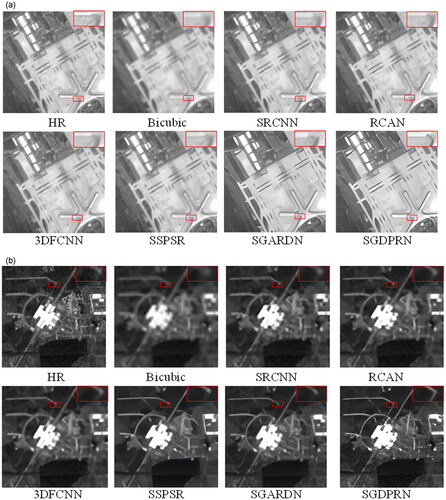
4.4.1. Results on large buildings
With limited spatial resolution, the large buildings dataset contains larger objects and clearer textures than the other two datasets. Thus abundant feature information can be extracted during super-resolution reconstruction. According to , SGDPRN performed better than the others. Especially compared with suboptimal SGARDN, the PSNR and SSIM have been improve 0.594 dB and 0.007 respectively. For the SAM metric, it was also reduced by 0.284. Both RMSE and CC metrics also improved. The detailed evaluation results are shown in .
Table 2. Quantitative comparison of different methods for large building datasets.
shows that there is a gap in the value of the SAM metric. The indicators obtained by the Bicubic, SRCNN, and RCAN are worse than those obtained by 3DFCNN, SSPSR, SGARDN, and SGDPRN methods. Because Bicubic, SRCNN, and RCAN use a single spectral channel during the reconstruction of HSISR, which cannot capture the spectral properties of HSI. The SGDPRN proposed in this paper still achieves the optimal results than the others among the advanced HSI reconstruction methods. This demonstrates results proved that SGDPRN can effectively identify the reconstructed features in different spectral ranges, and recalibrate the feature response of the spectral information feature adaptively and selectively. So that, the recovered spectral features can be consistent with the ground-truth HSIs as much as possible.
exhibits the reconstruction results of different methods. To make a clear comparison between the results, we marked the critical areas with red rectangles in the figure. As we can see, the basic Bicubic interpolation method does not produce additional details. Deep learning-based technologies, such as RCAN and 3DFCNN, can reconstruct some texture details, but due to their global optimization scheme and inadequate utilization of architectural features, image texture details are blurred. The proposed SGDPRN expresses the features in a more diverse and refined way. Meanwhile, it can deliver the features to a deeper layer. Thus, in terms of restoring finer texture and sharper edges, the proposed SGDPRN is superior to other methods.
Figure 5. Visualization results of the large building dataset. (a) Qingdao, Shandong Province and (b) Tianjin, China.
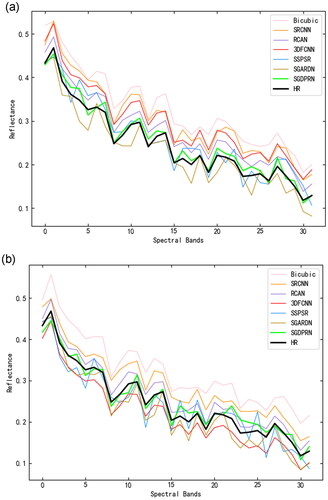
In addition, to show the performance of the reconstructed images in terms of spectral preservation. We randomly separately selected a pixel in each of the two scenes in and plotted the corresponding spectral curve after reconstruction by different methods. As shown in , In in terms of spectral preservation, the SGDPRN framework is substantially superior to the comparative methods. The obtained spectral curves are closer to the ground truth values with less spectral loss, which further proves the effectiveness of SRF guidance.
Figure 6. Spectral profiles of various methods on the large building dataset. (a) Shanghai, China and (b) Hong Kong, China.
The large building datasets are characterized by larger ground objects, stronger textures, and more regular buildings. The proposed method can recover the details well, producing small difference between the generated building details and the original image. Moreover, the values of evaluation metrics are higher than the small building complex dataset and natural environment dataset. It can be concluded that the SGDPRN is good at processing regular artificial pattern data with strong textures.
4.4.2. Results on small building complex
The small building complex datasets cover a greater dense level of ground feature information than the other datasets, which makes it difficult for super-resolution reconstruction to achieve the expected performance. However, SGDPRN still achieves the best results among the compared methods. presents the quantitative metric data for this dataset. In the PSNR and SSIM results, SGDPRN improved over the suboptimal SSPSR by 0.486 dB and 0.001 respectively over the suboptimal SGARDN. However, it achieved a batter improvement in the SAM metric, which increased by 0.737. For the visual contrast of small architectural complexes, we selected two architectural domains with relatively obvious boundary information to highlight the spatial distinction. As seen from the marked red rectangle in , the gap boundaries reconstructed by Bicubic, SRCNN, and SSPSR are blurred, while the gap reconstructed by the proposed SGDPRN is closest to the ground-truth value. The proposed SGDPRN is always able to recover more detailed edge structure information in the zoomed image and obtain better spatial enhancement. shows the reconstructed spectral curves of a randomly separately selected pixel in the two scenes of . From this it can be seen that the proposed method still maintains optimal results with higher spectral fidelity than the comparison method.
Figure 7. Visualization results for the small building complex dataset. (a) Shanghai, China and (b) Hong Kong, China.
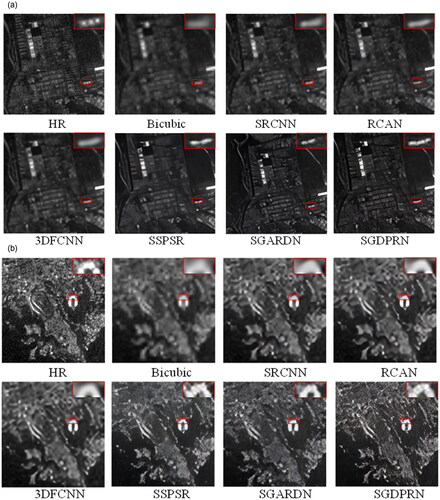
Figure 8. Spectral profiles of various methods on the small building complex dataset. (a) The mouth of the Yellow River and (b) Haikou, Hainan Province.
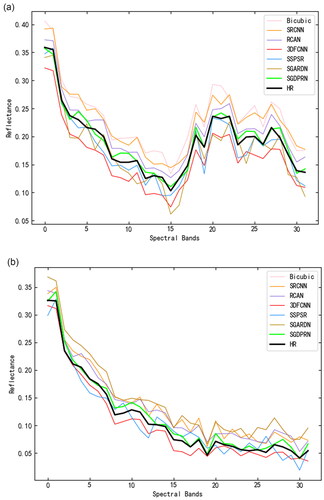
Table 3. Quantitative comparison of different methods for small building complex datasets.
The small building complex dataset is characterized by a large density of features lacking detailed information. The proposed method does not extract as much detailed texture information, and the edge information of the reconstructed image is not sharp enough. However, better results are achieved in the comparison methods. So the proposed method is not advantageous in dealing with image data lacking detailed information.
4.4.3. Results on the natural environment
The natural environment dataset mainly includes various vegetation-covered lands and irregular rivers and lakes. The low spatial resolution and dense vegetation-covered areas make the resolution reconstruction more difficult. The super-resolution reconstruction of large targets such as estuaries is relatively simple. lists the average quantitative results of different methods for the test set on this dataset. As shown in , the SGDPRN method in this paper obtains the best value in PSNR, SAM, and other indicators except for the CC metric, which is superior to other methods. Since SGDPRN can effectively use spatial information and spectral features for reconstruction, the SAM metric improves the most among the various metrics, with an 9.7% improvement over the suboptimal method. From the red rectangle in , the proposed SGDPRN has advantages in recovering irregular natural structure information and surrounding details. In , the red rectangle of the proposed method remains the clearest is still the clearest, which further verifies the effectiveness of the proposed method. At the same time, other comparison methods are not sufficiently clear in the reconstruction of edge information, and there is an obvious visual gap with the method in this paper. To verify the spectral preservation ability of the reconstructed HSI, shows the spectral curve of a pixel randomly separately selected from the two scenes in in the reconstructed HSI. The spectral curve reconstructed by this method is superior to other algorithms.
Figure 9. Visualization results for the natural environment dataset. (a) The mouth of the Yellow River and (b) Haikou, Hainan Province.
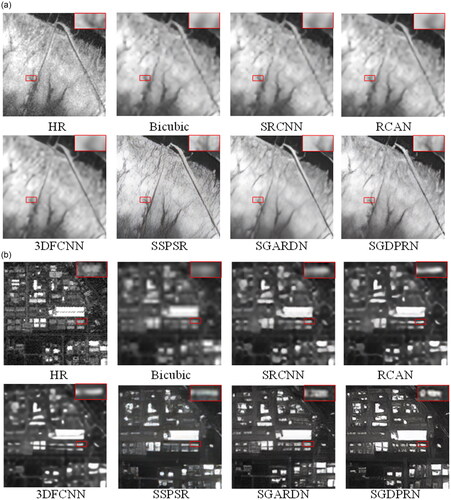
Figure 10. Spectral profiles of various methods on the natural environment dataset. (a) Number of model parameters and reconstruction performance and (b) Model runtime and reconstruction performance.
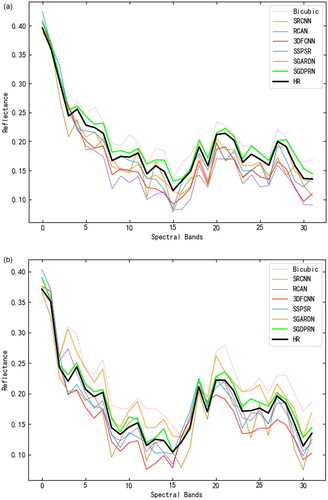
Table 4. Quantitative comparison of different methods for natural environment datasets.
The natural environment dataset is characterized by more farmland, fewer buildings, and relatively simple textures. Comparing the large building and small building complex datasets, it can be seen that the evaluation metrics on the natural environment dataset achieve suboptimal results. It indicates that the proposed method has better reconstruction performance in dealing with irregular natural pattern data.
4.5. Model size and runtime
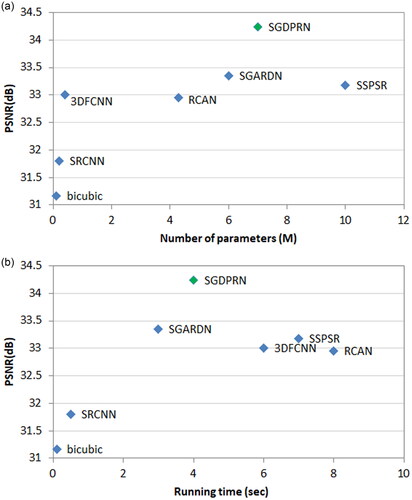
As shown in , SGDPRN (the proposed method) achieves the highest PSNR. Although the SRCNN and bicubic require fewer parameters and take a shorter running time, the reconstruction results are poor. Besides, the model size of 3DFCNN and RCAN are smaller than SGDPRN, but the runtime is longer. This is because the 3 D convolutional module in 3DFCNN takes more computing time than SGDPRN (2 D), and the long-hop and short-hop connections in RCAN also need more running time. Also, SSPSR needs more parameters and longer runtime than SGDPRN. Oppositely, the SGARDN needs fewer parameters and shorter runtime, but produces lower PSNR. According to the above, considering the model size and running time, SGDPRN performed better than the other methods in HSISR.
Figure 11. Reconstruction performance of different methods. (a) relationship between the PSNR and the number of model parameters. (b) relationship between the PSNR and the model running time.
4.6. Ablation experiments
The article conducted ablation experiments to verify the importance of each component of the proposed framework. shows the results of the ablation study, and the best results are shown in bold. Compared with SGDPRN, ① the SGDPRN-NSCGB replaces SCGB with an ordinary convolution layer with a similar number of parameters and without spectral grouping, and the other parameters remain unchanged. ② The SGDPRN-AG8 represents for SGDPRN without SRF bootstrap and the 32 spectral bands are divided equally into 8 groups while keeping the other parameters constant. Similarly, ③ SGDPRN-NSSPB replaces the original spatial-spectral dual path network of SGDPRN with a single path network where the spatial path is in front of the spectral path. The other network parameters remain unchanged. ④ SGDPRN-NBRB replaces BRB with the same number of residual convolution blocks and uses the same size 3 × 3 convolution. ⑤ SGDPRN-NCAM removed all the spectral attention modules in SGDPRN in the network. ⑥ SGDPRN-NFCAM only removes the spectral attention module (FCAM) from the final reconstruction part. All seven networks have the same loss function and upsampling section.
Table 5. Ablation study of the proposed modules on the large building dataset.
As we can see, the baseline (SGDPRN-NSCGB) has been rather successful, demonstrating that utilizing 3-D HSI as input rather than a succession of 2-D images allows the network to naturally learn spectral correlation and proves the efficiency of SSPB for exploring space-spectral features. We compared the experimental data of SGDPRN-NSCGB, SGDPRN-AG8, and SGDPRN groups. The SGDPRN without grouping was found to have the lowest evaluation index in the experiment, which may be caused by the spectral distortion between the whole spectral bands. The SGDPRN with spectral bands averaged into 8 groups obtained an improvement compared to SGDPRN-NSCGB because the averaging grouping method avoids the spectral distortion of the whole spectral bands. SGDPRN achieved the best results in these three networks (SGDPRN-NSCGB, SGDPRN-AG8, and SGDPRN), especially in maintaining the spectral coherence. Because the spectral response function can provide the spectral correlation between HSI bands from an imaging perspective, allowing bands with spectral correlation to be grouped. By comparing the evaluation metrics of the SGDPRN-NSSPB network and the SGDPRN network, we can see that the SGDPRN network outperforms the SGDPRN-NSSPB network in all evaluation metrics. The way that spatial and spectral features are extracted separately in two paths enables the full integration of spatial and spectral information at the same level compared to the way that spatial information is extracted first and then spectral information is extracted. Thus, it can be demonstrated that the dual-path extraction approach can improve the reconstruction performance and better preserve the spectral properties of hyperspectral images. According to the above, SGDPRN in the reconstruction of hyperspectral images performed better than the other ablation experimental models, demonstrating the importance of each component.
5 Conclusion
In this study, a SRF guided SGDPRN method is proposed to improve the spatial resolution of hyperspectral remote sensing images. Considering the characteristic that spectral bands are correlated, we apply a strategy of SRF guided grouping, dual path feature extraction of spatial-spectral information, and spectral dimensional attention mechanism is used to alleviate spectral confusion and reduce the difficulty of feature extraction and reconstruction. In particular, we propose the SSPB to enhance the fusion of same-level information, with the spatial branch responsible for extracting diverse and refined spatial features, and the spectral branch responsible for adaptively recalibrating the feature response in the spectral band using the interdependencies between feature mappings. A series of ablation analyses verifies the effectiveness of each part of the proposed method in terms of spatial resolution enhancement and spectral coherence. The experimental results show that the proposed SGDPRN outperforms the comparison method in terms of quantitative metrics and visual effects. Overall, SGDPRN can reconstruct realistic textures and maintain spectral band correlation in hyperspectral remote sensing image super-resolution reconstruction work. In future work, we will focus on how to exploit the spectral response function in greater depth to obtain better super-resolution reconstruction performance of hyperspectral images.
Author contributions
All of the authors made significant contributions to the manuscript. Y.X. designed the research framework and wrote the manuscript. Y.S. and X.Z. supervised the framework design and analyzed the results. J.Y. assisted in the preparation work and the formal analysis. X.J. also assisted in the formal analysis and reviewed the manuscript. All of the authors contributed to the editing and review of the manuscript.
Acknowledgement
Special thanks to colleagues and reviewers for their constructive comments and valuable suggestions that improved this paper substantially.
Data availability statement
Some or all data, models, or code generated or used during the study are available from the corresponding author by request.
Disclosure statement
No potential conflict of interest was reported by the authors.
Additional information
Funding
References
- Akgun T, Altunbasak Y, Mersereau RM. 2005. Super-resolution reconstruction of hyperspectral images. IEEE Trans Image Process. 14(11):1860–1875.
- Arun PV, Buddhiraju KM, Porwal A, Chanussot J. 2020. Cnn based spectral super-resolution of remote sensing images. Signal Proces. 169:107394.
- Chen Y, Liu L, Phonevilay V, Gu K, Xia R, Xie J, Zhang Q, Yang K. 2021. Image super-resolution reconstruction based on feature map attention mechanism. Appl Intell. 51(7):4367–4380.
- Chen Y, Xu L, Fang Y, Peng J, Yang W, Wong A, Clausi DA. 2020a. Unsupervised bayesian subpixel mapping of hyperspectral imagery based on band-weighted discrete spectral mixture model and markov random field. IEEE Geosci Remote Sens Lett. 18(1):162–166.
- Chen J, Zhu Q, Zhong Y, Guan Q, Zhang L, Li D. 2020b. Urban scenes change detection based on multi-scale irregular bag of visual features for high spatial resolution imagery. In IGARSS 2020-2020 IEEE International Geoscience and Remote Sensing Symposium, IEEE, p. 1197–1200.
- Dian R, Li S. 2019. Hyperspectral image super-resolution via subspace-based low tensor multi-rank regularization. IEEE Trans on Image Process. 28(10):5135–5146.
- Dian R, Li S, Guo A, Fang L. 2018. Deep hyperspectral image sharpening. IEEE Trans Neural Netw Learn Syst. 29(11):5345–5355.
- Dian R, Li S, Kang X. 2021. Regularizing hyperspectral and multispectral image fusion by cnn denoiser. IEEE Trans Neural Netw Learn Syst. 32(3):1124–1135.
- Dong X, Sun X, Jia X, Xi Z, Gao L, Zhang B. 2021. Remote sensing image super-resolution using novel dense-sampling networks. IEEE Trans Geosci Remote Sens. 59(2):1618–1633.
- Dong C, Loy CC, He K, Tang X. 2014. Learning a deep convolutional network for image super-resolution. in: European conference on computer vision, Springer, pp. 184–199.
- Dou X, Li C, Shi Q, Liu M. 2020. Super-resolution for hyperspectral remote sensing images based on the 3d attention-srgan network. Remote Sens. 12(7):1204.
- Galliani S, Lanaras C, Marmanis D, Baltsavias E, Schindler K. 2017. Learned spectral super-resolution, arXiv preprint arXiv:1703.09470.
- Gong M, Duan Y, Li H. 2020. Group self-paced learning with a time-varying regularizer for unsupervised change detection. IEEE Trans Geosci Remote Sens. 58(4):2481–2493.
- Hang R, Li Z, Liu Q, Bhattacharyya SS. 2020. Prinet: a prior driven spectral super-resolution network. in 2020 IEEE International Conference on Multimedia and Expo (ICME), IEEE, pp. 1–6.
- He K, Zhang X, Ren S, Sun J. 2016. Deep residual learning for image recognition. in Proceedings of the IEEE Conference on Computer Vision and Pattern Recognition, p. 770–778.
- Huang G, Liu Z, Van Der Maaten L, Weinberger KQ. 2017. Densely connected convolutional networks. in: Proceedings of the IEEE Conference on Computer Vision and Pattern Recognition, p. 4700–4708.
- Hu J, Li Y, Xie W. 2017. Hyperspectral image super-resolution by spectral difference learning and spatial error correction. IEEE Geosci Remote Sens Lett. 14(10):1825–1829.
- Hu J, Tang Y, Fan S. 2020. Hyperspectral image super resolution based on multiscale feature fusion and aggregation network with 3-d convolution. IEEE J Sel Top Appl Earth Observ Remote Sens. 13:5180–5193.
- Jiang J, Sun H, Liu X, Ma J. 2020. Learning spatial-spectral prior for super-resolution of hyperspectral imagery. IEEE Trans Comput Imaging. 6:1082–1096.
- Jiang D, Zhang S, Dai L, et al. 2022. Multi-scale generative adversarial network for image super-resolution. Soft Comput. 26(8):3631–3641.
- Khan MJ, Khan HS, Yousaf A, Khurshid K, Abbas A. 2018. Modern trends in hyperspectral image analysis: a review. IEEE Access. 6:14118–14129.
- Kwan C, Choi JH, Chan SH, Zhou J, Budavari B. 2018. A super-resolution and fusion approach to enhancing hyperspectral images. Remote Sens. 10(9):1416.
- Lanaras C, Baltsavias E, Schindler K. 2015. Hyperspectral super-resolution by coupled spectral unmixing. in Proceedings of the IEEE International Conference on Computer Vision, p. 3586–3594.
- Lan R, Sun L, Liu Z, Lu H, Pang C, Luo X. 2021. Madnet: a fast and lightweight network for single-image super resolution. IEEE Trans Cybern. 51(3):1443–1453.
- Lan R, Sun L, Liu Z, Lu H, Su Z, Pang C, Luo X. 2021. Cascading and enhanced residual networks for accurate single-image super-resolution. IEEE Trans Cybern. 51(1):115–125.
- Li J, Cui R, Li B, Song R, Li Y, Du Q. 2019. Hyperspectral image super-resolution with 1d–2d attentional convolutional neural network. Remote Sens. 11(23):2859.
- Li B, Dai Y, He M. 2018. Monocular depth estimation with hierarchical fusion of dilated cnns and soft-weighted-sum inference. Pattern Recogn. 83:328–339.
- Li S, Dian R, Fang L, Bioucas-Dias JM. 2018. Fusing hyperspectral and multispectral images via coupled sparse tensor factorization. IEEE Trans on Image Process. 27(8):4118–4130.
- Li Y, Du Z, Wu S, Wang Y, Wang Z, Zhao X, Zhang F. 2021. Progressive split-merge super resolution for hyperspectral imagery with group attention and gradient guidance. ISPRS J Photogram Remote Sens. 182:14–36.
- Liu D, Li J, Yuan Q. 2021. A spectral grouping and attention-driven residual dense network for hyperspectral image super-resolution. IEEE Trans Geosci Remote Sens. 59(9):7711–7725.
- Liu B, Yu X, Zhang P, Tan X, Wang R, Zhi L. 2018. Spectral–spatial classification of hyperspectral image using three-dimensional convolution network. J Appl Remote Sens. 12:016005.
- Li Q, Wang Q, Li X. 2021. Exploring the relationship between 2d/3d convolution for hyperspectral image super-resolution. IEEE Trans Geosci Remote Sens. 59(10):8693–8703.
- Li J, Wu C, Song R, Xie W, Ge C, Li B, Li Y. 2021. Hybrid 2-d–3-d deep residual attentional network with structure tensor constraints for spectral super-resolution of rgb images. IEEE Trans Geosci Remote Sens. 59(3):2321–2335.
- Lu X, Yang D, Zhang J, Jia F. 2021. Hyperspectral image super-resolution based on spatial correlation-regularized unmixing convolutional neural network. Remote Sens. 13(20):4074.
- Luo X, Yin J, Luo X, Jia X. 2019. A novel adversarial based hyperspectral and multispectral image fusion. Remote Sens. 11(5):492.
- Mei S, Jiang R, Li X, Du Q. 2020. Spatial and spectral joint super-resolution using convolutional neural network. IEEE Trans Geosci Remote Sens. 58(7):4590–4603.
- Mei S, Yuan X, Ji J, Zhang Y, Wan S, Du Q. 2017. Hyperspectral image spatial super-resolution via 3d full convolutional neural network. Remote Sens. 9(11):1139.
- Obukhov A, Rakhuba M, Liniger A, Huang Z, Georgoulis S, Dai D, Van Gool L. 2021. Spectral tensor train parameterization of deep learning layers. in International Conference on Artificial Intelligence and Statistics, PMLR, p. 3547–3555.
- Paul S, Kumar DN. 2021. Transformation of multispectral data to quasi-hyperspectral data using convolutional neural network regression. IEEE Trans Geosci Remote Sens. 59(4):3352–3368.
- Qu J, Lei J, Li Y, Dong W, Zeng Z, Chen D. 2018. Structure tensor-based algorithm for hyperspectral and panchromatic images fusion. Remote Sens. 10(3):373.
- Qu J, Xu Y, Dong W, Li Y, Du Q. 2022. Dual-branch difference amplification graph convolutional network for hyperspectral image change detection. IEEE Trans Geosci Remote Sens. 60:1–12.
- Wan W, Guo W, Huang H, Liu J. 2020. Nonnegative and nonlocal sparse tensor factorization-based hyperspectral image super-resolution. IEEE Trans Geosci Remote Sens. 58(12):8384–8394.
- Wang Y, Chen X, Han Z, He S. 2017. Hyperspectral image super-resolution via nonlocal low-rank tensor approximation and total variation regularization. Remote Sens. 9(12):1286.
- Wang Z, Chen J, Hoi SC. 2021. Deep learning for image super-resolution: a survey. IEEE Trans Pattern Anal Mach Intell. 43(10):3365–3387.
- Wang X, Ma J, Jiang J. 2022. Hyperspectral image super-resolution via recurrent feedback embedding and spatial–spectral consistency regularization. IEEE Trans Geosci Remote Sens. 60:1–13.
- Xie W, Jia X, Li Y, Lei J. 2019. Hyperspectral image super-resolution using deep feature matrix factorization. IEEE Trans Geosci Remote Sens. 57(8):6055–6067.
- Yan L, Wang X, Zhao M, Kaloorazi M, Chen J, Rahardja S. 2020. Reconstruction of hyperspectral data from rgb images with prior category information. IEEE Trans Comput Imaging. 6:1070–1081.
- Yang Y, Qi Y. 2021. Image super-resolution via channel attention and spatial graph convolutional network. Pattern Recogn. 112:107798.
- Yang J, Zhao Y-Q, Chan JC-W, Xiao L. 2019. A multi-scale wavelet 3d-cnn for hyperspectral image super-resolution. Remote Sens. 11(13):1557.
- Yuan Y, Zheng X, Lu X. 2017. Hyperspectral image superresolution by transfer learning. IEEE J Sel Top Appl Earth Observ Remote Sens. 10(5):1963–1974.
- Zhang Y, Li K, Li K, Wang L, Zhong B, Fu Y. 2018. Image super-resolution using very deep residual channel attention networks. in Proceedings of the European Conference on Computer Vision (ECCV), p. 286–301.
- Zhang W, Li X, Zhao L. 2018. A fast hyperspectral feature selection method based on band correlation analysis. IEEE Geosci Remote Sens Lett. 15(11):1750–1754.
- Zhang D, Shao J, Li X, Shen HT. 2021. Remote sensing image super-resolution via mixed high-order attention network. IEEE Trans Geosci Remote Sens. 59(6):5183–5196.
- Zhang L, Zhang L. 2022. Artificial intelligence for remote sensing data analysis: a review of challenges and opportunities. IEEE Geosci Remote Sens Mag. 10(2):270–294.
- Zhao M, Ning J, Hu J, Li T. 2021. Hyperspectral image super-resolution under the guidance of deep gradient information. Remote Sens. 13(12):2382.
- Zheng X, Yuan Y, Lu X. 2017. Dimensionality reduction by spatial–spectral preservation in selected bands. IEEE Trans Geosci Remote Sens. 55(9):5185–5197.
- Zhi L, Yu X, Liu B, Wei X. 2019. A dense convolutional neural network for hyperspectral image classification. Remote Sens Lett. 10(1):59–66.
- Zhu Q, Deng W, Zheng Z, Zhong Y, Guan Q, Lin W, Zhang L, Li D. 2021b. A spectral-spatial-dependent global learning framework for insufficient and imbalanced hyperspectral image classification. IEEE Trans Cybern. 52(11):11709–11723.
- Zhu Q, Guo X, Deng W, Shi S, Guan Q, Zhong Y, Zhang L, Li D. 2022b. Land-use/land-cover change detection based on a siamese global learning framework for high spatial resolution remote sensing imagery. ISPRS J Photogram Remote Sens. 184:63–78.
- Zhu Q, Sun Y, Guan Q, Wang L, Lin W. 2022a. A weakly pseudo-supervised decorrelated subdomain adaptation framework for cross-domain land-use classification. IEEE Trans Geosci Remote Sens. 60:1–13.
- Zhu Q, Wang L, Chen J, Zeng W, Zhong Y, Guan Q, Yang Z. 2021a. S 3 trm: spectral-spatial unmixing of hyperspectral imagery based on sparse topic relaxation-clustering model. IEEE Trans Geosci Remote Sens. 60:1–13.