
 ?Mathematical formulae have been encoded as MathML and are displayed in this HTML version using MathJax in order to improve their display. Uncheck the box to turn MathJax off. This feature requires Javascript. Click on a formula to zoom.
Abstract
The concern about the recurrence of land subsidence has arisen in Japan with urban development and new groundwater use. Land subsidence observation well has been utilized for monitoring the subsidence, but due to the recent aging of facilities and equipment, remote sensing technology is attracting attention. This paper seeks to assess the substitutability of Consecutive DInSAR with the land subsidence observation well. To investigate the subsidence in Kanagawa prefecture, Sentinel 1 images from August 2017 to March 2022 were analyzed by SARPROZ software based on Consecutive DInSAR, Global Navigation Satellite System (GNSS), and land subsidence observation well methods. Moreover, we assessed the new calculation model between land surface pressure and ground water called the law of material conservation to estimate land subsidence. The results revealed that the Consecutive DInSAR results agreed with the land subsidence observation well data, indicating the possibility of future substitution.
1. Introduction
Land subsidence caused mainly by human activities is a serious problem worldwide (Castellazzi et al. Citation2017, Herrera-García et al. Citation2021, Figueroa-Miranda et al. Citation2018, Lanari et al. Citation2004, Normand and Heggy Citation2015, Chen et al. Citation2021). Anthropogenic subsidence is mainly caused by the depletion of ground water (Herrera-García et al. Citation2021, Chen et al. Citation2021). Continued ground water extraction beyond the natural recharge limit leads to low ground water levels, seawater intrusion, ground water quality deterioration, land subsidence, poor drainage, and flooding (Chen et al. Citation2021). Currently, land subsidence occurs mainly in regions of flat terrain where loose deposits accumulate in river deltas or coastal plains, and highly populated areas (Higgins Citation2016, Ma et al. Citation2019, Zhang et al. Citation2019). Nineteen percent of the global population may face a high probability of subsidence and the potential subsidence may affect 635 million inhabitants living in flood-prone areas in 2040 (Herrera-García et al. Citation2021).
Japan is no exception to this problem, and land subsidence has caused enormous physical and economic damage and has become a major social problem (Land subsidence Citation2020). Representatively, the Keihin industrial zone including Yokohama city, one of the leading industrial areas in Japan, had land subsidence disasters caused by excessive ground water extraction for urban development in many places (NGED Citation2022). The largest amount of land subsidence between 1950 and 1953 reached about 20 cm (Land subsidence Citation2020a). Also, unequal subsidence caused various problems such as the tilting of buildings and structures, changes in the gradient of railway lines, and the inability to drain water in the densely populated industrial areas near coastal landfills (Land subsidence Citation2022a). Afterward, the Industrial Water Act and regulations on ground water extraction were enacted to prevent land subsidence, and continuous effort was made to mitigate and adapt to the land subsidence. As a result, the problem has been calmed down for a while (Land subsidence Citation2020). However, in recent years, global warming caused by climate change has led to an increase in abnormally low rainfall and a decrease in rainy days, and the concern about the recurrence of land subsidence has arisen due to an increase in ground water use associated with the droughts. Land subsidence increases the risk of water disasters, such as floods and storm surge inundation, and increased inland seawater intrusion (Marfai and King Citation2007). It also badly affects the quality of the living environment (e.g. healthcare and sanitation conditions) and (social and economic) life (Abidin et al. Citation2013). In addition, there are new needs for ground water use, such as ground water use for disaster events and geothermal heat as an energy-saving and CO2-saving technology in Japan (Land subsidence Citation2022a). Therefore, in densely populated urban areas of Japan, it is necessary to conserve ground water by monitoring ground changes continuously and precisely to prevent the recurrence of land subsidence.
For land subsidence monitoring, there are several geodetic methods, such as leveling, GNSS surveys, and the InSAR technique (Chen et al. Citation2021). In the case of Japan, leveling and land subsidence observation wells have been utilized for monitoring subsidence (Land subsidence Citation2022b). Leveling measures the land surface height annually, and land subsidence observation well measures stratum shrinkage and ground water level change every few months. In areas that have previously suffered from land subsidence or weak geology areas, extensive detailed observation is important. GNSS is capable of extensive measurements because it is installed in around 1,300 locations throughout Japan, but its observation has errors due to the effects of the atmosphere and ionosphere. Also, GNSS is not located in areas that have previously suffered from land subsidence or weak geology areas because its aim is monitoring crustal movements. From these factors, the land subsidence observation well has been utilized as an essential tool that can grasp the minute ground fluctuation in Japan. However, in recent years, maintaining data accuracy is difficult due to the aging of this equipment and facilities and also carrying out periodic observation and maintenance is tough due to budgetary constraints. Also, there is a concern about the lack of specialized engineers for land subsidence observation wells due to the low birthrate and aging population. Therefore, the Interferometric SAR (InSAR) technique, which can observe the land surface periodically and precisely over a wide area, is attracting attention as an alternative with it. The InSAR technique is the method of retrieving relative displacements from two satellite SAR images by exploiting the phase of the signal. It can observe slight changes in the ground surface by millimeters regardless of weather or day and night. Among the InSAR techniques, the Consecutive DInSAR technique is particularly expected because it can quantify the land deformation (subsidence and uplift) over a wide range with high accuracy regardless of location (Nishi et al. Citation2021). It has been confirmed that land surface displacement can be measured in Bandung (Sumantyo et al. Citation2012) and Kanagawa (Nishi et al. Citation2021, Nishi et al. Citation2022) using this technique with an accuracy of several mm to cm.
Previous studies have used GNSS data to verify the effectiveness of the InSAR technique for land surface observation, such as Mexico City (Sower et al. 2016, Osmano et al. Citation2011, Foroughnia et al. Citation2019), Tehran (Mahmoudpour et al. Citation2013, Nonaka et al. Citation2020), Kanto area (Ishitsuka and Matsuoka Citation2016, Basic Policy Citation2021, Basic plan Citation2022), and Semarang (Marfai and King Citation2007, Abidin et al. Citation2013). Also, the study of the comparison of the InSAR technique with groundwater change for identifying the cause of the land surface change was conducted in the previous literature (Abidin et al. Citation2013, Yakista et al. Citation2017, Qin et al. Citation2018, Agarwal et al. Citation2021, Orhan Citation2021). However, no studies have been conducted to compare the InSAR method with the land subsidence observation well for examining the possibility of future substitution, which is a novelty. The accuracy of land subsidence observation data (land subsidence data) is higher than GNSS data at ± 0.1 mm, but the observation stations are limited nationwide in Japan. If the Consecutive DInSAR technique can be replaced by the land subsidence observation well, it could be used as a primary tool for monitoring land subsidence over a wide area. Also, we developed a new calculation model between ground surface pressure and ground water called the law of material conservation to estimate the land subsidence and assessed it to analyze the land deformation in observation points. In short, in this study, the Consecutive DInSAR results were compared with the land subsidence observation well data and examined the possibility of future substitution based on the law of material conservation, which is an original and new initiative.
The study area is Kanagawa prefecture (Yokohama, Yokosuka, and Miura cities), and only Yokohama city among them have land subsidence observation well. The research process is first verifying the accuracy of the Consecutive DInSAR method using GNSS data in Kanagawa prefecture, and then examining the substitutability of the Consecutive DInSAR technique with the land subsidence observation well in Yokohama city. Land subsidence observation well can measure the strata shrinkage with high accuracy, but it is not yet clear whether the strata shrinkage is the same as the amount of land surface deformation. In this study, assuming that the stratum shrinkage is a prima facie true data, the Consecutive DInSAR results were compared with the land subsidence data. If the Consecutive DInSAR results are consistent with the land subsidence data, the possibility of substitution of the Consecutive DInSAR technique with the land subsidence observation well is indicated in the future.
Comprehensive information on the characteristics of land subsidence can apply to several important planning and mitigation efforts, including effective control of coastal and river basin inundation, space-based ground water extraction regulations, environmental protection, infrastructure design and construction, and spatial development planning (Abidin et al. Citation2013). Also, as a new trend in technologies, digital transformation is required in various fields, and the utilization of SAR interference techniques and GIS technology is being promoted for operational efficiency and automation (labor saving) in government and private sectors (Nishi et al. Citation2022, Navarro-Hernández et al. Citation2020). These technologies will be increasingly used for actual disaster response and conventional environmental change measurements in the future.
This research results are assessing the Consecutive DInSAR technique as the alternative for land subsidence observation wells. Based on the importance of land subsidence information supporting urban development activities, monitoring and investigation of the land subsidence phenomenon should be systematically carried out. These research results are expected to provide useful information for city planners and decision-makers of future city planning and disaster risk management by utilizing space technology.
2. Materials and methods
This study referenced the Sentinel −1 images, GNSS measurement data, and the entire study area from the former study (Nishi et al. Citation2021).
2.1. Study area
2.1.1. Location and geological information
This study consists of the following two areas shown in . The first is the area of GNSS stations (G1 to G3) in Yokohama City, Yokosuka City, and Miura City as shown in . Here, we compared the Consecutive DInSAR results with GNSS data for ensuring the accuracy of the Consecutive DInSAR method. These cities have different locations and geographical conditions, so if we can obtain good research results from the study, the widespread use of the Consecutive DInSAR method is expected in the future. The second is the area of six land subsidence observation points (W1 to W7 (except W5)) in Yokohama city as shown in . Here, we compared the Consecutive DInSAR results with the land subsidence data.
Figure 1. Study area in Kanagawa prefecture.
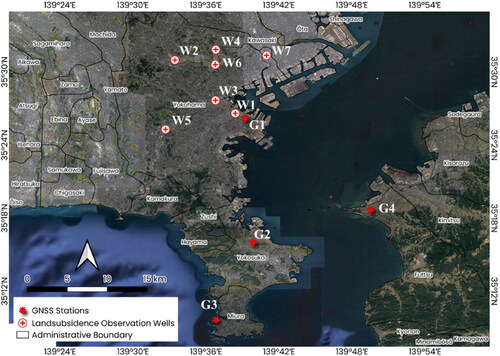
Table 1. Location data of GNSS control points used in the research (Nishi et al. Citation2021).
Table 2. Land subsidence observation wells in Yokohama city (Land subsidence Citation2022c).
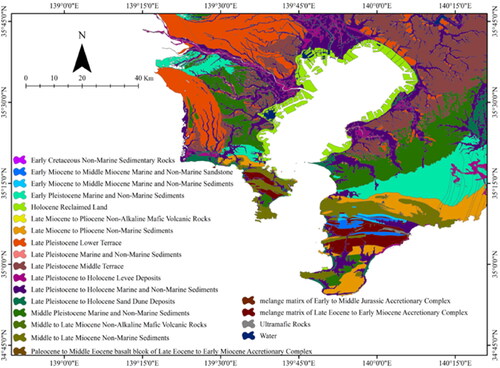
The Keihin industrial area including Yokohama city is now the center of economic activity with many commercial buildings and residences concentrated (Nishi et al. Citation2021, Citation2022). The topography of this area is plateaus and hills, with narrow alluvial plains along the Tama River and Tsurumi River, which open up the reclaimed land on the coast. The plateau and hills consist of the Kazusa group from the Pliocene to the early Pleistocene and the Sagami Group from the Middle Pleistocene to the late Pleistocene. The Alluvium that fills these open valleys is soft sediment composed of sand, silt, and clay, with a thickness of 20 ∼ 50 m. Thin sands and gravel layers are distributed in the lower part. The geology of Yokohama City can be further classified by the area of the observation point (Land Properties Citation2022, Yokohama Citation2022). Yokohama (park) and Okano observation points (W1, W3) are located in the coastal lowland , which is a flat surface with low altitude distributed along the Tokyo Bay coast. The ground is soft with loose sand and soft silt distributed in the upper part. The Saedo observation points (W2) are a valley bottom lowland in the river basin. The ground is soft with high-moisture organic silt and clay silt densely distributed. The Nippa observation point (W4) is a hinterland wetland. It is soft ground with clay, silt, and organic soil accumulated in it. The Shin-Yokohama observation point (W6) is a natural embankment. The ground is stable, but soft silt and buried soil are accumulated on the upper part.
The ground water amount collected in Yokohama city was about 9,916 m3/day in 2019, of which most was used for industrial purposes, school pools, sprinklers, and securing for disaster, not use for agriculture (Land subsidence Citation2022d). However, industrial water in Yokohama city uses water from a dam lake, which contributes to preventing land subsidence due to the excessive pumping of ground water in industrial areas (Industrial water Citation2022).
Yokosuka city occupies most of the Miura Peninsula in the south-eastern part of Kanagawa prefecture, which is composed of many mountains, hills, and a few plains (Nishi et al. Citation2021, Nishi et al. Citation2022). It consists of the stable Zushi Formation of the Miura Group deposited from the late Miocene to the late Pliocene. The Zushi Formation consists mainly of alternating layers of mudstone and sandstone and thin layers of tuff, and the base is accompanied by tuffaceous sandstone and conglomerate. Miura City is located at the southernmost tip of the Miura Peninsula, which is surrounded by plateaus with elevations ranging from 40 m to 60 m and Tokyo Bay and Sagami Bay. The geology is a loam plateau made of volcanic ash clay at the top of the Miura Group, consisting of siltstone and scoria. The ground is stable with the loam soil, siltstone, and scoria of the Miura Group of low permeability ().
Figure 2. Geology map in Kanagawa prefecture (Nishi et al. Citation2021).
2.1.2. Precipitation and temperature
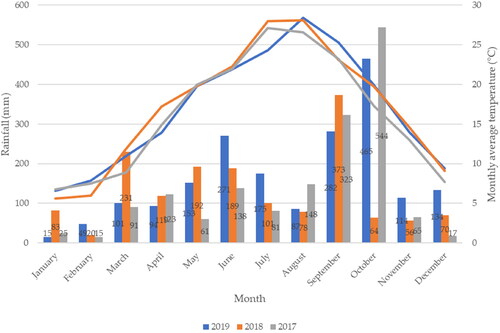
The distribution of precipitation intensity from 2017 to 2019 in Kanagawa prefecture is shown in . Generally, the precipitation of Japan is highly variable from season to season and is concentrated in the rainy season from May to June and the typhoon season from September to October. Statistically, precipitation is low from January to March of winter, but increases in May to June called “Tsuyu” (rainy season) decreases in summer, and again increases in September to October. Also, the temperature is low in winter from January to March, but rises in the spring from April to June, with the highest summer temperature from July to September. After that, the temperature goes down as autumn comes. The maximum rainfall intensity recorded from 2017 to 2019 was 1,937 mm/year in 2017 and the minimum was 1,574 mm/year in 2018. In particular, the rainfall in October 2018 was 64 mm/month, which was considerably lower than in other years. Monthly precipitation intensity was highest in October 2017 (544 mm/month) and lowest in February 2017 and January 2019 (15 mm/month). The precipitation in 2018 was higher than in other years, especially in May and September. Finally, the mean daily high/low recorded in the study area reached 20.8 °C/13.5 °C.
Figure 3. The rainfall intensity distribution in Yokohama city from 2017 to 2019 (Precipitation Citation2022).
2.2. Materials
2.2.1. Satellite dataset
The satellite dataset of this study is consisted of nineteen Sentinel-1 data pairs in the descending orbit from August 17, 2017, to March 22, 2020, as shown in . The polarization of the data is VV (vertical transmit/receive), the incidence angle is 38.3°, and the tracking number is 46. Sentinel-1 is the C-band radar image of the Europe Space Agency (ESA) that is useful to better support a variety of areas such as marine monitoring, ground monitoring, and disaster response. Since the Sentinel-1 data is free-access for all users, it is highly practical for organizations with fiscal budget constraints, such as local governments to reduce cost and ensure continuous use. In this study, the observation interval was set at a few months for investigating land subsidence phenomena with gradual displacement, assuming the land displacement is constantly changed during the research period.
Table 3. Sentinel-1 C band data pairs (Nishi et al. Citation2021).
2.2.2. GNSS reference station
GNSS data was obtained from the GNSS Earth Observation Network System (GEONET) operated by the Geospatial Information Authority of Japan (GSI). GNSS reference stations are placed in approximately 1,300 locations at approximately 20 km intervals throughout Japan (Nishi et al. Citation2021). The GNSS data are relative coordinates from Tsukuba city as the reference point. GEONET uses ITRF2014 as a reference coordinate frame and analyze the daily coordinated value using Bernese Ver.5.2, which is an analysis software that is good at handling most error and biases including resolving phase ambiguity. The GNSS survey is performed by the most accurate static positioning method. It is applied to crustal movement detection, academic precision observation, and precipitation measurement, including InSAR research for the validation of SAR results (Ishitsuka and Matsuoka Citation2016, Nishi et al. Citation2022, Navarro-Hernández et al. Citation2020; Nonaka et al. Citation2020).
In this study, the following four GNSS points of Yokohama, Yokosuka, Miura, and Futtsu cities are adopted, which are indicated as G1, G2, G3, and G4 respectively as shown in . Futtsu city (G4) was used as the reference point considering its relatively stable location. In calculating the GNSS data, the average value for 11 days at each GNSS point, namely 5 days before and after the SAR observation date, was used to reduce the troposphere effect and the noise on the signal. Also, using the same type of receivers and also antenna types of GNSS instruments, the error of the antenna phase center and any other systematic error due to the device was reduced. Moreover, by adopting the common environmental condition of GNSS observation points that are in the same prefecture, the error by weather and temperature effects on GNSS results can be eliminated. In other words, such measurement conditions allow this study to consider only the effects of geology and topography for comparison of results. Finally, GNSS data are known to contain seasonal effects due to water vapor, summer growth of trees, and groundwater (Nishi et al. Citation2021). For the best acquisition of GNSS data, such effects must be reduced from the time series data. In this study, a moving average filter for the data on the time domain was applied to these data (Orhan Citation2021).
2.2.3. Land subsidence observation well
In Yokohama city, the monitoring of subsidence using a land subsidence observation well has stopped for a while, but it resumed in 2018 (Land subsidence Citation2022c) due to the concern about the recurrence of land subsidence due to the large-scale urban development and underground excavation work of the metropolitan expressway in recent years.
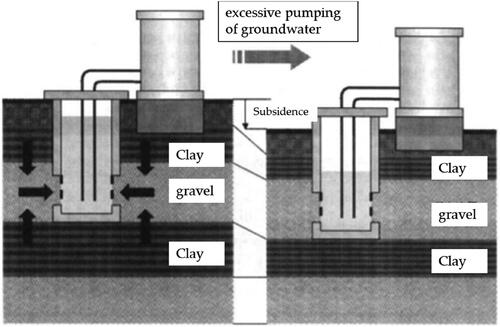
A land subsidence observation well is a facility for observing the amount of strata shrinkage from the bottom of the observation well to the ground surface (Land subsidence Citation2022c) to quickly grasp and predict the land subsidence tendency. The schematic diagram is shown in . Land subsidence observation well is classified into two types, namely single tube type and double tube type. Many observation points have adopted the single-tube type, but in the depths exceedingly approximately 100 m, the double-tube type has been adopted (Land subsidence 2021). The double tube type has a structure in which an inner tube is inserted into an outer tube installed underground with the lower end fixed to a gravel layer. When stratum shrinkage occurs between the bottom of the inner pipe bottom and the ground surface, the land subsidence amount can be instantaneously measured by the change of the inner pipe head escaping from the ground surface. The single-tube observation well has a simple double-tube structure in which the outer and inner tubes are integrated, which measures the subsidence amount by a single steel pipe. Land subsidence observation wells are used not only in Japan but also overseas, such as in Indonesia (Yokokura et al. Citation2019).
Figure 4. Illustration of land subsidence. Clay layers are being compressed (Modified (Tobita et al. Citation2004)).
As well as the above land subsidence observation wells, leveling is a major method for monitoring land deformation in Japan (Tobita et al. Citation2004). In the leveling process, the land displacement was measured from the difference in ground elevation at two observation points in time. However, it is not possible to grasp the detailed deformation because the observing interval is once a year and limited points. In this experiment, the leveling data of Yokohama city has many defects, so we cannot use the data. On the other hand, land subsidence observation well measures the stratum fluctuation (shrinkage and expansion) every few months (Land subsidence 2021). It is possible to determine the stratum fluctuation from the ground surface to the aquifer where the bottom of the land subsidence observation well is fixed. However, this measurement cannot grasp the ground fluctuation deeper than the bottom of land subsidence observation well in the stratum. This means that depending on the depth of the land subsidence observation well, the total layer shrinkage may not be captured.
In this study, a total of ten land subsidence observation points (W1 to W7) were used as shown in . Among the observation points, the Saedo and Shin-Yokohama have multiple depths for the measurement (W2-1 to W2-2, W6-1 to W6-3). The relative amounts of stratum shrinkage in the observation points (W1 to W6) were calculated from the Ichiba observatory (W7) as a reference point. Here we must note that the observation accuracy of the land subsidence well is as high as ± 0.1 mm. The land subsidence observation well cannot observe a ground fluctuation smaller than its accuracy, therefore, Akibacho (W5) was excluded from this study because of its low displacement. Also, the land subsidence data in Yokohama City have been available monthly, however, some months have missing data. Thus, we filled in the missing data from the preceding and following month, assuming the land is uniformly changed.
2.3. Method
2.3.1. Consecutive DInSAR technique
Consecutive DInSAR is a method for selecting a pair of small spatial baselines and short temporal baselines (master image and slave image) and alternately changing the master image and the slave image over a continuous period (Sumantyo et al. Citation2012, Nishi et al. Citation2021). In this technique, differential interferograms of adjacent SAR acquisitions are calculated and accumulated to provide complete time-series interferometric results (e.g. φ1-2, φ2-3, φ3-4,…, φn-1,n) (Pawluszek-Filipiak and Borkowski Citation2020). With the smaller spatial baselines and shorter temporal baselines, the continuous land deformation can be appropriately extracted while minimizing the effect of spatiotemporal interference (Nishi et al. Citation2022, Pawluszek-Filipiak and Borkowski Citation2020). Traditional InSAR methods are PSI-SAR and SBAS methods, which can track topographic changes in time series with high accuracy. However, since these methods extract pixels with high phase accuracy and eliminate pixels with low coherence (Tomokazu et al. Citation2018, Xu et al. Citation2022), high-precision land fluctuation observation cannot be performed in a wide range (Nishi et al. Citation2021, Xu et al. Citation2022). On the other hand, the Consecutive DInSAR method selects a small spatial and a short temporal baseline image pair, therefore it can suppress a decrease in spatial and temporal interference, and also possible to use pixels with low coherence that have been eliminated by these methods. Consecutive DInSAR method cuts pixels with very low coherence, but it sets a lower threshold compared to these methods, resulting in a wider range of available pixels. Thus, the Consecutive DInSAR method makes it possible to estimate land displacement over a wide range with high accuracy at the mm level (Nishi et al. Citation2022).
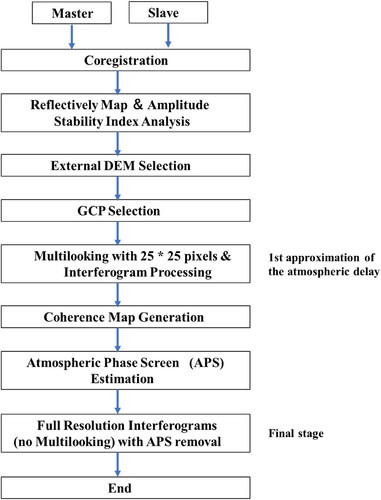
In this study, we obtained the mean velocity and time series displacement analyzed by the Consecutive DInSAR method using SARPROZ software (Nishi et al. Citation2021) and compared them with GNSS and land subsidence data. In the SARPROZ processing, we eliminated noise such as atmospheric error from SAR images for improving the detection capability of interferometric SAR. The flowchart of this process is shown in (Sumantyo et al. Citation2022). Assuming that long spatial wavelength is caused by atmospheric distortions, the 25 × 25 pixels of multi-looking was employed for the obtained interferogram to filter out the short wavelength. The multi-looked interferogram removed or suppressed most local signals and preserved long wavelengths. This interferogram was used as a first approximation of the atmospheric delay. Then we employed a coherence map and reload the processed interferogram by selecting the coherence as weight. The option of atmospheric phase screen (APS) estimation is a radius of 50 pixels. We assume the majority of the visible signal is an atmospheric delay in the process stage. The full resolution of the interferogram (no multi-looking) dataset was reloaded again. In the final stage of this process, we compared the original interferogram and multi-looked processed interferogram to remove the long wavelength and keep the information of land deformation. The measured Consecutive DInSAR data was converted to the vertical direction from the satellite line-of-sight (LOS) and then compared with the GNSS data and land subsidence data. The LOS displacement was estimated by averaging the land fluctuation quantity at 50 m around the GNSS points and land subsidence observation wells.
Figure 5. Flowchart of SARPROZ processing with APS removal.
In addition, Yokohama City measures the ground fluctuation in two consecutive periods using land subsidence observation well, and make this information available to the public. The measurement system is the same as the Consecutive DInSAR method, which is suitable for this study.
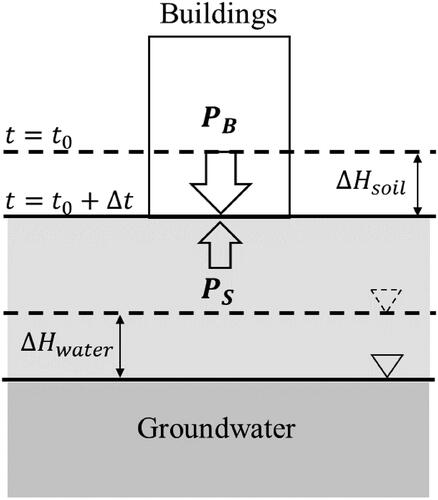
2.3.2. Proposed method: Laws of material conservation
We propose the continuity model of the law of conservation of material to estimate the land subsidence shown in . When the ground water is pumped out, the effective stress changes and often promotes irreversible consolidation. This reduces the total amount of silt and clay and lowers the ground surface. The stress on the soil when land subsidence occurs can be expressed by the following equation.
(1)
(1)
where
is the pressure from the building to the ground, and
is the pressure from the opposite side towards the buildings. If no subsidence occurs, P should be zero. Once buildings were constructed, their pressure remains strong in constant. Here, ignoring the change in
we can get the following.
(2)
(2)
where
is the pressure at a certain point on the surface. And
is a change of
at the point.
is equivalent to the effective stress of the volume change from the subsidence. Thus,
(3)
(3)
Where γ(r, t) is the bulk density at the point. When we can calculate a certain area, it is supposed that
(4)
(4)
Then we change the equation into an integral in volume using Gauss’s theorem as
(5)
(5)
We can calculate the pressure on the surface in the area of interest at a certain time during the subsidence period using this equation. Finally, the results can be calculated as follows:
(6)
(6)
This equation shows that the pressure on the surface is determined by the change in bulk density, which causes subsidence by changing the volume of the ground. However, the change in density is much smaller than the volume. When calculating large areas, we can ignore the change in bulk density. In this case, the pressure corresponds to the gravity of the volume of soil. Ground subsidence is caused by the loss of ground water. In this way,
(7)
(7)
where
and
are the density of soil and water. Therefore,
(8)
(8)
and
are the volume of soil and ground water. Using this equation, the ground water level change was estimated. In this paper, we calculated the results of mean satellite line-of-sight (LOS) velocity and time series displacement by using the displacement maps generated by the Consecutive DInSAR technique and compared the land subsidence observation well and GNSS data. Also, we analyzed the ground fluctuation phenomenon based on this model ().
Figure 6. Land surface pressure and ground water model.
3. Results
3.1. Subsidence rate for each observation point derived by the consecutive DInSAR method
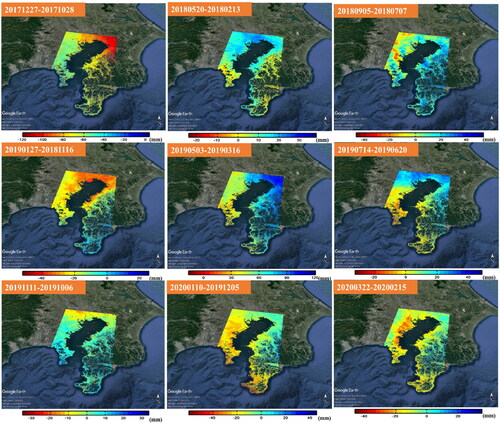
All pairs of have been processed, and the coherence, phase interferogram, phase filtering, phase unwrapping, and geocoding have been done by using SARPROZ. shows some examples of LOS displacement images obtained by SARPROZ. Here, the relative land displacement is indicated by color coding, where subsidence is indicated in red color and uplift is indicated in blue.
Figure 7. Examples of LOS displacement images.
and show the subsidence rate derived by Consecutive DInSAR, GNSS, and land subsidence data in each observation point derived from . shows the subsidence rates of Consecutive DInSAR and GNSS, and shows the subsidence rates of the Consecutive DInSAR and Landsubsidence observation well. In previous studies, consecutive DInSAR has allowed up to 2.3 cm/year error (Sumantyo et al. Citation2012, Nishi et al. Citation2021, Nishi et al. Citation2022), and these results are within that range, indicating we could obtain good results.
Table 4. Subsidence rate derived from Consecutive DInSAR and GNSS data.
Table 5. Subsidence rate derived from Consecutive DInSAR and Landsubsidence data.
3.2. Comparison between consecutive DInSAR results, and GNSS data
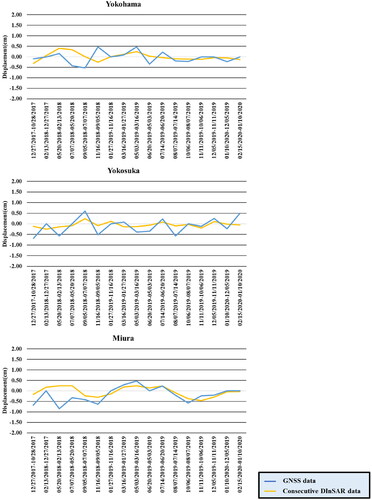
shows that the mean subsidence rate of GNSS data is around 0.12 cm/year and that of Consecutive DInSAR results is about 1.01 cm/year. The deviation between the two methods is around 0.90 cm/year, which is considered small. Here, we calculated the RMSE from the line graph of Consecutive DInSAR and the GNSS data. The comparison graph of both methods is shown in . The RMSEs were 0.33 cm/year for Yokohama city, 0.42 cm/year for Yokosuka city, and 0.42 cm/year for Miura city, which shows a good agreement. The mean RMSE was 0.39 cm/year. As a reference for comparison, previous studies using the InSAR technique and GNSS data for surface observations referred to an RMSEs of 0.5 ∼ 2.0 cm/year in Chiba and Tokyo Bay (Ishitsuka and Matsuoka Citation2016; Nonaka et al. Citation2020). Considering that the RMSE of this study is smaller or in the range of the previous studies, it can be said that we could obtain a good result.
Figure 8. Comparison of Consecutive DInSAR results and GNSS data in three cities.
3.3. Comparison between consecutive DInSAR results, and land subsidence data
shows the mean subsidence rate of Consecutive DInSAR is 1.58 cm/year and that of land subsidence observation well is 1.56 cm/year. The difference between the two methods is around 0.02 cm/year, which is very small. Also, it can be seen that the Saedo and Shin-Yokohama Observation points have different subsidence rates at each depth of the well. Saedo observation points have two wells with depths of 16 m and 88 m, and the subsidence rates vary at each point. Also, the Shin-Yokohama observation point has three depth wells of 25 m, 60 m, and 117 m and the subsidence rate increases up to 60 m but decreases from there to 117 m. It can be seen that the subsidence rate changes with the depth of the well in both stations.
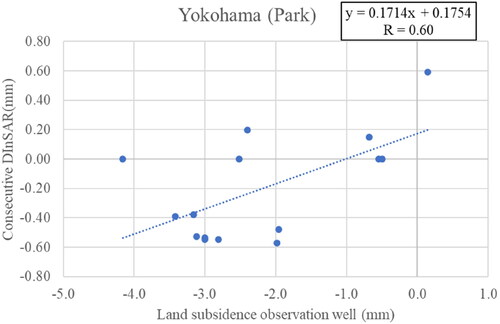
To know the accuracy of Consecutive DInSAR results, we compared them with land subsidence data by using linear correlation. The results revealed that the correlations were found at 4 stations: Yokohama (Park), Saedo (16 m), Okano, and Shin Yokohama (25 m). Yokohama (Park) showed a high correlation with a correlation of 0.6 and Saedo (16 m), and Okano and Shin-Yokohama (25 m) showed a low correlation. The most highly correlated station was the Yokohama (Park) Station, and its correlation graph is shown in .
Figure 9. Correlation of Consecutive DInSAR results and land subsidence data (Yokohama Park).
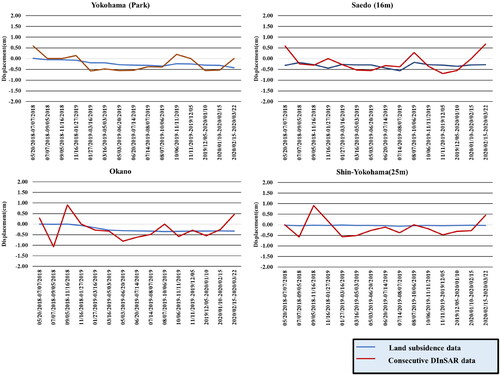
Also, we calculated the RMSEs between both methods. The RMSEs were 0.29 cm/year for Yokohama (park), 0.41 cm/year for Saedo (16 m), 0.43 cm/year for Saedo (88 m), 0.47 cm/year for Okano, 0.89 cm/year for Nippa, 0.41 cm/year for Shin-Yokohama (25 m), 0.40 cm/year for Shin-Yokohama (60 m), and 0.39 cm/year for Shin-Yokohama (117 m), showing good agreement with each other. The mean RMSE of all the results was 0.46 cm/year, which is very small. Examples of a line graph of Consecutive DInSAR results and land subsidence data are shown in .
Figure 10. Examples of Consecutive DInSAR results and land subsidence data.
Moreover, we compared the GNSS data of Yokohama city and the land subsidence data of Yokohama (park). The GNSS reference point in Yokohama City (G1) is close to 1.5 km southeast of Yokohama (Park) of land subsidence observation well (W1), which are in the same district. Therefore, these results can be compared on a one-to-one basis. The RMSE difference in these stations is 0.04 cm/year, which is very consistent with each other.
4. Discussion
In this study, the Consecutive DInSAR results and GNSS data showed a high degree of coincidence, but there were some differences in the graph of the three observation points as shown in . One of the causes is considered to be the location difference of the GNSS stations. It should be noted that only Yokohama’s GNSS point is located on the rooftop of the elementary school (Nishi et al. Citation2021). The Consecutive DInSAR results and GNSS data showed the agreement, but the displacement error is larger from May to November 2018 in . Given that the satellite SAR directly observes the changes in the ground, such the position difference may affect the time series data. Also, the geology of the area of Yokohama city (G1) is the soft ground and prone to land fluctuations. The GNSS point on rooftops may not be able to capture ground displacement in detail. These factors may be reflected in the time series graph in . Also, in Yokosuka City and Miura City, the Consecutive DInSAR results and GNSS data are consistent, and the total displacement error is smaller than that of Yokohama city (G1). This consistency is attributed to the stable geology with low permeability of the Miura Group, which is consisted of loam soil, silt rocks, and scoria, and the observation points being on the same ground surface. Thus, the position and geology difference of the observation points is considered to affect the displacement differences in the graph of .
In more detail, the error from May to November 2018 in Yokohama City and Miura City may be due to the influence of some noise remaining in the SAR interferograms. SAR interferograms generally contain several noise sources, such as atmosphere noise, ionosphere noise, and urban scattering error (Nishi et al. Citation2022). shows higher precipitation in 2018 than in other years, indicating that atmospheric errors may have a greater impact. For this, we reduced the long spatial wavelength caused by atmospheric distortions to reduce the errors, but the residuals are still considered to remain in the displacement maps, meaning that ionospheric and urban scattering errors are considered to remain. Their reduction and elimination are issues in the field of SAR interferometry.
Regarding the Consecutive DInSAR results and land subsidence data, the correlation was proven to be different depending on the observation points as mentioned in chapter 3.3. The correlation was found at Yokohama (Park), Saedo, Okano, and Shin-Yokohama, but no correlation at the Nippa observation points. This difference in correlation is thought to be due to differences in geological structure of the sites. However, the Nippa observation point may have been largely affected by the measurement errors of land subsidence observation well. Next, we investigated the causes of the correlation difference in Saedo and Shin-Yokohama observation points, where the correlation differs depending on the depth of each well. The shallow well of 16 m (Saedo) and 25 m (Shin-Yokohama) showed a correlation, but no correlation at the deep well of 66 m (Saedo) and 60 m/117m (Shin-Yokohama). It means that only the stratum shrinkage in the shallow wells of 16 m (Saedo) and 25 m (Shin-Yokohama) coincided with the land displacement of the Consecutive DInSAR method, indicating that the land subsidence observation wells may capture land surface displacements in shallow wells but not in deep wells. In more detail, the soil density changes in deep wells may not affect the land surface displacement because it is far from the surface, but only shallow wells affected the surface. In short, this study showed the strata shrinkage at the shallow well in Saedo(16m) and Shin-Yokohama (25 m) coincident with land surface changes of the Consecutive DInSAR method. However, it should be noted that in Niigata Prefecture, the land surface shrink was observed at 137 m (Suzuki et al. Citation2021), which is more than 100 m in height. Considering that the strata shrinkage varies with the location, monitoring the ground shrinkage is desirable at an appropriate well depth using the land subsidence observation well to measure subsidence.
Also, we examined the cause of land subsidence at all the observation points. In general, the subsidence is caused by excessive pumping of groundwater (seasonal change), construction of peripheral facilities, shortage of artificial embankments, and liquefaction due to earthquakes (Nishi et al. Citation2021). Japan has four seasons, and the seasonal effect of the rainy season (May to June, September to November) tends to affect the groundwater level fluctuation. For more details, we investigated the correlation between the Consecutive DInSAR results and groundwater level fluctuation. As the result, there was no correlation between Consecutive DInSAR results and the groundwater level change at any observation points. This means that the cause of subsidence is not seasonal change, but other decisive factors. Given the geology of the area and the history of previous disasters, the land subsidence could be occurred due to mainly underground work in the periphery of the observation points.
In addition, revealed that the mean RMSE of the Consecutive DInSAR results and land subsidence data almost agreed with that of the Consecutive DInSAR results and GNSS data. Also, there was a correlation between the Consecutive DInSAR results and land subsidence data in Yokohama, Okano, Saedo (16 m), and Shin-Yokohama (25 m). Such a high coincidence between the two methods suggests that the Consecutive DInSAR method could be an alternative to the land subsidence observation wells.
5. Conclusions
In this study, we examined the applicability of the Consecutive DInSAR method to the land subsidence observation well. We proposed the law of material conservation to estimate the volume change of the ground water which causes land subsidence. Firstly, we validated the accuracy of the Consecutive DInSAR technique using GNSS data, and then, compared the Consecutive DInSAR method with land subsidence observation well. The result revealed that the Consecutive DInSAR results are in agreement with GNSS data. The velocity deviation between the two was about 0.90 cm/year, and the mean RMSE was about 0.39 cm/year. Similarly, the Consecutive DInSAR results agreed with land subsidence data. The velocity deviation between the two was about 0.02 cm/year, and the mean RMSE was about 0.46 cm/year . Also, the Consecutive DInSAR and land subsidence observation well data showed the correlation in the observation points in Yokohama city except for Nippa. It was found that the correlation difference could be influenced by the geological structure of the observation points, and that the stratum shrinkage of the shallow well coincided with the land surface change of the Consecutive DInSAR method. In short, we could confirm that the Consecutive DInSAR results and land subsidence data were consistent, and identify the cause of the correlation. These results indicate that the Consecutive DInSAR method has the possibility of future substitution with the land subsidence observation well.
Author contributions
Conceptualization; K.N., M.K., data curation, formal analysis; K.N.; methodology, K.N.; Software; K.N., M.P.; supervision, M.K., N.K., and J.T.S.S.
Acknowledgments
The authors would like to thank the SARPROZ team for providing a software license for this research. Also, we would like to express our gratitude to Kaori Nishi and Noriko Nishi for their great support in this research.
Disclosure statement
No potential conflict of interest was reported by the authors.
References
- Abidin HZ, Andreas H, Gumilar I, Sidiq TP, Fukuda Y. 2013. Land subsidence in coastal city of Semarang (Indonesia): Characteristics, impacts and causes. Geomatics, Nat Hazards, and Risk. 4(3):226–240.
- Agarwal V, Kumar A, Gee D, Grebby S, Gomes RL, Marsh S. 2021. Comparative study of groundwater-induced subsidence for London and Delhi using PSInSAR. Remote Sensing. 13(23):4741.
- Basic plan. 2022. Basic plan on the advancement of utilizing geospatial information, 2022. https://www.gsi.go.jp/kokusaikoryu/kokusaikoryu-e30004.html.
- Basic Policy. 2021. Basic policy on economic and fiscal management and reform. https://www5.cao.go.jp/keizai1/basicpolicies-e.html.
- Castellazzi P, Garfias J, Martel R, Brouard C, Rivera A. 2017. InSAR to support sustainable urbanization over compacting aquifers: the case of Toluca Valley. Mexico. Int J Appl Earth Obs Geoinf. 63:33–44.
- Chen YA, Chang CP, Hung WC, Yen JY, Lu CH, Hwang C. 2021. Space-time evolutions of land subsidence in the choushui river alluvial fan (Taiwan) from multiple-sensor observations. Remote Sens. 13:1–21.
- Figueroa-Miranda S, Tuxpan-Vargas J, Ramos-Leal JA, Hernández-Madrigal VM, Villaseñor-Reyes CI. 2018. Land subsidence by groundwater over-exploitation from aquifers in tectonic valleys of Central Mexico: a review. Eng Geol. 246:91–106.
- Foroughnia F, Nemati S, Maghsoudi Y, Perissin D. 2019. An iterative PS-InSAR method for the analysis of large spatio-temporal baseline data stacks for land subsidence estimation. Int J Appl Earth Obs Geoinf. 74:248–258.
- Herrera-García G, Ezquerro P, Tomás R, Béjar-Pizarro M, López-Vinielles J, Rossi M, Mateos RM, Carreón-Freyre D, Lambert J, Teatini P, et al. 2021. Mapping the global threat of land subsidence. Science. 371(6524):34–36.
- Higgins SA. 2016. Review: advances in delta-subsidence research using satellite methods. Hydrogeol J. 24(3):587–600.
- Industrial water. 2022. Use of industrial water in Yokohama City. https://www.city.yokohama.lg.jp/.
- Ishitsuka K, Matsuoka T. 2016. Accuracy evaluation of persistent scatterer interferometry using ALOS/PALSAR Data: a case study of surface displacement in the Kujukuri Plain, Chiba Prefecture. J Remote Sens Soc Japan. 36(4):328–337.
- Lanari R, Lundgren P, Manzo M, Casu F. 2004. Satellite radar interferometry time series analysis of surface deformation for Los Angeles, California. Geophys Res Lett. 31(23):1–5.
- Land Properties. 2022. Land properties in Japan. https://www.asahi.com/sp/special/saigai_jiban/.
- Land subsidence. 2020. Compilation of aggregated data on land subsidence, 2020. http://www.env.go.jp/water/jiban/jiban_data.html.
- Land subsidence. 2022a. the Keihin industrial area. https://www.jstage.jst.go.jp/browse/jjseg/1/1/_contents/-char/ja.
- Land subsidence. 2022b. Land subsidence observation system. https://www.nies.go.jp/kanko/news/10/index.html.
- Land subsidence. 2022c. Land subsidence survey results in Kanagawa Prefecture. https://www.pref.kanagawa.jp/index.html.
- Land subsidence. 2022d. Overview of land subsidence nationwide, 2021. https://www.env.go.jp/water/jiban/chinka.html.
- Ma P, Wang W, Zhang B, Wang J, Shi G, Huang G, Chen F, Jiang L, Lin H. 2019. Remotely sensing large- and small-scale ground subsidence: a case study of the Guangdong–Hong Kong–Macao Greater Bay Area of China. Remote Sens Environ. 232:111282.
- Mahmoudpour M, Khamehchiyan M, Nikudel MR, Ghassemi MR. 2013. Characterization of regional land subsidence induced by groundwater withdrawals in Tehran, Iran. Geopersia. 3:49–62.L.
- Marfai MA, King L. 2007. Monitoring land subsidence in Semarang. Environ Geol. 53(3):651–659.
- Navarro-Hernández MI, Tomás R, Lopez-Sanchez JM, Cárdenas-Tristán A, Mallorquí JJ. 2020. Spatial analysis of land subsidence in the San Luis potosi valley induced by aquifer overexploitation using the coherent pixels technique (CPT) and sentinel-1 insar observation. Remote Sens. 12:1–23.
- NGED. 2022. National Ground Environment Directory. http://www.env.go.jp/water/jiban/directory/index.html.
- Nishi K, Kawai M, Nishi K, Eko B, Widodo J, Sumantyo JTS. 2022. Analysis of heavy rain and typhoons effect on the ground surface using DInSAR technique. Proc. - 2021 7th Asia-Pacific Conf. Synth. Aperture Radar, APSAR 2021, February 2022.
- Nishi K, Tetuko SJ, Kawai M, Waqar MM, Xiangping C. 2021. Monitoring of land deformation in Kanagawa Prefecture using GNSS and C-band Sentinel-1 -based consecutive DInSAR. JIAS. 7(1):1–21.
- Nonaka T, Asaka T, Iwashita K, Ogushi F. 2020. Evaluation of the trend of deformation around the kanto region estimated using the time series of PALSAR-2 data. Sensors (Switzerland). 20(2):339.
- Normand JCL, Heggy E. 2015. InSAR assessment of surface deformations in urban coastal terrains associated with groundwater dynamics. IEEE Trans Geosci Remote Sensing. 53(12):6356–6371.
- Orhan O. 2021. Monitoring of land subsidence due to excessive groundwater extraction using small baseline subset technique in Konya, Turkey. Environ Monit Assess. 193(4):1–17.
- Osmano B, Dixon TH, Wdowinski S, Cabral-Cano E, Jiang Y. 2011. Mexico City subsidence observed with persistent scatterer InSAR. Int. J. Appl. Earth Obs. Geoinf. 13(1):1–12.
- Pawluszek-Filipiak K, Borkowski A. 2020. Integration of DInSAR and SBAS techniques to determine mining-related deformations using Sentinel-1 data: the case study of rydultowy mine in Poland. Remote Sens. 12(2):242.
- Precipitation. 2022. Precipitation information of Kanagawa prefecture. https://www.jma.go.jp/jma/indexe.html.
- Qin Y, et al. 2018. Multi-scale analysis of the relationship between land subsidence and buildings: a case study in an eastern Beijing Urban Area using the PS-InSAR technique. Remote Sensing. 10(7):1006.
- Sumantyo JTS, et al. 2012. Long-term consecutive DInSAR for volume change estimation of Land deformation. IEEE Trans Geosci Remote Sens. 50:259–270.
- Sumantyo JTS, Perissin D, Widodo J, Andreas H, Wikantika K, Rohmaneo Darminto M, Kurniawan A, Nur Cahyadi M, Hariyanto T. 2022. Estimation of spouted hot mudflow current using continuity equation and DInSAR. IEEE Trans Geosci Remote Sens.60.
- Suzuki M, Ito K, Abe S, et al. 2021. Study on application of global navigation satellite system (GNSS) to the land subsidence monitoring. Niigata, Japan: Niigata University.
- Tobita M, et al. 2004. Seasonal variation of groundwater level and ground level around Tsukuba. J Geod Soc Japan. 50(1):27–37.
- Tomokazu K, Yu M, Shinya Y. 2018. A prototype system for InSAR time series analysis. GSI J. 130:123–133.
- Xu Y, Li T, Tang X, Zhang X, Fan H, Wang Y., 2022. Research on the applicability of DInSAR, stacking-InSAR and SBAS-InSAR for mining region subsidence detection in the datong coalfield. Remote Sens. 14(14):3314.
- Yakista P, et al. 2017. Multi-temporal analysis for differential interferometry synthetic aperture radar (D-InSAR) and its application to monitoring land surface displacements. Int J Environ Geosci. 1(1):1–11.
- Yokohama. 2022. Geology view of Yokohama city. https://wwwm.city.yokohama.lg.jp/yokohama/Portal.
- Yokokura J, Tsuchiya N, Iijima N, Watanabe T, Mizuno N. 2019. Application of double tube method to Jakarta's land subsidence observation wells and its construction method: focusing on technology from user's perspective. JSCE.37: 369–372.
- Zhang B, Wang R, Deng Y, Ma P, Lin H, Wang J. 2019. Mapping the Yellow River Delta land subsidence with multitemporal SAR interferometry by exploiting both persistent and distributed scatterers. ISPRS J Photogramm. 148:157–173.