
 ?Mathematical formulae have been encoded as MathML and are displayed in this HTML version using MathJax in order to improve their display. Uncheck the box to turn MathJax off. This feature requires Javascript. Click on a formula to zoom.
Abstract
The present study explores a holistic approach toward better assimilation of the contextual relationship between coal fire-induced land subsidence in the Jharia Coalfield (JCF), India. For the process, 31 consecutive Sentinel-1A and Landsat 8 scenes of 2018 were processed to estimate mean Line-of-Sight displacement and Land Surface Temperature (LST) in JCF, respectively. The results indicated that the displacement rate in JCF significantly varies at active mine benches and overburden dump, and high degree of displacement owing to the additive compression inducted along with the volume reduction at the subsurface. The estimated displacement accounts were then spatially correlated with the thermally anomalous pixels to determine the categories of subsidence. Further, the contextual relationship between the displacements estimates (dependent variable) with a set of explanatory variables, i.e. pixel integrated LST was tested using Binary Logistic Regression. The performance of the model was cross-validated using statistical parameters derived from the confusion matrix.
1. Introduction
‘Coal fire’ is a term that refers to the burning of in-situ coal seam, stored coal or coal waste pile (Kuenzer et al. Citation2007). This highly complex system is considered a global threat as it jeopardises the environment in its vicinity (Stracher and Taylor Citation2004). It has a dead hand on the quality of air, water, soil and land resources related to the heat and smoke released. Coal fires could be either produced by natural (e.g. spontaneous combustion, forest fires, and lightning strikes) or by artificial (e.g. in-mine ignitions, accidental forest fires, and burning wastes from mines and preparation plants) sources. The commencement and propagation of coal fires is controlled by several geological factors, such as the distance between coal beds, degree of fracturing and the nature of the overlying strata (Finkelman and Greb Citation2008; Kim Citation2011; Kuenzer and Stracher Citation2012). Other factors such as mining procedures, rate of advancement, the system of ventilation etc., also control the fire propagation (Singh Citation2013). The most significant factor determining the degree and severity of changes brought by the fire is its duration. Sluggish fires are more damaging than rapidly moving ones. The disparity in the risk is due to the difference in time for heat convection from the fire. Coal fires cause volume reduction of the burning coal seam, resulting in complex systems of linear cracks on the surface (Gielisch and Kuenzer Citation2007; Singh et al. Citation2017).
Since 1916 there have been erratic developments in the surface and subsurface coal fires throughout the JCF, making it one of the significant coal mine-fire complexes in the world (Gupta and Prakash Citation1998, Raju et al. Citation2016). It has been estimated that about 37 million tons of coal has been lost and approximately 220 billion tons made inaccessible by the coal fire (Bharat Coking Coal Limited (BCCL) Citation2008; Ray Citation2017). Haphazard mining procedures with no regard to the surroundings have resulted in this disaster (Mishra et al. Citation2020). The eastern part of the JCF is found to be more affected by the coal fire than the western part (Martha et al. Citation2010). The subsidence could be either localized or extended and active or residual depending upon the mining method used, seam properties (thickness, dip, depth), the competence of bedrock, kinetics of the combustion of the coal seam, and the geology of the area. (Majumdar Citation2013; Chatterjee et al. Citation2016; Karanam et al. Citation2021). As the land degrades, local inhabitants and mine workers face a threat to life and livelihoods (Lahiri-Dutt Citation2014).
Coal fire monitoring has become highly efficient with advancements in remote sensing techniques. It is imperative for subsidence prediction, maximising coal extraction and minimising the menace posed to the surrounding. Most of the work primarily focuses on recognizing thermal irregularities and modelling coal fire dynamics (Barsi et al. Citation2003; Raju et al. Citation2016; Singh et al. Citation20220). However, the study of ground deformation or mine subsidence in response to coal fires is equally essential. The Interferometric Synthetic Aperture Radar Interferometry (InSAR) is a technique that monitors this response. It is an advanced geodetic technique which has been used frequently for monitoring vertical ground movements induced by subsurface coal fires at milimeter scale (Zhou et al. Citation2013; Gupta et al. Citation2013; Majumdar Citation2013; Przyłucka et al. Citation2015; Chatterjee et al. Citation2015; Borah et al. Citation2017; Wang et al. Citation2021). InSAR uses two SAR scenes acquired over the same area and transforms their phase information by developing interferograms containing displacement estimates. However, the derived single interferogram has significantly influenced by spatial-temporal decorrelation, atmospheric interference, scattering characteristics and requirement of precise Digital Elevation Model (DEM) (Ferretti et al. Citation2000; Crosetto et al. Citation2016; Raju et al. Citation2022). To overcome these issues, time series InSAR methods such as Differential Interferometric Synthetic Aperture Radar Interferometry (DInSAR), Persistent Scatterer Interferometry (PSI), Small BAseline Subset (SBAS), Coherent Point Target Analysis (CPTA) have been widely used these days. These techniques generate large-scale displacement estimates using multi-temporal interferometric pairs along the line-of-sight (LOS). The time series displacement results are further compared with GPS/GNSS measurements at high precision (Strozzi et al. Citation2001; Zhou et al. Citation2013). Single frequency and multi-frequency DInSAR techniques have been used for C- and L-band SAR data (Stow and Wright Citation1997; Strozzi et al. Citation2001; Gupta et al. Citation2013). C-band DInSAR is relatively more receptive to slower deformation and is as a consequence more suited for slow velocity subsidence determinations using shorter temporal baseline data pairs (Chatterjee et al. Citation2017). Earlier, many workers have used Envisat and ERS acquisitions in C-band for subsidence related investigations but with the advent of ALOS PALSAR in 2006, works have been done with the L-band images (Zhou et al. Citation2013; Chatterjee et al. Citation2015; Borah et al. Citation2017; Zheng et al. Citation2020). The L-band DInSAR is said to be more befitting for subsidence related studies since it has a higher coherence and is useful in determining high-velocity deformation. But when the results of C-band are compared with those of L-band, the former has a higher accuracy (Cao et al. Citation2008). Techniques such as Small BAseline Subset (SBAS), Persistent Scatterer Interferometry (PSI) and Coherent Point Target Analysis (CPTA) can overcome some of the DInSAR limitations like topographic and atmospheric effects. However, apart from the persisting problem of temporal decorrelation, they have a requirement to predefine a deformation model. And this has limitations when subsidence rates of the study area are high because then the selected prior deformation model can deviate from the real deformation causing to lose some distributed scatterers (DS). The time series InSAR approach does not have this limitation, since it doesn’t require any deformation model. Moreover, the time series InSAR technique as a cost-effective and complementary method to conventional geodetic techniques is suitable for efficiently monitoring areas of high subsidence rates. (Pawluszek-Filipiak and Borkowski Citation2020; Raju et al. Citation2022).
The analysis of surface deformation in a coal fire-affected area is complex. Non-fire thermal anomalies and active coal mining compromise the detection of the risk due to coal fires (Liu et al. Citation2021). Recently, the state of land subsidence accompanying coal fires have been recent studied in Xinjiang, China. Improved method of coal fire detection has been proposed by combining multi-temporal thermal infrared and time series InSAR data (Yu et al. Citation2022). Comparison of interferometric information with multi-temporal coal fire maps enable the state assessment of ongoing land subsidence and detection of new subsidence zone (Jiang et al. Citation2011; Ma et al. Citation2016). In JCF particularly, most of the studies have been restricted to the mapping of coal fires. In recent years, with the availability of SAR data, the DInSAR technique has been used to map the spatial extent and displacement rate of land subsidence in JCF. Subsidence in JCF is highly localized and falls close to the coal fire-affected area. The deformation rate as notified in various study vary between 10-20cm/year (Chatterjee et al. Citation2016). Areas such as Barora, Katras, Sijua, Jharia, Lodna, Keshalpur and Bararee have been critically affected, and fire and subsidence-related risks are spreading towards the south along the dip direction of the coal seams (Kumar et al. Citation2020; Riyas et al. Citation2021; Karanam et al. Citation2021). The quantitative assessment of precise inter-relationship between temperature distribution and surface displacement in JCF can help mark the areas vulnerable to potential land subsidence. However, the insight to contextual relationship between the coal fires and related land subsidence has been addressed on a minimal scale. Based on a brief review mentioned above, the attempts have been made (1) to map the thermal anomaly and estimates of coal fires in JCF using Landsat 8 OLI TIRS band 10; (2) to measure the rate of LOS displacement, extent and pattern of land subsidence using time series InSAR. (3) The spatial variability between coal fires and land subsidence have been further discussed to determine the categories of mine subsidence. (4) Lastly, the contextual relationship between LST and mean LOS displacement estimates have been determine using Binary Logistic Regression (BLR). It predict the categorical outcome of presence or absence of surface deformation in response to coal fire. Since the impact of decorrelation and topographic noise could be significant in a larger test site, we have tested the methodology in three selected areas having relatively minor spatial extents- Angarpathar-Kantapahari, Alkusa-Nayadih and Lodna.
2. Jharia coalfield, India
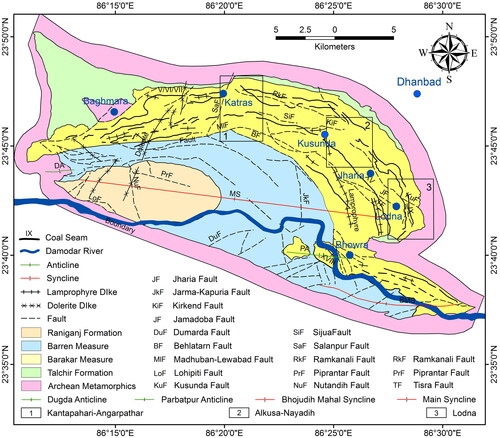
The Jharia Coalfield (JCF) is located between latitude 23°38′ N to 23°50′ N and longitude 86°07′ E to 86°30′ E at the eastern end of the Satpura-Damodar belt in the Damodar Valley (). The sickle-shaped terrain of area ∼450 km2 is abode to the prime coking coal of India, having a total estimated reserve of about 19.5 billion tons (Indian Minerals Yearbook (IMY) Citation2019). The JCF comprises deposits of fluvial-lacustrine origin of Permo-Carboniferous age that unconformably overlies the inter-cratonic Precambrian basement (; Acharyya Citation2000). The area exhibits an E-W trend with a shallow dip of 2°-5°. The Barakar Formation is the primary coal-bearing formation in the JCF that constitutes coarse to medium grey and white sandstones, shales and coal seams (). Due to uncontrolled coal seam fire in JCF, the opencast method is generally followed here to extract coal from the Barakar Formation.
Figure 1. Location map of Jharia Coalfield (JCF), India, showing locales of active coal mines and test sites, namely, Angarpathar-Kantapahari, Alkusa-Nayadih and, Lodna in Sentinel 2 FCC.
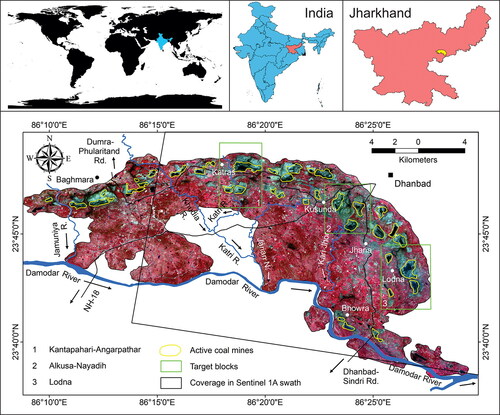
Figure 2. Geological map of the Jharia coalfield showing major sedimentary litho packages (modified after Sengupta Citation1980; Paul and Chatterjee Citation2011).
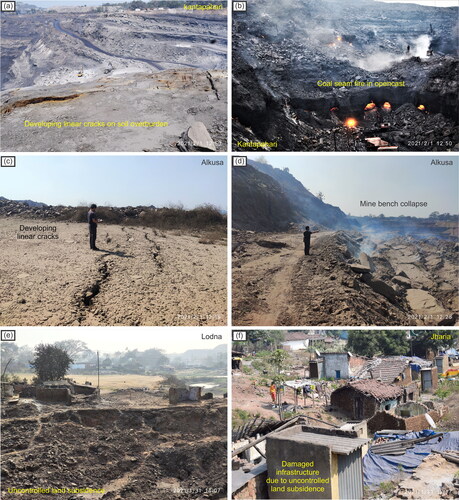
In the present work a field survey was conducted during February 2020 in the coal fire affected areas in JCF to envisage the severity of damage and to demarcate the geographic locations. In pursuance to observe coal seam fire in an open state, field work was carried in and around Angarpathar-Kantapahari, Alkusa-Nayadih and Lodna areas of JCF. Several crisscross cracks on the soil overburden were observed (). These cracks were surface manifestations of subsurface joints that have broadened during the burning of the subsurface strata (). It was observed that the destruction of the landscape was in its progressive phase. As linear cracks were observed on the overburden developing from fissures at one site, and approximately 100 m from it, mine bench collapse was noted (). The surface manifestation of coal fire is immensely intensified at places where the coal fire is shallow, leading to an accelerated subsidence rate (). At some places around the Lodna area, trenches have been excavated by the authorities to prevent further fire progression (). Surface subsidence was observed in the region, jeopardizing infrastructures and lives ().
Figure 3. Field photograph reconnoitring the coal fires affected areas in JCF to envisage the severity of damage and demarcate the geographic locations. (a) development of intense cracks system in response to subsurface fire, (b) exposed coal seam fire in an open state, (c-d) ravaging landscape due to progressive phase of deformation, (e-f) jeopardizing infrastructures in subsidence affected area near Lodna.
3. Dataset used
To measure mine subsidence in and around Jharia coalfield from January 2018 to December 2018, 31 Single Look Complex (SLC) of C-band Sentinel-1A data SAR scenes was acquired from the Alaska Satellite Facility-Distributed Active Archive Center (ASF-DAAC; https://earthdata.nasa.gov/eosdis/daacs/asf/). Since the areas around JCF is devoid of vegetation cover, C-band SLC datasets are quite suitable for deformation analysis (Yue et al. Citation2011). All scenes were procured in a descending orbit direction with IW beam mode and in VV polarization.
Satellite acquisition of Landsat 8 Operational Land Imager (OLI) TIR band 10 was procured for the year 2018 for generating land surface temperature data. The geometrically and radiometrically calibrated level 1 A dataset was downloaded from http://earthexplore.usgd.gov. The dataset used was of 25/11/2018 as the atmospheric heat is low during this month. Besides, Sentinel-2 images dated 29/12/2018 have also used ancillary data for visual interpretation.
4. Methodology overview
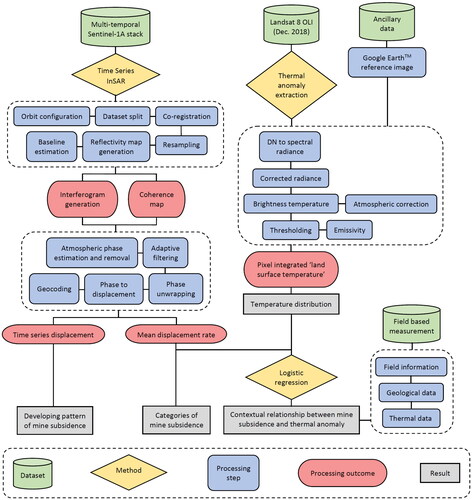
The methodology structure followed in this investigation encompasses satellite data acquisition followed by the analysis and evaluation of data for coal fire-related mine subsidence and LST. The datasets were processed as per the objectives of the research under the points discussed below. An overview of the adopted methodology is shown in a flowchart ().
Figure 4. Schematic diagram showing the data processing and methodology adopted in the present work.
4.1. Land surface temperature (LST) estimation
A more directed approach towards LST estimation is the reversal of the radiative transfer equation (RTE) by the following approach (Yu et al. Citation2014; Sekertekin and Bonafoni Citation2020; EquationEq. 1(1)
(1) )
(1)
(1)
where,
is radiance measured by the satellite sensor of the related thermal band,
is spectral surface emissivity (here, a constant emissivity of 0.96 has considered),
is the blackbody radiance,
is the land surface temperature,
is the atmospheric transmittance,
is downwelling radiance, and
is upwelling radiance.
The RTE uses atmospheric transmittance, downwelling and upwelling radiance as an input. An account of upwelling atmospheric radiance of 1.27 Wm−2sr−1μm−1 and atmospheric transmission (τ) of 0.84 for TIR bands were derived from https://atmcorr.gsfc.nasa.gov/. Here we have used Landsat 8 OLI TIR band 10 to retrieve LST as it has maximum atmospheric transmittance and minimum upwelling radiance.
Radiance of a Blackbody at a temperature
is retrieved by the inversion of EquationEq. 1
(1)
(1) (EquationEq. 2
(2)
(2) ):
(2)
(2)
and, lastly,
is estimated by inverting Planck’s law as (EquationEq. 3
(3)
(3) ):
(3)
(3)
where K1 (774.88 Wm−2sr−1μm−1) and K2 (1321.07 K) are calibration constants. In principle, with the thermal radiance estimated at the sensor level and atmospheric parameters and spectral emissivity known, the RTE is solved to obtain the LST. Finally, a precise threshold was derived using histogram analysis to segregate the pixel attributed to the anomalous LST above than background (Prakash and Gens Citation2010; Raju et al. Citation2012).
4.2. Single interferogram and SBAS-InSAR processing
The SAR Interferometry evaluates the LOS displacement that gets encoded in the phase difference between the two SAR acquisitions. The SAR images specified as Master and Slave acquisitions were co-registered first to nullify any disparity exist in terms of pixel contribution (range and azimuth) by the feature in question. It was done to transmute the slave image geometry-wise into the master image. The co-registration of two or more SLC SAR images was optimized using coherence estimated from N-sample window (Woodhouse Citation2006). Later, the phase difference is measured at each pixel of a phase difference image known as an Interferogram. The complex interferogram thus produced consists of a phase difference which is a sum of the deformation and residual phases. (EquationEq. 4-5)
(4)
(4)
(5)
(5)
where,
is the interferometric phase,
is the residual phase,
is the ground deformation phase,
is the topographic phase,
is the phase contribution of atmospheric effects,
is the phase contribution of errors in orbit information and
is the phase contribution of the uncorrelated noise produced by the scatterers in the background.
In order to isolate the displacement phase, removal of phase difference contribution by other sources is imperative. The linear phase displacement was estimated by subtracting residual phase from the total interferometric phase. The was removed by using an external topographic model (e.g. DEM), the
was removed by orbital information from metadata. The
contains high spatial and low temporal coherence, indicating that the SAR scenes will have same atmospheric phase delay in same time, but changes temporally from scene to scene (Crosetto et al. Citation2016). However, in the present approach, the
was ignored following an assumption that in arid and semi-arid areas, which is a case for the JCF, the spatial extent of phase delay due to atmospheric fluctuations will be insignificant (Zhou et al. Citation2013; Gupta et al. Citation2013). Also, this study was conducted over a limited period which, along with the region’s particular atmospheric condition provided the basis for ignorance. To acquire annual velocities as millimetres per year (mm/yr), it was assumed that the subsidence in JCF is linear throughout the year. The mean differential interferogram phase (
) was then unwrapped to obtain mean annual LOS displacement
using the ‘phase to displacement function’ in JCF (Mahagaonkar Citation2019; EquationEq. 6
(6)
(6) )
(6)
(6)
Since JCF is often inaccessible due to uncontrolled fire and active subsidence, based on the prior knowledge of subsidence locales and their small spatial extent, the time series SBAS-InSAR method has been found quite suitable for displacement measurement. SBAS overcome the problem of spatial-temporal decorrelation by using large-scale temporal coherence between the SAR scenes with short multi-temporal baseline. In SBAS processing, the conversion of the differential interferogram phase () to displacement estimates is largely defined by the precise selection of reference or ground control points (GCPs). For the same, the pixels with large temporal coherence (0.90) falling over the flat area with nearly or close to zero deformation (unwrapped phase) values have been selected as reference point (coherence of 0.9 as the stable threshold) (Loesch and Sagan Citation2018). The mean displacement estimates of the reference points later subtracted from the displacement image to generate final displacement map of JCF. The DInSAR technique was applied over the 31-time series SLC image (n) of Sentinel data acquired between 02/01/2018 and 28/12/2018. The image dated 19/06/2018 was selected as a master image with perpendicular and temporal baseline of 120 m and −192 days.
4.3. Binary logistic regression (BLR)
The advanced regression analysis was performed to characterize the contextual relationship between different variables (Hosmer and Lemeshow Citation2000). Logistic regression technique has been widely used for hazard analysis (Lee et al. Citation2006; Pradhan Citation2010; Ghasemi and Gholizadeh Citation2019; Bui et al. Citation2018). The most common type is linear regression, which predicts the continuous variable by studying the relationship between dependent and independent variables using Eq. 7.
(7)
(7)
However, the inclusion of any outlier data points from the mean, deviate the best fit linear regression hyperplane that may or may not precisely predict the dependent variable. To overcome this problem, the ‘Binary Logistic Regression (BLR)’ has been used here to evaluate the degree of relationship between the mean annual LOS displacement (dependent variable) and temperature (LST as the independent variable) brought by the coal-fires. We presume that the dependent variable here is the categorical variable, which means that in response to the anomalous change in the LST above the threshold (i.e. any increase in LST due to an increase in the intensity of coal burning), mine subsidence may or may not be induced. BLR is used to solve the classification problem by calculating the probability of an event to occur with a desirable categorical outcome in the form of 0 or 1. This relationship is explained by a sigmoid function (Eq. 8).
(8)
(8)
The sigmoid function maps the relationship between the dependent and independent variable for BLR by converting the independent variable into an expression of probability that ranges between 0 and 1 concerning the dependent variable (Eq. 9).
(9)
(9)
Finally, the BLR predicts the continuous values, representing the probability of a given data point to be labelled into a particular class by transforming the value of y using Eq. 10. It converts any dependent variable into a discrete value or binary format, where 0 indicate the probability of no occurrence and 1 show the possibility of a particular occurrence of an event.
(10)
(10)
where, y is the probability of an event to occur. It could be between 0 to 1 when setting the threshold to categorize the output as 0 or 1, x1, x2 are the independent variable used to calculate the dependent variable. Independent variable controls the occurrence of an event, b1, b2 are the respective coefficient of independent variables.
5. Results and discussion
5.1. LST distribution in JCF
The selection of accurate threshold temperature value is considered a mainstay for precisely discerning thermal anomalies from background values and estimating lower confidence limits for classification purposes. In this study, the histogram of Landsat 8 OLI retrieved pixel integrated LST acquisitions was prudently examined (). An assumed uniform histogram slope was made to intersect the x-axis and the corresponding value, i.e. 32.3 °C, where it crossed was considered as the threshold value.
Figure 5. Pixel integrated Land Surface Temperature (LST) showing distribution of thermal anomaly derived from Landsat 8 Operational Land Imager (OLI)) data in JCF.
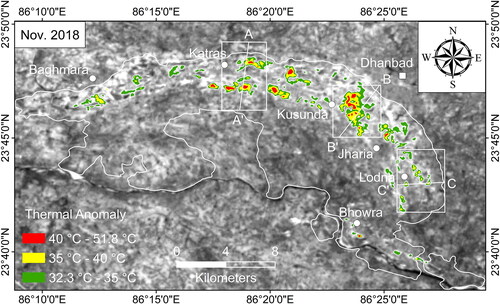
Thermal anomalies provide us vital insights in evaluating spatial dimensions of the areas touched by the coal fire. The recognition of these anomalies from low ground element data, such as Landsat OLI band 10, seems problematic. Since the depth and dimension of coal fires are the core drivers for the intensity and magnitude variations in thermal anomalies, therefore, thermal anomalies created at the surface are feeble and marked by the development of linear cracks. These cracks further expose the burning coal seam and exhibit higher temperature (>100 °C) than the background. If suppose the combustion is shallow, then the crack dimensions would be equivalent to the size of the burning coal seam at the subsurface. So, a crack of 10 m x 1 m dimension with 300 °C to 400 °C temperature might only elevate the temperature of a 100 m x 100 m thermal pixel by 45 °C against a background temperature of 28°-30 °C. Thence, to create an anomaly discernible by the sensor, either the subsurface fire has to be spatially vast or up to 30%-40% of the TIR cell size. However, if the combustion is deep, then the intense and enormous fire will only manifest itself over the surface and create a distinguishable thermal anomaly from the background.
The intensity of coal fires in anomalous regions is classified into three divisions: (a) Low-intensity thermal anomalies (32.3°-35 °C), (b) Medium-intensity thermal anomalies (35°-40 °C), and (c) High-intensity thermal anomalies (40°-51.8 °C) (). The abnormal regions show a significant pattern of decreasing intensity from the source. Low-intensity thermal anomalies are observed mainly in the south and southwestern part of JCF, and could be the response of either reasonably large dump fire or the increase in the depth of the burning coal seam. The total coal fire-affected area in JCF is around 14.6 km2. The regions around Katras, Sijua, Kusunda, Kustore, Pootkee Balihari and Lodna are under intense fire and contribute ∼85% of the affected area. In the selected blocks for the present study, viz., Angarpathar-Kantapahari, Alkusa-Nayadih and Lodna, the spatial extent of the affected areas is around 2.44 km2, 4.25 km2, and 1.17 km2, respectively ().
Table 1. Spatial extent of coal fire-induced risk in three selected coal mines of JCF.
5.2. Single interferograms and SBAS-InSAR derived time series deformation
5.2.1. Developing pattern of mine subsidence
InSAR technique provides displacement estimates through a series of stacks of complex interferograms. Since we have used only one year-long data and based on the field observations, it is evident that the locales of remain constant and the corresponding pixels attributed to the active subsidence zone in the successive SLC pairs remain unchanged. The co-registration of successive SAR data was optimized using a temporal coherence of 0.8. The complex interferograms (n-1) was finally obtained after co-registration of multi-temporal images and was filtered and unwrapped to retrieve maximum deformation in JCF. The InSAR results were consecutively plotted at three-month intervals from January 2018 to December 2018 to observe the progressive pattern of the deformation phase (). The results provide the location and deformation pattern of mine subsidence through a stack of multi-temporal interferograms. The generated interferogram between the closest data shows active subsidence of mine benches under the influence of shallow subsurface fires.
Figure 6. a-d: InSAR derived single interferograms plotted at three months intervals from January 2018 to December 2018. The interferograms show the deformation phase in the form of an elliptical set of fringes, representing the subsidence boundary in JCF.
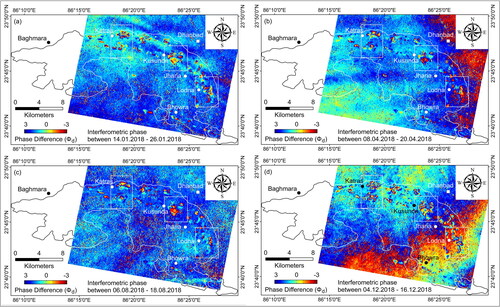
The multi-temporal interferograms shows a measurable deformation phase well developed around Katras, Sijua, Pootkee Balihari, Kustore, and Lodna coal mine areas. Each deformation phase is mark by an elliptical set of fringes representing the subsidence trough boundary. Several subsidence zones or ‘troughs’ of different sizes and extents were observed in JCF (). When compared with the Google Earth images, the geographical locales of these deformation fringes are quite integrated and significantly follow the topographical features of the opencast areas. The integrated analysis of deformation fringes and ground-based information has been imperative in figuring out and locating an active bench of subsidence. As JCF encompasses within a highly deformed basin, the availability of invariable faults and open warps systems of the coal seam strictly control the progressive nature of the coal fire. The structural control restrains the large spatial extents of the deformation fringes within the opencast coal mine. Therefore, in such areas (i.e. in and around opencast), the interferograms show low to high deformation phase gradient over a small aerial extent. The variations in the size of deformation fringes could also be due to large scale excavated overburden waste dumped around the vicinity of coal mines. The deformation fringes at the dumpsites are considerably broad, regular and invariable in areal extent, such as in the south of Alkusa-Nayadih coal mine. It is also observed that the patterns of deformation fringes at the corresponding mines itself significantly vary temporally (). It could be possible because these mine areas are highly dynamic as land-use variables have changed considerably with time and rigorous mining activities.
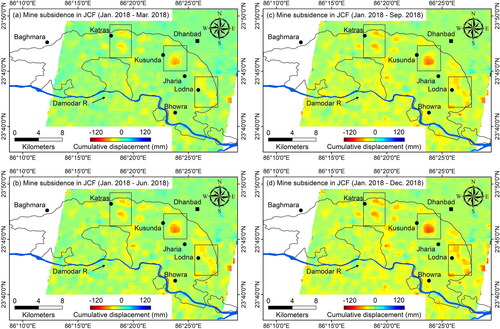
SBAS-InSAR derived time series deformation result gives a pattern of land subsidence as developed in response to coal fires in JCF. The results were plotted at three-month intervals from January 2018 to December 2018 (). Results show the spatial extent of subsidence in the affected areas remains constant, and only the intensity or degree of displacement increases with time. Since propagation of subsurface fires in JCF is under structural control, lateral expansion in the extent of coal fires and related subsidence along the strike of the coal seam (mainly due to the presence of numerous strike-slip faults) has not been noticed. It suggested that there would be pronounced vertical deformation in JCF, especially at mine benches. As a result, risk due to subsidence remain constant at highly affected sites such as Barora, Katras, Kusunda, Jharia, and Lodna, covering nearly ∼19-20km2 of the total affected area. The deformation rate at these sites varies between 120-150mm/yr. As the deformation rate in JCF is significantly high, it could be possible that the subsidence at these locales may have been initiated long time ago. However, as in the present approach, only a yearlong dataset have been used, and recently developed subsidence zone are challenging to observe.
Figure 7. a-d: Pattern of land subsidence in JCF. Results shows the spatial extent and degree of subsidence in the affected area. Note that the degree of subsidence increases with respect to time with no or incremental increase in spatial extent (lateral expansion in the subsidence zone) suggesting pronounce vertical deformation in JCF.
5.2.2. Deformation at selected locales
The SBAS-InSAR derived degree or extent of the subsidence area is commensurate to that of the thermal anomaly (∼14.6 km2), thereby indicating that the subsidence in JCF is generated in response to the surface-subsurface coal fires (). The areas inhabited in proximity to mines, specifically in the south, are highly vulnerable to subsidence brought by the progressive nature of fire. However, in the south-eastern part of the JCF around Lodna, where the extent of the thermally anomalous zone (∼1.2 km2) is significantly smaller than the area under subsidence (∼2.5 km2), the large extent of the subsidence trough could be a result of local geological setup and intense mining activities. The ground surface deformation due to mine subsidence in the JCF is significantly vertical. The mean annual displacement values have been derived for each deformation cluster shown in the mean annual LOS displacement map (). The displacement values in the affected areas are highly variable and range between 40-140mm/yr with a total spatial extent of ∼19.8 km2 (). The LOS deformation velocity in JCF significantly varies with different land-use type, specifically at active mine bench and overburden dump. The spatial extent of the subsidence trough coincides with all functional mine areas around JCF. The LOS displacement values vary from low to high over a small spatial dimension, with the values progressively increasing from the centre to the outer margin of the subsidence troughs (). The clusters of pixels attributed to the overburden dump located in the vicinity of opencast and are significantly larger in spatial extent. The estimated deformation rate at the active mine benches and overburden dump is in a range of >80mm/yr (marked in red). The displacement rate significantly vary from low to moderate (40-80mm/yr, represented in yellow) in opencast.
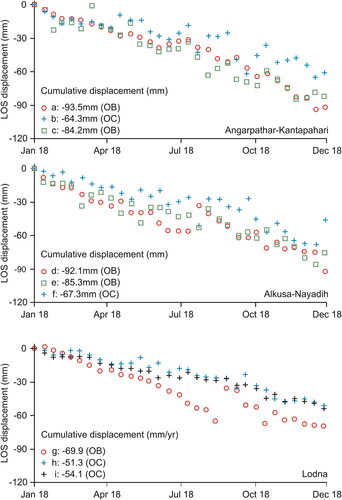
Figure 8. SBAS-InSAR-derived mean annual LOS displacement (mm/yr) derived for each deformation cluster. Note the point a, b, c…i, which marks the geographic locales of the active mine bench and overburden dump where maximum deformation trend has observed in selected test sites.
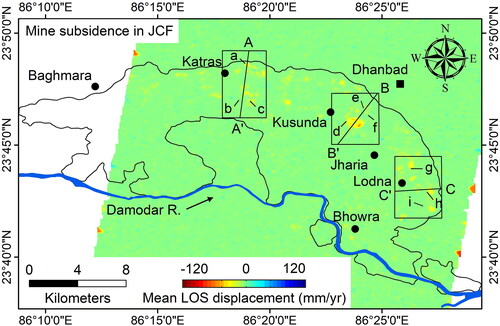
To observe the deformation rate at these classes, three severely affected areas, namely, Angarpathar-Kantapahari, Alkusa-Nayadih, and Lodna were selected (). There is a gradual increase in ground deformation rate at chosen sites in JCF (). Point a, b, c…i, in marks the geographic locales of the active mine bench and overburden dump where maximum deformation trend was noticed. The deformation rates are highly uneven at the opencast and overburden dump which is attributed to land use. The estimated annual average subsidence rates at the mine bench and overburden dump of these localities range from 80-120mm/yr (). Results indicate that the area around Angarpathar-Kantapahari opencast is highly affected. Although the SBAS-InSAR based analysis precisely locates the subsidence troughs in JCF but based on the field observation, we firmly believe that the results obtained at a few sites are slightly underestimated, such as in the vicinity of the Alkusa and Kantapahari opencast, where the rate of displacement is significantly very high i.e. over >80mm/yr. The west of Kujama opencast near Lodna is also one such case where the area has been turned into rugged topography due to the westward progression of the very sallow subsurface fire.
Figure 9. Time series deformation rate at selected points marked in . Note the varied degree of deformation rate attributed to different land use such as OB (overburden site) and OC (opencast) in JCF.
5.3. Temperature v deformation variability
The spatial distribution of thermal anomaly and deformation troughs showing LOS displacement is commensurable and approximates each other. The relationship between both these variables explains the nature of LOS motion along with the respective deformation phase. Since fires in a coal seam are highly sporadic, it is difficult to get precise estimates of the size and intensity of fire in a coal seam. Therefore, we assume that the extent and the intensity of thermal anomaly generated at the surface are the manifestations of coal fires at the subsurface. The LST and displacement data were resampled to a 30x30m pixel size. The corresponding pixel values were selected on the profiles drawn across the deformation troughs located around the Angarpathar-Kantapahari Alkusa-Nayadih, and Lodna (). As mentioned, a threshold of 32-33 °C was selected to extract the anomalous pixel from the background. For the retrieval of deformed pixels showing maximum LOS displacement, the background phase of higher than zero value was selected. The plots show a close distribution between anomalous values of LST and LOS deformation velocity in the opencast (; marked in the grey zone).
Figure 10. Cross-sectional profiles drawn across the derived thermal and deformation phase fringes to demarcate the corresponding maximum anomalies from the background in the selected test.
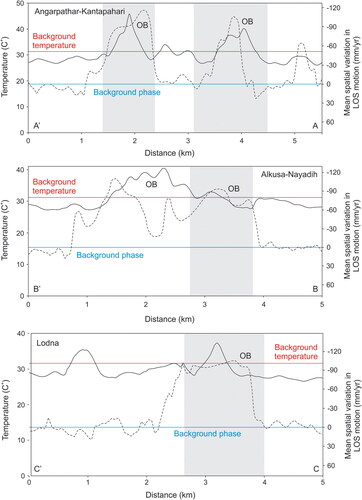
High thermal anomaly in opencast is attributed to the exposed burning coal seam and is closely linked with anomalous deformation phase value (). It indicates that the mine benches have been significantly deformed in response to an exposed coal fire. The close association in the opencast also implies that the LST is a statistically significant independent variable that explains the spatial extent of mine subsidence in the test sites. At large overburden dumps such as in the Southwest of Alkusa, anomalous zones are quite large in spatial dimension (). The LOS displacement in these regions is significantly abnormal at the margin representing the slope of the dump. The central part of the dump zone is relatively less anomalous and, in general, stable. However, the anomalously high deformation velocity in the overburden dump may also be due to the additive compression inducted along with the volume reduction at the subsurface. The overburdened dumps located at considerable distance from the opencast are characterized by low to moderate thermal anomaly without significant deformation (). It is reasoned that as the depth of the coal seam from the surface increase with the increase in distance in the south, the possibility of mine subsidence in response to subsurface fire may hypothetically reduce.
5.4. Categories of mine subsidence
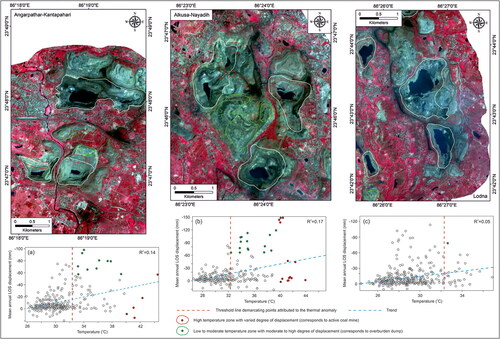
The extent of the subsidence sites derived from the SBAS-InSAR analysis reflects a strong common expression of LST and LOS displacement in the local mine setting of JCF. It shows that the deformation velocity at the surface responds to the coal fires at the subsurface. Since LST is the clear expression of subsurface fires, the correlation between LST and mean LOS displacement velocity in different land-use allow us to classify detected mine subsidence into distinct categories. In doing so, the local geology and structural discontinuities of JCF have not been considered. As the extent of JCF is significantly large and resultant deformation fringes are quite segregated, the categorization of subsidence site is difficult. Therefore, we have used a smaller subset of similar sites for analysis (Angarpathar-Kantapahari, Alkusa-Nayadih, and Lodna). The corresponding LST and mean LOS displacement velocity raster dataset for each selected site was masked and resampled to 30x30m pixel size. The pixel values of each raster dataset were transformed into a network of 75 × 50 rectangular cells using Fishnet tool in ArcGIS 10. Each cell represent a point value which is the weighted average of the pixels falling in that cell. Each point has the value of both LST and mean LOS velocity. The selected blocks are rectangular in areal extent and so 75 × 50 rectangular cells was used. The adopted method is unbiased as all pixel values were considered. The categories of subsidence are evaluated using the scatter plot drawn between the two variables i.e. LST and mean LOS deformation velocity. The best fit line (marked in dotted blue) specifies the relationship between the variables. This line goes through the data and represents the trend of the points in a scatter plot. It approximates the direction which looks weak positive relation, i.e. one variable increases with the increase in another variable. The spatial relationship between the selected variables suggested that a decrease in LST may cause an incremental reduction in the deformation. The derived scatter plots have numerous outlier and inlier points due significant variation in degree of LOS displacement at mine benched and overburden dump as a result the obtained correlation is significantly low. However, the clusters of outlier and inlier points suggested different categories of mine subsidence based on its association with different land use in JCF. Sentinel-2 FCC of December 2018 was used to mark distinctive categories of subsidence associated with the land use in selected sites ().
Figure 11. The categories of subsidence derived from the scatter plot drawn between LST and mean LOS deformation velocity as two variables. The best fit (red) marks the weak positive correlation between the selected variables. The cluster of outliers and inliers scatter points categorizes the nature of subsidence marked in red and green polygon over corresponding Sentinel-2 standard FCC of the selected test sites in JCF. Note that in Lodna area, thermal anomaly generated at the surface is significantly weak and therefore, moderate to high degree of subsidence response is attributed to the overburden dump located in SW (small green polygon).
In has been observed that the outlier points are highly deviated from the mean and are represented by scatter points of the high thermal anomaly with varied degree of deformation (marked in red). The anomalous points symbolize the corresponding zone located at the mine bench of the opencast (). The spatial extent of the mine bench subsidence is a function of temperature and depth of the burning coal seam at the subsurface. In JCF, coal seams above the depth of 30-40 m are under intense fire. Since, the mining activities are carried along the strike of the burning coal seams, as a result, the imprints and expression of the mine bench subsidence is physically demolished. Therefore, the subsidence along the trend of the coal seam is highly insignificant with or without precise mine bench subsidence. The area broadly possesses flat or gentle topography along the strike of the coal seams. The extent of the subsidence area at places along the dip is only up to few meters, indicating the sporadic nature of the coal fire at depth (vertical distance of the mine bench above the burning coal seam) and the stages of combustion. As the fire moves along the dip and its intensity grows with time, the total volume of the burning coal seam is completely reduced, which causes the overlying surface to collapse. Once the bench gets collapse, the further progression of subsurface fire could block. Therefore, in general, the mine benches possess high-temperature zones with significantly varied degree of displacement and is limited to a small areal extent.
The overburden dumps are generally located in the vicinity of the active coal mines and are characterized by the undulating terrain with moderate to steep slope (). In contrast to the mine bench, the degree of subsidence at the overburden dump site, is moderate to high without any apparent deformation due to the in-built compression induced by dump material extending over a larger area. Because of the continuous spontaneous combustion, the volume of the burning coal seam gets significantly reduced. To keep the volume constant, the coal seam gets elongated in the longitudinal direction. As a result, a lateral strain is developed in the coal seam, which causes its contraction in the lateral direction. The prolonged compression deforms the underlined ground surface and complements the burning coal seam, causing the vertical subsidence of ground by volume reduction. Since the coal seams are dipping to the south, therefore, this additive parameter can only be functional to the dumps that are located in the south. Due to this reason, there is a significant variation in the SBAS-InSAR derived LOS displacement at overburden dumps located in the north and south (high degree of displacement marked in green) of the opencast (). Since, the area is high dynamic due to active mining, the low degree of displacement <40mm/yr is considered as false alarm in this study and hence, neglected.
5.5. Contextual relationship using BLR and cross-validation
As mentioned earlier, the deformation at the surface is governed by many factors. However, based on the available field information, it has assumed that high-intensity subsurface fire at shallow depth would have contributed the most to the selected site’s deformation. As mentioned earlier (Categories of mine subsidence), the points transformed from a network of rectangular cells comprise the value of LST and mean LOS displacement. All points falling within each selected site of Angarpathar-Kantapahari, Alkusa-Nayadih, and Lodna have been used in BLR to estimate the contextual relationship between LST and mean LOS displacement. The BLR algorithm we used here predicted the categorical outcome of presence or absence of surface deformation (dependent variable) in binary format using LST data as the independent variable with reasonably good accuracy. With the reason that the mean annual subsidence rate in JCF are land use specific (such as it ranged between ∼80mm/yr and ∼>120mm/yr at the mine bench and overburden dump, repectively), and due to local disturbance in a mining area, subtle displacement values (<80mm/yr) are neglected. Therefore, to indentify the contextual relationship using BLR, it has been assumed that the LOS displacement values above 60 mm/yr are induced by the subsurface coal fire. We have first transformed LOS displacement value into a categorical column, where the values are discrete (0 or 1). Therefore, each point having LOS displacement value above 80 mm/yr with the corresponding LST value above a precise threshold (32.53 °C) was considered as ‘1′. The rest of all other values that don’t fall into the mentioned class were assigned as ’0′. Results indicated that the categorical outcome shows a good relation between the mean LOS displacement and LST. It has been observed that nearly 10-15% of the points were assigned as ‘1′, indicating that the deformation in response to high-temperature shallow subsurface fire is highly localized at active mine areas. Since, the active mine areas in our study were relatively smaller in spatial extent when compared to the entire field (∼0.15 km2), this account for the lower percentage of points assigned as ‘1′.
The datasets were then divided into train and test templates for both dependent and independent variable. The training dataset is used to build a model by selecting optimum data of a specific class. The model is run on trained data and then fitted to make probability-based predictions of surface deformation occurrences on the test dataset. The predicted outcome variables hold the value either class 0 (no deformation) or class 1 (deformation). The accuracy of the model’s train and test sets for all three sites was checked using the confusion matrix, graphically represented as scatter plots in . The two distinct class labels (0 or 1) were discriminated along the prediction line. The performance of BLR model was cross-validated using statistical parameters such as Accuracy, Sensitivity or Recall, True-negative rate or Specificity, and Precision derived from the confusion matrix results. The values of statistical parameters vary between 0 and 1, and values closer to 1 indicate the adequate performance of the model. The confusion matrix and cross-validated results for BLR based prediction are given in .
Figure 12. The graphically represented confusion matrix showing the accuracy of train and test sets used in Binary Logistic Regression (BLR) to determine contextual relationship between coal fire and land subsidence for all three selected test sites.
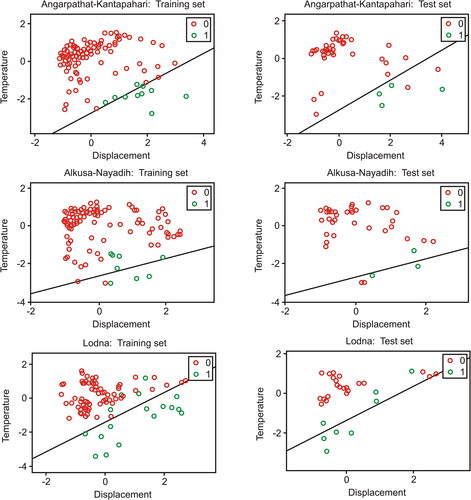
Table 2. Confusion matrix and cross-validation results for BLR based prediction of surface deformation in JCF. TP (true positive) and TN (true negative) refers to the correctly predicted points with ‘deformation’ and ‘no deformation’ occurrences, respectively. FP (false positive) and FN (false negative) are the points incorrectly predicted as the ‘deformation’ and ‘no deformation’ occurrences, respectively. Sensitivity or Recall indicate the positive values correctly predicted positive in the total outcome, whereas Specificity indicates the negative values correctly predicted negative in the total outcome. Precision is how often optimistic prediction has made concerning total predicted positive.
Since, true-positive and true-negative values show even class distribution, the accuracy is used to infer the model’s performance (). The accuracy is defined by the total correctly predicted classes (0 or 1) by the model concerning the total number of predicted outcomes. The overall accuracy of the predicted outcome variable for all three sites ranges near ∼0.90. The results indicate that the BLR predict the probability of surface deformation in response to the coal seam fire at the subsurface with reasonably acceptable accuracy. High Recall or Sensitivity demonstrates that the model predicts the ‘deformation occurrences’ with high precision in Angarpathar-Kantapahari area. However, in Alkusa-Nayadih and Lodna, as indicated by high Specificity values, the model accurately predicted the ‘no deformation occurrences. It is because the large extent of these areas is occupied by overburden dump with low to mioderate thermal anomaly, which is not enough to classify the predicted variables in class 1.
6. Conclusion
In this study we tried to understand the nature of coal fires in the context of JCF by observing its manifestations, i.e. LST and vertical subsidence, and the spatial relationship they have with each other. However, we do acknowledge the fact that such dynamic process has multiple manifestations and a more precise study would be when all of those manifestations would be envisaged simultaneously through Multiple Logistic Regression. But until then, the method and tool used here is robust in nature and could provide useful input for implementing precise mitigation measures in-response-to coal fires related land subsidence in JCF. Following are the list of observations that have been deduced from the present study.
The total coal fire-affected area in Jharia coalfield was around 14.6 km2. In the selected blocks for the present study, viz., Angarpathar-Kantapahari, Alkusa-Nayadih and Lodna, the spatial extent of the affected areas was around 2.44 km2, 4.25 km2, and 1.17 km2, respectively. The thermally abnormal regions showed a significant pattern of decreasing intensity from the source. Low-intensity thermal anomalies were observed mainly in the south and southwestern part of JCF, and could be the response of either reasonably large dump fire or the increase in the depth of the burning coal seam.
The displacement values in the affected areas are highly variable and range between 80-120 mm/yr with a total spatial extent of ∼19.8 km2. The SBAS-InSAR result show a measurable deformation estimates well developed around Katras, Sijua, Pootkee Balihari, Kustore, and Lodna coal mine areas. The variation in the degree of deformation in JCF is due to the presence of opencast mines and large-scale overburden dumps. In and around opencast, the results showed low to high deformation gradient over a small aerial extent. The deformation sites at the overburden dump sites were considerably broad, regular and invariable in areal extent. It was also observed that the patterns of deformation at the corresponding mines itself vary significantly with time.
The spatial distribution of thermal anomaly (∼14.6 km2) and deformation troughs showing LOS displacement (∼19.8 km2) is commensurable and approximates each other, thereby indicating that the subsidence in JCF is generated in response to the surface-subsurface coal fires. This close association of thermal anomaly and LOS displacement in the opencast implies that the LST is a statistically significant independent variable and can explain the spatial extent of mine subsidence in the test sites.
The categories of subsidence were evaluated using the scatter plot drawn between LST and mean LOS deformation velocity. At active coal mines, it was observed that high thermally anomalous values were corresponding to varied degree of displacement. This relation could be the result of variations in depth of coal seam and stages of combustion. Whereas, at overburden dumps, low to moderate thermal values were corresponding to high degree of displacement owing to the additive compression inducted along with the volume reduction at the subsurface. The contextual relationship between LST and mean LOS displacement is further estimated using BLR which predicted the presence and absence of surface deformation. The categorical outcome shows a good relation between LST and mean LOS displacement. However, the deformation in response to high-temperature shallow subsurface fire is highly localized at modest size active mine areas.
Since the area is highly dynamic due to the extent of active fire and intense mining, the TIR and DInSAR-derived results were verified using a handheld GPS survey to determine the locales of coal fire and land subsidence areas in JCF. The fire affected areas are often inaccessible in JCF; therefore due to safety purpose, periodic surveys cannot be executed due to intense fire and subsidence. Eventually, it makes it challenging to generate the DGPS, extensometer and levelling data for precise validation of the InSAR-derived results. Also, no GNSS data is available for this region on any global platform. We agreed that the validation with precision levelling or other advanced measures would give better insight into the problem. But due to pre-required administrative permission and safety purposes, GPS/GNSS-based data in JCF has not been generated and results were verified with field-based observation.
Comparing results from DInSAR-derived time series displacement estimates and TIR-derived Land Surface Temperature is difficult due to their sporadic nature of subsurface coal fires. Coarse spatial resolution TIR dataset (100m x 100m) always accompanied the mixed pixel problem. Also, due to the influence of atmospheric heating, TIR data acquired during winter is suitable for LST estimation. Since in JCF the propagation of is under structural control which can be seen along the dip of the coal seam due south. Lateral propagation along the strike has ceased due to numerous strike-slip faults. As a result, the extent of coal fire and related subsidence is in close approximation. However, the foremost step to determining the relationship is the time overlapping of the acquired satellite dataset. Therefore, analysis performed over the closest acquired multi-sensor datasets will give fruitful results for highly dynamic areas such as JCF. Subsidence observation determined using a single interferogram may also give misleading results as new deformation hotspots are challenging to observe. Mine benches are more prone to subsidence in response to subsurface fire and active mine. Therefore, the dataset acquired over a large temporal period would have significantly contributed to measuring the long-term changes in LOS displacement and eliminating the errors due to active mining.
Supplemental Material
Download (5.4 MB)Acknowledgements
The authors would like to thank the Alaska Satellite Facility-Distributed Active Archive Center (ASF-DAAC) for providing multiple scenes of Sentinel-1A data. We also express our gratitude to DST-SERB, New Delhi, for providing financial support to conduct this research (EEQ/2018/000/828). We also thank anonymous reviewers for their suggestions and valuable comments that helped to improve the manuscript.
Disclosure statement
No potential conflict of interest was reported by the authors.
Data availability statement
The authors confirm that the data supporting the findings of this study are available within the article [and/or] its supplementary materials.
Additional information
Funding
Notes on contributors
Ashwani Raju
Ashwani Raju: Conceptualisation, Supervision, Methodology design, Data analysis and interpretation, Writing—original draft. Kamran Mehdi: Data analysis and interpretation, Writing—original draft.
References
- Acharyya SK. 2000. Coal and lignite resources of India-An overview. Bangalore: Geological Society of India.
- Barsi JA, Schott JR, Palluconi FD, Helder DL, Hook SJ, Markham BL, Chander G, O'Donnell EM. 2003. Landsat TM and ETM + thermal band calibration. Can J Remote Sens. 29(2):141–153.
- Bharat Coking Coal Limited (BCCL). 2008. Master plan for dealing with fire, subsidence and rehabilitation in the leasehold of BCCL. [accessed 2022 March 22]. http://www.bcclweb.in/PDFs/MPLANBCCL-2008.pdf.
- Borah SB, Chatterjee RS, Thapa S. 2017. Detection of underground mining induced land subsidence using Differential Interferometric SAR (DInSAR) in Jharia coalfields. ADBU-J Eng Tech. 6(2):00602621.
- Bui DT, Shahabi H, Shirxadi A, Chapi K, Pradhan B, Chen W, Khosravi K, Panahi M, Ahmad BB, Saro L. 2018. Land subsidence susceptibility mapping in South Korea using machine learning algorithms. Sensors. 18(2464):1–20.
- Cao L, Zhang Y, He J, Liu G, Yue H, Wang R, Ge L. 2008. Coal mine land subsidence monitoring by using spaceborne InSAR data: a case study in Fengfeng, Hebei Province, China. Presented at the ISPRS Congress, Beijing, P.R. China, 2008. The International Archives of the Photogrammetry, Remote Sensing and Spatial Information Sciences; Jul 3-11; Beijing, China: p. 255–261.
- Chatterjee R, Thapa S, Singh KB, Varunakumara G. 2015. Detection, mapping and monitoring of land subsidence in JHaria Coalfield, Jharakhand, India by spaceborne differential interferometric SAR, GPS and precision levelling techniques. J Earth Sys Sci. 124(6):1359–1376.
- Chatterjee RS, Singh KB, Thapa S, Kumar D. 2016. The present status of subsiding land vulnerable to roof collapse in the Jharia Coalfield, India, as obtained from shorter temporal baseline C-band DInSAR by smaller spatial subset unwrapped phase profiling. Int J Remote Sens. 37(1):176–190.
- Chatterjee RS, Singh N, Thapa S, Sharma D, Kumar D. 2017. Retrieval of land surface temperature (LST) from landsat TM6 and TIRS data by single channel radiative transfer algorithm using satellite and ground-based inputs. Int J App Earth Obs Geoinf. 58:264–277.
- Crosetto M, Monserrat O, Cuevas-Gonzalez M, Devanthery N, Crippa B. 2016. Persistent scatterer interferometry: a Review. ISPRS J Photogram Remote Sens. 115:78–89.
- Ferretti A, Prati C, Rocca F. 2000. Nonlinear subsidence rate estimation using permanent scatterers in differential SAR interferometry. IEEE Trans Geosci Remote Sens. 38:2202–2212.
- Finkelman RB, Greb SF. 2008. Environmental and health impacts. In: Suárez-Ruiz I, Crelling JC, editor. Applied coal petrology: the role of petrology in coal utilization. Amsterdam: Academic Press; p. 263–287.
- Ghasemi E, Gholizadeh H. 2019. Development of two empirical correlations for tunnel squeezing prediction using binary logistic regression and linear discriminant analysis. Geotech Geol Eng. 37(1–2).
- Gielisch H, Kuenzer C. 2007. Innovative technologies for exploration, extinction and monitoring of coal fires in North China, Work Package 2220- Structural pattern of the coal deposits (Wuda. Rujigou, Gulaben): analysis of linear pattern (Air Photos, Satellite Images). Coal fire research: a sino-german initiative. Online-Resource (22 S., 2,84 MB) Ill., Kt. https://doi.org/10.2314/GBV:545687780.
- Gupta N, Syed TH, Athiphro A. 2013. Monitoring of subsurface coal fires in Jharia coalfield using observations of land subsidence from differential interferometric synthetic aperture radar (DInSAR). J Earth Sys Sci. 122:1249–1258.
- Gupta RP, Prakash A. 1998. Reflectance aureoles associated with thermal anomalies due to subsurface mine fires in the Jharia coalfield, India. Int J Remote Sens. 19(14):2619–2622.
- Hosmer DW, Lemeshow S. 2000. Applied logistic regression. 2nd ed. New York (NY): Wiley.
- Indian Minerals Yearbook (IMY). 2019. Coal & lignite, Indian minerals yearbook, 2019. 58th ed. Nagpur, India: Government of India, Ministry of Mines, Indian Bureau of Mines.
- Jiang L, Lin H, Ma J, Kong B, Wang Y. 2011. Potential of small-baseline SAR interferometry for monitoring land subsidence related to underground coal fires: Wuda (Northern China) case study. Renote Sens Environ. 115:257–268.
- Karanam V, Motagh M, Garg S, Jain K. 2021. Multi-sensor remote sensing analysis of coal fire induced land subsidence in Jharia Coalfields, Jharkhand, India. Int J Earth Obs Geoinf. 102:102439.
- Kim AG. 2011. Coal formation and the origin of coal fires. In: Stracher GB, Prakash A, Sokol EV, editors. Coal and peat fires: a global perspective. New York (NY): Elsevier; p. 1–28.
- Kuenzer C, Stracher GB. 2012. Geomorphology of coal seam fires. Geomorphology. 138(1):209–222.
- Kuenzer C, Zhang J, Tetzlaff A, van Dijk P, Voigt S, Mehl H, Wagner W. 2007. Uncontrolled coal fires and their environmental impacts: investigating two arid mining regions in north-central China. App Geography. 27(1):42–62.
- Kumar S, Kumar D, Chaudhary SK, Singh N, Malik KM. 2020. Land subsidence mapping and monitoring using modified persistent scatterer interferometric synthetic aperture radar in Jharia Coal Belt, India. J Earth Sys Sci. 129(146).
- Lahiri-Dutt K. 2014. The coal nation, histories, ecologies and politics of coal in India. London: Taylor & Francis.
- Lee S, Kim K, Oh H-J, Park N-W. 2006. Ground subsidence hazard analysis in an abandoned underground coal mine area using probabisltic and logistic regression models. IEEE Int Sym Geosci Remote Sens:1549–1552. https://doi.org/10.1109/IGARSS.2006.399.
- Liu J, Wang Y, Yan S, Zhao F, Li Y, Dang L, Liu X, Shao Y, Peng B. 2021. Underground coal fire detection and monitoring based on Landsat-8 and Sentinel-1 Data Sets in Miquan Fire Area, XinJiang. Remote Sens. 13:1141.
- Loesch E, Sagan V. 2018. SBAS analysis of induced ground surface deformation from wastewater injection in East Central Oklahoma, USA. Remote Sens. 10(2):283.
- Ma C, Cheng X, Yang Y, Zhang X, Guo Z, Zou Y. 2016. Investigation on mining subsidence based on multi-temporal InSAR and time-series analysis of the small baselinzhee subset-case study of working faces 22201-1/2 in Bu’ertai Mine, Shendong Coalfield, China. Remote Sens. 8(11):951.
- Mahagaonkar AV. 2019. Glacier surface velocity estimation & facies classification using InSAR and multi-temporal SAR techniques in Indian Himalaya. Enschede, The Netherlands: Faculty of Geo-Information Science and Earth Observation of the University of Twente.
- Majumdar R. 2013. Environmental monitoring of Jharia Coalfield, Jharkhand, India, using multi-polarization SAR and interferometric SAR data [master's thesis]. Dehradun: Indian Institute of Remote Sensing, Dehradun: Indian Space Research Organization. Dept. of Space: Govt. of India.
- Martha TR, Guha A, Kumar KV, Kamaraju MVV, Raju EVR. 2010. Recent coal-fire and land-use status of Jharia Coalfield, India from satellite data. Int J Remote Sens. 3(12):3243–3262.
- Mishra RK, Pandey JK, Pandey J, Kumar S, Nath P, Roy S. 2020. Detection and analysis of coal fire in Jharia Coalfield (JCF) using landsat remote sensing data. J Ind Soc Remote Sens. 48:181–195.
- Paul S, Chatterjee R. 2011. Mapping of cleats and fractures as an indicator of in-situ stress orientation, Jharia coalfield, India. Int J Coal Geol. 88:113–122.
- Pawluszek-Filipiak, Borkowski A. 2020. Integration of DInSAR and SBAS techniques to determine mining-related deformations using sentinel-1 data: the case study of Rydułtowy Mine in Poland. Remote Sens. 12(2):242.
- Pradhan B. 2010. Remote sensing and GIS-based landslide hazard analysis and cross-validation using multivariate logistic regression model on three test areas in Malaysia. Adv Space Res. 45(2010):1244–1256.
- Prakash A, Gens R. 2010. Remote sensing of coal fires. In: Stracher GB, Prakash A, Sokol EV, editors. Coal and peat fires: a global perspective, Volume 1, Coal - combustion and geology. Oxford: Elsevier; p. 231–253.
- Przyłucka M, Herrera G, Graniczny M, Colombo D, Béjar-Pizarro M. 2015. Combination of conventional and advanced DInSAR to monitor very fast mining subsidence with TerraSAR-X Data: Bytom City (Poland). Remote Sens. 7(5):5300–5328.
- Raju A, Gupta RP, Prakash A. 2012. Delineation of coalfield surface fires by thresholding Landsat TM-7 day-time image data. Geocarto Int. 28(4):343–363.
- Raju A, Nanda R, Singh A, Malik K. 2022. Multi-temporal analysis of groundwater depletion-induced land subsidence in Central Ganga Alluvial plain, Northern India. Geocarto Int. https://doi.org/10.1080/10106049.2022.2060322.
- Raju A, Singh A, Kumar S, Pati P. 2016. Temporal monitoring of coal fires in Jharia Coalfield, India. Environ Earth Sci. 75(989).
- Ray S. 2017. Jharkhand: yourstory; [accessed 10 March 2022]. https://yourstory.com/2017/06/jharia-coal-fire/.; 2017. Burning for over 100 years, Jharkhand’s underground fire affects 5 lakh people.
- Riyas MJ, Syed TH, Kumar H, Kuenzer C. 2021. Detecting and analyzing the evolution of subsidence due to coal fires in Jharia coalfield, India using sentinel-1 SAR data. Remote Sens. 13(8):1521.
- Sekertekin A, Bonafoni S. 2020. Land surface temperature retrieval from landsat 5, 7, and 8 over rural areas: assessment of different retrieval algorithms and emissivity models and toolbox implementation. Remote Sens. 12(02):294.
- Sengupta N. 1980. A revision of the Geology of the Jharia Coalfieldwith particular reference to distribution of coal seams. Dhanbad: Indian School of Mines.
- Singh A, Raju A, Pati P, Kumar N. 2017. Mapping of coal fire in Jharia Coalfield, India: a remote sensing based approach. J Ind Soc Remote Sens. 45:369–376.
- Singh N, Chatterjee RS, Kumar D, Panigrahi DC, Mujwadiya R. 2022. Retrieval of precise land surface temperature from ASTER night-time thermal infrared data by split window algorithm for improved coal fire detection in Jharia Coalfield, India. Geocarto Int. 37(3):926-943.
- Singh RVK. 2013. Spontaneous heating and fire in coal mines. Proc Eng. 62:78–90.
- Stow R, Wright P. 1997. Mining subsidence land survey by SAR interferometry. Proceedings of 3rd ERS Symposium on Space at the Service of Our Environment; Florence: ESTEC Publishing Division, ESA. p. 525–530.
- Stracher GB, Taylor TP. 2004. Coal fires burning out of control around the world: thermodynamic recipe for environmental catastrophe. Int J Coal Geol. 59:7–18.
- Strozzi T, Wegmüller U, Tosi L, Bitelli G, Spreckels V. 2001. Land subsidence monitoring with differential SAR interferometry. Photogram Eng Remote Sens. 67(11):1261–1270.
- Wang Z, Zhang J, Yu Y, Liu J, Liu W, Jiang N, Guo D. 2021. Monitoring, analyzing, and modeling for single subsidence basin in coal mining areas based on SAR interferometry with L-band data. Sci Program. 2021(6662097):1–10. https://doi.org/10.1155/2021/6662097.
- Woodhouse IH. 2006. Introduction to microwave remote sensing. Boca Raton (Florida): CRC Press, Taylor & Francis.
- Yu B, She J, Liu G, Ma D, Zhang R, Zhou Z, Zhang B. 2022. Coal fire identification and state assessment by integrating multitemporal thermal infrared and InSAR remote sensing data: A case study of Midong District, Urumqi, China. ISPRS J Photogramm Remote Sens. 190:144–164.
- Yu X, Guo X, Wu Z. 2014. Land surface temperature retrieval from landsat 8 TIRS-comparison between radiative transfer equation-based method, split window algorithm and single channel method. Remote Sens. 6:9829–9852.
- Yue H, Liu G, Guo H, Li X, Kang Z, Wang R, Zhoung X. 2011. Coal mining induced land subsidence monitoring using multiband spaceborne differential interferometric synthetic aperture radar data. J App Remote Sens. 5(1):053518.
- Zheng L, Zhu L, Wang W, Guo L, Chen B. 2020. Land subsidence related to coal mining in China revealed by L-band InSAR analysis. Int J Environ Res and Pub Health. 17(4):1170.
- Zhou L, Zhang D, Wang J, Huang Z, Pan D. 2013. Mapping land subsidence related to underground coal fires in the Wuda coalfield (Northern China) using a small stack of ALOS PALSAR differential interferograms. Remote Sens. 5:1152–1176.