
 ?Mathematical formulae have been encoded as MathML and are displayed in this HTML version using MathJax in order to improve their display. Uncheck the box to turn MathJax off. This feature requires Javascript. Click on a formula to zoom.
Abstract
A hybrid machine learning method is proposed for wildfire susceptibility mapping. For modeling a geographical information system (GIS) database including 11 influencing factors and 262 fire locations from 2013 to 2018 is used for developing an integrated multivariate adaptive regression splines (MARS). The cat swarm optimization (CSO) algorithm tunes the parameters of the MARS in order to generate accurate susceptibility maps. From the Pearson correlation results, it is observed that land use, temperature, and slope angle have strong correlation with the fire severity. The results demonstrate that the prediction capability of the MARS-CSO model outperforms model tree, reduced error pruning tree and MARS. The resulting wildfire risk map using MARS-CSO reveals that 20% of the study areas is categorized in the very low wildfire risk class, whereas 40% is under the very high class of fire hazard.
1. Introduction
Wildfires is a natural agent affecting land cover and plays an important role in regeneration of flora and maintaining the health of ecosystems. The number of fires occurring as a result of human inattention has risen significantly, leading to danger in forests and has been increased across the world over the last decade (Schoennagel et al. Citation2004). Climatic changes, such as higher temperatures, less rainfall, longer dry seasons, as a result of human interventions, in many regions of the planet, the extent and number of forest fires have increased to a worrisome level (Foster, 2001). Many bush and forest fires extending across thousands of hectares have occurred in Iran annually. Such incidents are not new, but the number of fires in this year is higher than that in 2019 by 2.5%. As reported by the Forests, Range and Watershed Management Organization of Iran, forest fires were frequent in Iran, leading to the loss of 5000 to 6000 hectares of forest area per year (Adab et al. Citation2013). Besides, many other counties around the globe were also experiencing these incidents (Marchal et al. Citation2017; Herawati and Santoso Citation2011; Wu et al. Citation2015; Schweizer and Cisneros Citation2017; Yao et al. Citation2018; Tariq et al. Citation2021; Tariq et al. Citation2022). Owing to the devastating effect of forest fire on ecosystems and the socioeconomic situation, preventing and suppressing this phenomenon have turned to a shared priority of governments and scientists across the globe (Nami et al. Citation2018). Establishing an efficient fire suppression and prevention strategy requires drawing a fire susceptibility map at a local scale. Such maps not only render it easier to properly allocate resources required for preventing and suppression fires but also hugely help land use planning (Bax and Francesconi Citation2018; Naderpour et al. Citation2019; Abedi Gheshlaghi et al. Citation2020).
Nowadays, geographic information system (GIS) and remote sensing (RS) data contribute significantly to natural risk assessment, especially in terms of developing forest fire susceptibility maps (Vahidnia et al. Citation2010; De Moel et al. Citation2014; Rezaie-Balf et al. Citation2022). Through GIS, many processes such as capturing, managing, analyzing, and presenting geographic data can be performed with ease. The ability to display several information layers on a single GIS-based map allows the assessment of forest fire risk of an area taking into account several effective factors such as vegetation, climate, topography, as well as human-related factors (Nami et al. Citation2018). For generating artificial intelligence (AI) models, the spatial relationship between these factors and the historical fire inventory of the region can be employed, leading to precise forest fire susceptibility mapping (FFSM) for all parts on the region (Bui et al. Citation2017). Accordingly, the preferred AI algorithms include artificial neural network (ANNs) (Zhao et al. Citation2018), boosted regression trees (BRT) (Van Boeckel et al. Citation2012), neuro-fuzzy inference system (ANFIS) (Wang et al. Citation2019), naïve Bayes (NB) (Khosravi et al. Citation2019), decision trees (DT) (Tehrany et al. Citation2019), boosted regression trees (BRT) and evidential belief function (EBF) (Shafizadeh-Moghadam et al. Citation2018; Rahmati and Pourghasemi Citation2017), multivariate adaptive regression splines (MARS), support vector machine (SVM) (Tehrany et al. Citation2015), generalized linear model (GLM) (Vandenberg‐Rodes et al. Citation2016), maximum entropy (Maxent), and random forest (RF) (Rahmati and Pourghasemi Citation2017).
AI-based techniques as well as advanced data-driven methods for modeling the natural hazards, e.g., (Abedi Gheshlaghi et al. 2020, Argañaraz et al. 2015, Bui et al. 2020, Dodangeh et al. 2020, Ghorbanzadeh et al. 2019, Hosseini et al. 2020, Huebner et al. 2012, Khosravi et al. 2018, Littell et al. 2016, Motazeh et al. 2013, Nasi et al. 2002, Podur et al. 2003, Sajedi-Hosseini et al. 2018) had been reported to be robust for spatially prediction of naturally occurring phenomena and creating susceptibility mapping. However overfitting, uncertainty, lack of memory, etc. are of their common drawbacks that were not fully considered in many literatures. In forest fire susceptibility research, the recent trend has included the combination or integration of the above approaches to produce hybrid or ensemble models instead of employing single ones. For example, Sachdeva et al. (Citation2018) suggested using evolutionary optimized gradient boosted decision trees (EO-GBDT) to develop wildfire susceptibility maps for the research region, including the districts of Chamoli, Bageshwar, and Pithoragarh. According to the outcomes of their research, EO-GBDT generated susceptibility maps with an accuracy of 95.5%, exceeding the accuracy of previous AI models. Gigović et al. (Citation2019) utilized a novel ensemble model based on SVM and RF to map the susceptibility of the tara national park in Serbia to forest fires. They determined 126 forest fire occurrence areas among alternative sources using satellite images, aerial photos, and comprehensive field surveys. Comparing the performance of the suggested ensemble model employing the Bayesian average to that of the standalone AI models, they determined that the ensemble model seemed to have the greatest results. Tuyen et al. (Citation2021) used a locally weighted learning (LWL) approach in conjunction with cascade generalization (CG), bagging, decorating, and dagging ensemble learning strategies to determine FFSM in the Pu Mat National Park. Computational results have shown that the CG-LWL and Bagging-LWL models with AUC = 0.993 had the highest training performance for predicting the spatial pattern of FFSM across the study area. Mabdeh et al. (Citation2022) employed two evolutionary algorithms, the genetic algorithm (GA) and the shuffled frog-leaping algorithm (SFLA), to optimize the hyperparameters of SVM and ANFIS models for forest fire susceptibility and risk mapping in northern Jordan. The research’s findings indicate that the evolutionary-based SVR models had AUC values approximately 5% greater than the ANFIS-based models.
The performance of MARS is susceptible to three hyper-parameters, including the maximum number of BFs (Mmax), penalty parameter (c), and maximum interaction between variables (Imax). Rezaie-Balf et al. (Citation2019) reported that these hyper-parameters control the complexity and generalization of MARS. Therefore, the determination of such hyperparameters is crucial for the MARS prediction’s accuracy. The hyper-parameters, as mentioned above, vary over a wide range, and their optimal values are problem-specific. To accomplish this, it is possible to represent the task of identifying MARS' parameters as continuous domain optimization problems. The cat swarm optimization (CSO) method was employed in the current work to optimize the abovementioned hyperparameters of the MARS model for the aim of mapping wildfire susceptibility owing to its great accuracy and efficiency in large-scale handling issues.
In light of the discussion mentioned earlier, the main objective of the present work is to establish a accurate hybrid model to provide wildfire susceptibility maps in the western section of Zagros Mountains in Chaharmahal and Bakhtiari province, Iran. From the literature, multiple optimization and machine learning algorithms have been utilized for the spatial modeling of wildfire across the globe; however, cat swarm optimization (CSO), to the best of the authors’ knowledge, has not been previously examined to address wildfire mapping. The western Zagros mountains which is a fire-prone area in southwestern Iran is chosen as the area under study to collect and generate datasets for the modeling procedure. Additionally, various quantitative techniques are employed for model validation and comparison, including statistical metrics and the receiver operating characteristic (ROC) curve. To develop strategies to avoid fires or to utilize specialized techniques for controlling existing fires, such maps might be utilized for early warning, fire suppression resource planning, and allocation works, particularly in Iran.
2. Study area
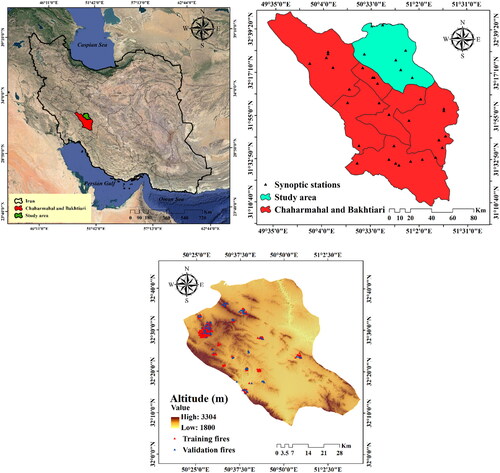
The region under study is in the western section of Zagros Mountains in Chaharmahal and Bakhtiari province, Iran, which is located in the latitude range of 32′ 6° N-32′ 43° N and the longitude range of 50′ 20° E-51′ 11° E. It is mainly an elevated mountainous region with a size of around 2933 km2 (0.2933 ha). The region has minimum and maximum altitudes of 1800 and 3304 m, respectively. The mean slope angle is 15°, ranging from 0 to 69.39° (Termeh et al. Citation2018). The annual temperature mean in Chaharmahal and Bakhtiari Province is 11.5 °C. It has a moderate semi-humid climate with mild summers and severe winters. The annual rainfall mean level varies from 1400 mm in the northwestern to 250 mm in the eastern and southeastern sectors, with a mean of 560 mm (Jaafari et al. Citation2018). The coldest month in this region is January, with August being the hottest. The vegetation of majority of this region consists of Quercus persica, Olea europaea L, Crataegus aronia, Pistacia khinjuck, and Prunus dulcis plants. Fire incidents mostly happen in the dry season lasting from July to August (Fallah-Zazuli et al. Citation2019). In this area, land cover pattern includes forest (21%), agricultural area (24%), pasture (52%), urban (2%), and bare land (1%). shows the region under study as well as the locations of fire incidents.
Figure 1. Location of the study area along with wildfire inventory map.
3. Material and methods
3.1. Inventory map of wildfire
It is known that two main groups of data are necessary to conduct the susceptibility analysis of any natural incident, such as flash flood, landslide, and wildfire; these data are related to independent and dependent factors. An inventory map that shows the location of the past incidents generally presents the dependent factor. Thus, an essential step toward susceptibility analysis is to prepare a valid inventory map of wildfire. The most efficient technique for gathering these data has not been found yet (Gigović et al. Citation2019). The fire inventory map of the region under study is extracted from the literature (Nami et al. Citation2018; Pourghasemi; Pourtaghi et al. Citation2016). Afterwards, to prepare the spatial database, the ignition sources associated with this period are utilized. According to a number of semi-official accounts, past fire incidents are mostly caused by natural factors, together with arson (at the forest-farmland interface) (Jaafari et al. Citation2019). Data about past fires are derived and analysis from various sources, including the Natural Resource Bureau of Chaharmahal and Bakhtiari province, MODIS hot spot products (http://earthdata.nasa.gov/firms) satellite images, and surveying information in the period of 2013-2018. In total, 262 marked wildfire points were obtained, of which 70% (183 incidents) are employed for training the applied models and the other 30% (79 incidents) for testing the model. Moreover, to establish the no-fire dataset, 262 points are chosen randomly from regions that have never experienced any fire events. The no-fire data-set is separated into the training and testing samples in a similar manner (). It is worth mentioning that the division of all the fire and no-fire points into the mentioned sets is conducted in a random manner.
3.2. Wildfire conditioning factors
Topographical factors including altitude, slope angle, and slope aspect are recognized to affect the incidence of fire. Topographic features and the wind direction were also reported to affect the probability of fire in the region (Jaiswal et al. Citation2002). The digital elevation model (DEM) of the region is developed using the images of ASTER satellite with a 30-meter spatial resolution. Afterwards, the ArcGIS10.3 software is used to prepare a map of altitude, slope angle, and slope aspect. Changes in altitude affect the vegetation and temperature; given that regions located at a higher altitude are generally more humid and colder, the fire probability has an inverse correlation with altitude (Chuvieco and Congalton Citation1989) (). In addition, the extent and direction of the fire are affected by the slope angle, such that the destruction level is generally greater in steeper slopes (Vadrevu et al. Citation2010) (). The amount of sunlight and heat affects the slope aspect and is relevant to the dryness of the vegetation in the area. In this regard, the southern and eastern faces generally receive the most sunlight and are thus more susceptible to fire (Chandra Citation2005; Razavi-Termeh et al. Citation2020) ().
Figure 2. Wildfire conditioning factors: (a) altitude, (b) slope angle, (c) slope aspect, (d) distance to roads, (e) distance to settlements, (f) rainfall, (g) air temperature, (h) wind effect, (i) land use/cover, (j) soil type, and (k) NDVI.
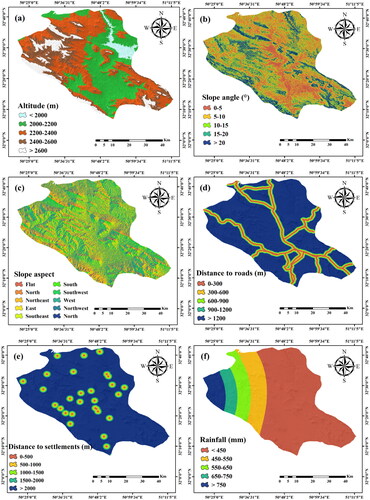
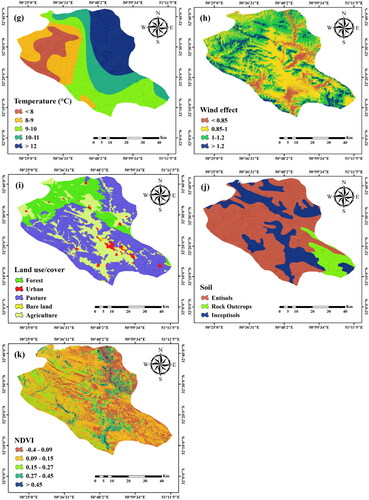
In recent decades, a population growth has been seen, which led to a significant invasion of the forested lands for supplies, fuel, and agriculture. People living near forests are dependent upon them (Jaafari et al. Citation2019). Another significant factor playing a role in forest fires is tourism (Arndt et al. Citation2013; Costafreda-Aumedes et al. Citation2018; Rodrigues et al. Citation2018). Hence, socio-economic factors selected here are distance to roads, distance to residential area, and land use. The probability of a fire is generally higher near roads (Pourtaghi et al. Citation2016). To address this, 1:100,000 topographic maps are used to prepare the map of roads in the study area, and buffers for the roads are specified at given intervals (). Another factor affecting the probability of forest fires is closeness to a settlement, e.g. rural and nomadic settlements. Given the dependency of residents on land and forest to supply their need, they may start unintentional or deliberate fires (Razavi-Termeh et al. Citation2020). In this regard, 1:100,000 topographic maps were used to prepare the map of distance from a settlement (). In addition, to prepare the land use/cover map, Landsat-7 images in the 2013-2018 period are employed. The land use/cover map was prepared by extracting 400 training points from the Global Positioning System (GPS). Out of these data points, 70% are employed to train and the other 30% were employed to assess the map accuracy. By utilizing maximum likelihood estimation with an accuracy of 91%, the land use/cover map is prepared and divided into five categories: forest, agricultural, grazing, wilderness, and urban areas ().
Climate directly and indirectly contributes to forest fires, while indirectly affecting the vegetation density and type (Vadrevu et al. Citation2010). Here, data gathered from 14 weather stations in Chaharmahal and Bakhtiari in the 2013-2018 period are used to extract the average annual rainfall, temperature, and wind speed and direction data. For preparing the temperature and rainfall maps, the Kriging interpolation technique is employed. To develop the wind effect map, Windward/Leeward indices are employed in the system for automated geoscientific analyses with (SAGA)-GIS software. The input of these indices includes the DEM, and wind speed and direction. A higher average temperature and a lower rainfall are generally responsible for an incidence of fire (). shows a summary of the mentioned variables, along with a description of the data and its corresponding sources.
Table 1. Detail information of data source.
3.3. Methods
3.3.1. Frequency ratio (FR)
Numerous effective parameters must be considered for developing a forest fire susceptibility map (Adab et al. Citation2013). Ten contributing variables to forest fires are integrated into GIS to develop a fire susceptibility map for the investigated area. These factors include altitude, slope angle, slope aspect, elevation, land use/cover, distance to road, distance to settlement, rainfall, temperature, wind speed, and soil. The existing vector data, including polygons, polylines, and points, are converted into raster layers. In addition, the frequency ratio (FR) theory is utilized for analyzing the spatial interactions of the fire and the sub-categories of contributing factors. As FR increases, a greater correlation is obtained between the fire and the considered sub-category (Termeh et al. Citation2018). Even though the relative FR has simple mathematical terms and an understandable conceptual procedure, its drawback is not considering variable interactions, which is a basic flaw of bivariate statistical models (Ozdemir, 2011). Therefore, given that FR cannot assign weights, comparing various factors with one another is not viable. Another weakness stems from the classification stage, mainly due to expertise. Thus, some bias may enter inevitably. By the superposition (overlay function) of contributing factors and forest fire inventory maps according to EquationEquation (7)(7)
(7) , the FR model was applied in ArcGIS 10.3.
3.3.2. M5 model tree (MT)
Quinlan was the first to introduce the MT technique (1992). Decision trees seem ideal for categorical data types; however, they may also be used for numerical data types. By applying linear regression models on the major leaf nodes (parent nodes), they were utilized to determine the appropriate relationship between the input and output variables (Heddam and Kisi Citation2018, Keshtegar et al. Citation2018).
To analyze the outcomes within the process, data sets are either linked with a leaf (parent node) or divided into subsets in MT, depending on the ‘divide-and-conquer’ strategy. In certain situations, such divisions result in complicated structures; hence, it is pruned back by a new subtree and leaf. The MT technique starts by calculating the data sets’ standard deviation (sd). Following that, they are separated to develop a decision tree. The second phase in the MT approach is pruning, which involves eliminating over-fitted results. Pruning methods depend on regression functions and may be used to eliminate sub-trees. These procedures are used to compute the standard deviation (error) (Talebi et al. Citation2017; Ghaemi et al. Citation2019),
(1)
(1)
Where sd represents standard deviation; T seems to be the set of examples that approach the node; Ti is the subset of patterns that have the ith result of the potential data set. The MT approach selects a node by evaluating all results that reduce the error. The ability to estimate the error in situations that have not been observed, use multivariate regression techniques in every node, minimize linear models to reduce error and smooth the projected value are all advantages of the MT approach.
3.3.3. Reduced error pruning tree (REPTree)
Reduced error pruning tree (REPTree) is a fast decision tree learning system based on the theory of information gain computation with entropy and variance error reduction (Mohamed et al. Citation2012; Kapoor et al. Citation2015; Pham et al. Citation2019). The technique’s pruning process seeks to produce the smallest version of the most accurate tree by post-pruning in response to the backward overfitting issue. The information gained from entropy, reduction in variance, and reduction in error pruning techniques affect the performance of this method. EquationEquation (3)(3)
(3) calculates information gain (IG) values based on the entropy function.
(2)
(2)
In consecutive pruning phases, the information gain considers all predictors of FSMs from the training dataset (N).
3.3.4. Multivariate adaptive regression splines (MARS)
The MARS model that was presented by Friedman (Citation1991), appears to be a non-parametric approach for the non-linear modeling of a knowledge system’s independent and dependent variables. It uses a regression-based intelligence algorithm for such an objective. The basis function (BF) is modified depending on the retrieved slope of the final model’s regression line (one spline to more). Every spline has an endpoint represented by a knot that denotes the start of one data area and the end of another.
Given the extraction of complicated data structures from multidimensional datasets, MARS can search for plausible scenarios across all degrees and gives a solution for variable interactions. In the next stage, a parameter could be studied further by describing the highest allowable degree of interaction (Imax). Generally, the first and second interaction orders are permissible; however, the facts may justify the usage of larger degrees of interaction. The general equation for the MARS function is as follows (Rezaie-Balf et al. Citation2019; Bateni et al. Citation2019),
(3)
(3)
Where M indicates the number of basis functions, x, and
are expected constant coefficients for achieving the optimal data fit, and f(x) is the projected response associated with predictor variable x. Applying the least square error approach, the constant coefficients
and
in EquationEquation (8)
(8)
(8) could be determined.
In MARS, BFs are generated via a stepwise search, and knot locations are determined using an adaptive regression approach. MARS uses the forward stage and the backward stage as its two-optimization phases. Many BFs are employed in the forward stage to minimize data overfitting. MARS uses the generalized cross-validation (GCV) approach to remove pruned BFs, avoiding over-fitting in the backward step. The GCV formula is shown below:
(4)
(4)
where M and N, respectively, are the number of BFs and the number of training data sets, and c represented penalty for each BF (Rezaie-Balf et al. Citation2017; Zawadzka et al. Citation2020).
3.3.5. Cat swarm optimization (CSO)
In cat swarm optimization (CSO) method, two cat behaviors, when resting and chasing prey, are emulated; these behaviors are referred to as searching and tracing mode. The solution space is used to randomly distribute a population of cats, with each cat’s mode (seeking or tracing) denoted by a flag (Orouskhani et al. Citation2013; Bahrami et al. Citation2018). For specifying the seeking mode, four main parameters including seeking memory pool (SMP), self-position consideration (SPC), seeking range dimension (SRD), counts of dimension change (CDC), are introduced according which the responsibility of the each parameters is specified in Ahmed et al. Citation2020. The processes described below are carried out throughout the seeking mode, according to Chu and Tsai (Citation2007) (Yusiong Citation2012; Ahmed et al. Citation2020):
J copies of the present place of catk are created (j = SMP). Next, j = (SMP – 1) is taken, and the present place is kept as a candidate in case the value of SPC is true;
For each copy, random dimensions depending on CDC are chosen for every cat. The SRD fraction of the current position’s value is added/subtracted to/from the chosen dimensions, and the previous location is replaced employing EquationEquation (5)
(5)
Where Xc is the present position; Xcn is a new position; R is a random value varying in the 0-1 range;
Each candidate point’s fitness (FS) values are computed;
The probability of selection is computed according to the following conditions, if the values of FS are not identical.
EquationEquation (6)(6)
(6) is calculated for each candidate point. Otherwise, the selection probability for each candidate point is 1.
(6)
(6)
In the above, Pi is the likelihood of the present candidate cati; FSi represents the fitness value of cati; FSmax and FSmin give the maximum and minimum fitness values, correspondingly; for minimization problems, FSb = FSmax, and maximization problems, FSb = FSmin; and
A point is randomly picked among the candidate points based on the probability values derived in the preceding step, and the position of catk has been replaced.
The chasing process of the cat is simulated in the tracing mode via the steps below:
The cat speeds are updated for all dimensions via EquationEquation (7)
Where c1 is a constant value and r1 is a random value between 0 and 1, Xbest;d denotes the cat’s best position in dimension d, Xk;d denotes the cat’s location in dimension d, and indicates the speed of catk in dimension d
It is determined whether the new speed is less than or equal to the maximum speed. If it exceeds the speed range, it is considered the maximum speed;
EquationEquation (8)(8)
(8) is used to update the positions of the cat,
(8)
(8)
Where Xk;d; new is the new location of catk in dimension d; and
New locations is identified by the fitness function, and the best cat is stored in memory.
3.3.6. Integrated MARS with CSO algorithm
In AI methods, determining the relevant parameters and optimal framework of the applicable prediction model seems to be a challenging and crucial task that might affect the accuracy and efficacy of the developed model. The issue arises because of the modeling concept’s complexity and the size of the obtained database. Examining the literature and searching for optimistic answers based on a restricted heuristic search is one method for determining the appropriate parameters. The trial and error operation is unreliable and could fail and provide unsatisfactory results due to the limited heuristic search.
Key parameters, including the penalty factor c, the maximum number of basis functions Mmax, and the order of interaction Imax are used to develop the MARS approach. Finding the optimum essential elements is challenging; however, finding the right parameters may greatly improve MARS modeling performance. An intelligent non-parametric model relying on the hybridization of CSO and MARS is proposed to aid scientists in addressing such challenging issues. While CSO could discover a global optimum, original MARS is more likely to converge at a local minimum. Consequently, the suggested CSO-based MARS model incorporates the capabilities of CSO and MARS, with CSO searching for optimum essential factors (c, Mmax, and Imax) in the search space. depicts the suggested hybrid MARS-CSO flowchart.
Figure 3. Methodological workflow for wildfire potential maps using CSO-based MARS and standalone models.
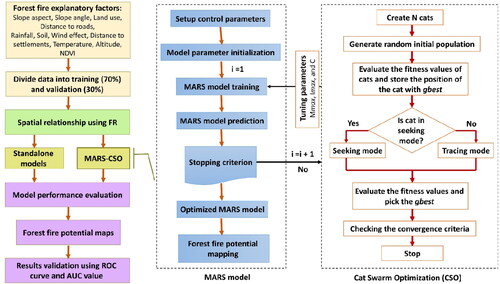
The CSO-based MARS model’s training process starts with initializing a population of cats, as demonstrated in . Within the search space, population positions of cats that symbolize the essential components of MARS are randomly allocated in this stage. The MARS integrated with CSO algorithm is then trained to utilize initial c, Mmax, and Imax values (initial position of cats). Then, the actual and anticipated values differences are computed. To reduce the calculated errors at every iteration, the position of the cats is updated. The process is repeated until the termination requirements are satisfied.
MARS is used throughout the CSO optimization process to develop a new model for every set of critical variables that each candidate solution has provided. The greedy selector in CSO is used to evaluate the models’ performance based on the fitness function. Once the calibration (training) step is complete, MARS is implemented for the validation (testing) dataset. To optimize performance, the goal function is to minimize prediction error (f),
(9)
(9)
Where, Etrain and Etest represent the 70-30% error in data evaluated during the training and testing stages, correspondingly.
As an error measurement, the mean square error (MSE) of prediction is developed to obtain a compromise between complexity and generalization. Consequently, the combination of training and testing errors might result in a model with the lowest MSE that is both optimistic and balanced. Candidate solutions are typically moved inside the search space during every iteration to reduce MSE. Subsequently, the MARS model is retrained, and the error is recalculated with the assistance of the updated set of important factors until an acceptable error is achieved. It should be mentioned that the search procedure’s termination condition is considered the maximum generation number (). Finally, the proposed prediction model has the optimal parameters ().
Figure 4. Training iteration versus prediction error of the proposed MARS model using CSO with various population sizes.
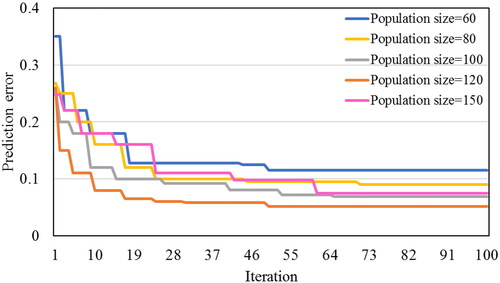
Table 2. Optimum values of hyperparameters of CSO algorithm and MARS model for wildfire susceptibility prediction.
4. Model performance assessment
4.1. Statistical metrics
In this study we employ Kappa index (k-index), standard error, accuracy (%), and 95% confidence level (95% CL) for assessing the prediction ability of models, together with classification precision, representing the model’s ability to correctly distinguish the fire pixels from nonfire pixels (Baratloo et al. Citation2015). The k-index evaluates the correlation of two raters, each classifying the total number of fire and nonfire locations in two exclusive fire and non-fire categories, respectively and as the nearly prefect agreement with the observation, the acceptable range of this metric is 0.8-1 (Tariq et al. Citation2021).
4.2. Evaluation results using ROC curve
After models’ accuracy verification, we use each significant fire predictor for estimating the wildfire probability.The significance of each incident predictor indicates an important output of standalone and hybrid models, finally helping compute the wildfire probability in the region under study. Rasters multiply each significant fire predictor after calculation. Afterwards, with the associated importance in ArcGIS Map Algebra function, all rasters sum up the probability of fire for each of the four models Thereafter, we use the receiver operating characteristics (ROC) curve, that indicates the ability of the hybrid model for the correct estimation of regions susceptible to wildfire, to assess the accuracy of the wildfire probability maps. We plot the sensitivity on y-axis versus the specificity on x-axis. Also, AUC represents the main statistical index of the ROC curve. The closer the AUC to 1, the higher the performance of the model. The calculation of this parameter is (Costache and Bui Citation2020),
(10)
(10)
where N and P represent the total number of non-fire and fire pixels, respectively.
5. Results
5.1. Model performance and results comparison
Before going to models’ development, we applied Pearson coefficient analysis in this section to indicate the prediction potential of various ignition factors. This will contribute to the elimination of irrelevant factors, which in turn can enhance the ability of prediction models (Tien Bui et al. Citation2016). depicts the relationship of different factors with the wildfire using the Pearson correlation method. From the , we found that land use/cover along with NDVI are the maximum predictive potential (0.461 and 0.438). The next contributing factors in order are temperature (0.395), slope angle (0.347), distance from settlements (0.276), altitude (0.269), and slope aspect (0.235). The findings are reasonable since land use is indirectly associated with vegetation, the main factor governing the fire potential.
Table 3. Predictive ability of the factors effective in wildfire by Pearson correlation analysis.
shows spatial relationships between explanatory variables and historical fire location using FR model. According to results related to the altitude factor, an area higher than 2400 m is predominantly susceptible to fire occurrences, and almost 76% of all wildfires are experienced in the research area. The maximum FR (1.67) for slope corresponds to slope angles between 15 and 20°. The southwest side has the highest FR (1.23) in the slope aspect factor. The maximum FR for distance from the road is between 300 and 600 meters (1.42).
Table 4. Performance results of the FR model for wildfire potential prediction.
Additionally, distance from the settlements showed a definite difference between areas situated within 1500 m (experiencing merely 5% of every fire) and that > 1500 m from the settlements, which is reported in literary works (Vilar et al. Citation2016). The spatial relationship between land use/cover type and historical fires revealed that pastures, which comprised 58% of the landscape and experienced 44% of all fires, are more prone to fire, indicating that human activities are prevalent in such areas.
shows the usability of the proposed MARS-CSO model compared with benchmark methods, namely MT, REPTree, and MARS. Based on results in the validation stage, the MARS, in which the CSO algorithm optimizes its hyperparameters, had higher accuracy (0.89%) and k-index (0.784) than those of the four benchmark methods. The proposed MARS-CSO model has the lowest standard error (0.067) for the validation dataset, followed by the MT (0.031), REPTree (0.0301), and MARS (0.0339). Previous studies support the outcomes of the present study on the reliability and robustness of integrative machine-learning approaches for environmental studies (Jaafari et al. Citation2019; Gholamnia et al. Citation2020).
Table 5. Accuracy assessment of the proposed models using the validating data.
Additionally, the accuracy of the wildfire susceptibility map is evaluated using the area under the curve (AUC), a synthetic metric derived for receiver operating characteristic (ROC) curves and broadly implemented in numerous types of study (). The AUC value, which ranges from 0.5 to 1, is the chance that a positive event will be assessed as positive using the test. According to , all of the obtained AUCs for proposed models in the validating (>80%) phase are highly accurate for the generated susceptibility maps of wildfires. In this regard, MARS-CSO with the maximum prediction accuracy for the fire incidents (89%) outperforms standalone MARS (84.3%). After this, REPTree (85.1%) demonstrates proper learning ability for the spatial relationship of fires and ignition sources. Thus, the prediction performance of the model employed in this study is superior to those used in previous works.
Figure 5. Receiver operating characteristics (ROC) curves for the proposed MARS-CSO and benchmark models.
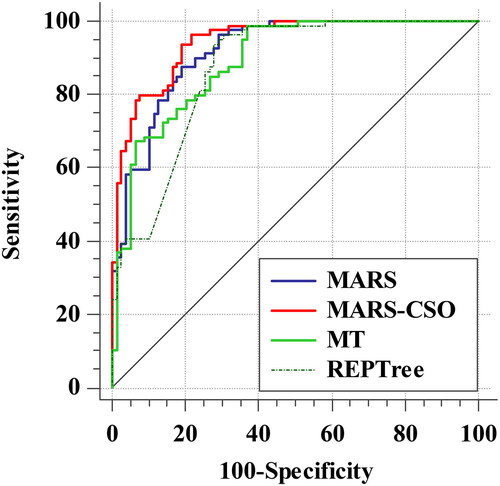
Despite the fact that different factors, such as environmental conditions, ignition sources, and computational parameters, need to be considered for comparing the present results with those of other works, MARS-CSO, the most powerful model in this study, can capture the relationship between fire incidents and ignition factors with a higher accuracy. The integrated proposed model was more accurate than the standalone MARS. Moreover, the hybrid MARS model coupled with CSO in this study demonstrates a better performance relative to both tree-based MT and REPTree models.
Furthermore, we apply the Chi-Square test to assess the statistical difference between wildfire susceptibility models. It is predicated on the ‘prior’ premise that there is no statistically significant difference between suggested AI models for mapping wildfire susceptibility (Tallarida and Murray Citation1987). The ‘prior’ hypothesis is not true. It, therefore, is rejected since the Chi-square values are more than 3.841 and the significant level value (p) is less than 0.05 (the threshold value), making the difference between the wildfire susceptibility models statistically significant (Kuncheva Citation2007). displays the Chi-square values and significance levels for several wildfire susceptibility models. As Chi-Square and significant level values are much higher than threshold values, we perceive that all models of wildfire susceptibility exhibit substantial variation.
Table 6. The Chi-square values and significant levels of different standalone and integrated AI models for wildfire susceptibility mapping.
5.2. Wildfire susceptibility map generation
In the next step, when the hyperparameters of MARS model are optimized with CSO algorithm in training and validating stages, we use the integrated MARS-CSO model along with other standalone classification and regression-based models to develop a susceptibility map of wildfire for the region under study in Chaharmahal and Bakhtiari province. For the purpose of developing the susceptibility maps, wildfire susceptibility indices created during the model development phase are employed to assign all pixels of the area under study.
In this study, we use the natural break approach to classify data’s spatial attributes based on the natural grouping inherent in the data. The natural break approach maximizes variance between groups and reduces within-class differences (making them as similar as possible) (and makes data classes as different as possible). The natural breaks classification identifies real classes within the data, which is a benefit. This is advantageous since it creates choropleth maps that accurately depict data trends. Therefore, for building final maps via the natural break classification method available in GIS software, we divide the obtained indices into five categories of wildfire susceptibility: very low, low, moderate, high, and very high (). This figure also shows the scattering of each susceptibility category on the maps developed using various methods.
Figure 6. Susceptibility map of wildfire for the area under study via a) MARS-CSO, b) REPTree, c) MARS, and d) MARS-CSO models.
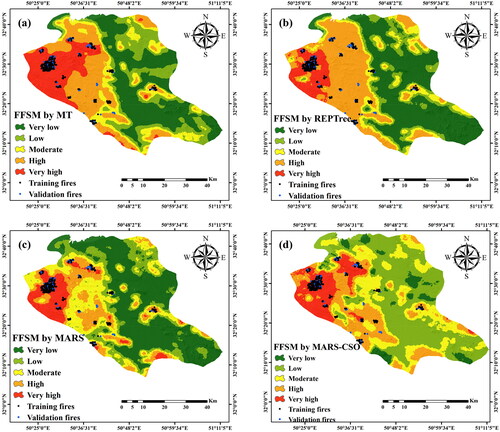
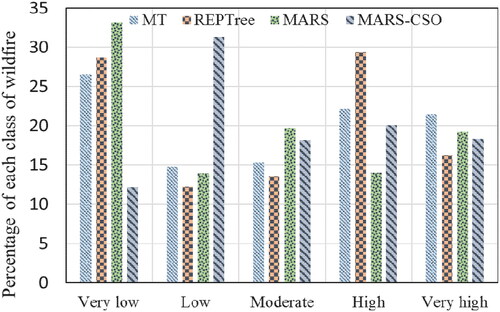
According to , an integrated MARS-CSO model demonstrates that about 20% of past wildfires are shown on the very high susceptibility category of the maps (17.31%). Evaluation of MT, REPTree, MARS models to predict fire inventory locations is carried out, and the generated wildfire maps for the pixel category with a very high susceptibility are 21.44, 16.23, and 19.19%. Although the models have different performances, all of them indicated that the low-lying areas in the western part of the region are most susceptible to fire, while the very low susceptibility areas are mainly distributed in the southern part. Therefore, nearly 40% of this area has high and very high fire susceptibility levels, indicating that mitigation measures, such as warning systems, and monitoring programs must mainly address these parts of the case study.
Figure 7. The susceptibility maps of wildfire natural hazard generated via MT, REPTree, MARS, and MARS-CSO.
6. Discussion
Every year with the onset of summer, Iran faces pasture fires that yearly devastate the country’s limited forest resources. Wildfire losses are projected to be equivalent to the entire area of reforestation. The location and related climatic conditions affect the fire season. For instance, the worst fire season occurs between March and September in central and southern Iran due to a rise in temperature and drought. In this sense, fire risk management must provide a precious tool/model for identifying the susceptibility of wildfire. As this phenomenon has a complicated and non-linear structure, it seems to be an intellectual challenge to estimate the probability of its recurrence using AI models (Ghavidel et al. Citation2016). The present study’s novelty and objective are using CSO as an optimization technique for finding optimum hyperparameters of the MARS model for modeling wildfire susceptibility mapping at a selected region of Chaharmahal and Bakhtiari province, Iran. To evaluate the performance of the proposed ensemble model, we implement two classification-AI models such as MT and REPTree to map the wildfire locations. For all standalone and hybridized AI models, the 70% (183 locations) wildfire occurrences are for training and 30% (79 locations) for test.
Depending on the spatial relationship established by the FR model between the effective factors and a fire location, it became clear that the highest value of RF for the altitude factor falls into the category of more than 2600 m, which could be connected to the proximity of the forests to the mountainous regions in the study area. The maximum FR in the slope angle factor for the class of 15–20 degrees, according to Pourtaghi et al. (Citation2016), stated that the likelihood of fires in sloped areas might rely on the higher vegetation density in this class. The important point relies on the proximity to roads is for fire occurrence reduction when the distance to a road increases, as proven by Jaafari et al. (Citation2018), and we can conclude that more wildfires occur in the zone closest to roads (the first 600-meters) than would be predicted by random distribution. Considering climatic conditions, we discovered that fires occur more often in mountainous areas with lower temperatures and more wind-driven precipitation. In addition, based on the land use/cover factor, forest classes are more prone to fires than pasture and agricultural classes.
According to , land use/cover and temperature had the greatest impact on wildfire vulnerability. Evidently, in the provinces of Chaharmahal and Bakhtiari, some farmers burn portions of the forest close to their land to increase crop planting or out of competition with other landowners. In contrast, others prefer to utilize the land for other reasons. Furthermore, fires have destroyed several forest areas in Chaharmahal and Bakhtiari provinces due to severe heat and precipitation decreases, enhancing the fire risk and significantly modifying fire behavior. In terms of slope angle, it can be said that the fire typically climbs uphill more readily than it descends downhill, and the greater the inclination, the quicker the fire spreads. However, soil type and rainfall were the least important factors in the incidence of wildfires. According to Hong et al. (Citation2017), slope and temperature have a larger role in the incidence of fires, which is consistent with the present study’s findings. Pourtaghi et al. (Citation2016) also demonstrated that temperature and land use had a stronger impact on the likelihood of a wildfire. According to Eskandari et al. (Citation2020) and this study, the potential for human-caused fires related to land use factors is magnifying.
In this region, land cover is changed to residential areas (about 50% of all fires) and the agricultural sector (about 25% of all fires). Due to the obvious correlation between land usage and fire that has been demonstrated, human-caused fires will also rise. One of the influential factors that can improve the accuracy of the integrated model is the optimal number of training set (Hughes, 1968).
Therefore, we should give special attention on the number of training data and the complexity of the model (Pourtaghi et al. Citation2015; Tsangaratos and Ilia, Citation2016). In this investigation, the standalone MARS model needs a minimum of 150 training incidences (fire and non-fire) to obtain accurate and consistent findings. In contrast, the optimized techniques follow the needed training data depending on the existing training incidence. Therefore, they are best prepared to provide more desirable predictions.
Jaafari et al. (Citation2018) studied wildfire spatial analysis in the Zagros mountains, Iran. They used 132 fire records between 2007 and 2014 for the studied area. The predictive models for wildfire susceptibility mapping alternating decision tree (ADT), classification and regression tree (CART), functional tree (FT), logistic model tree (LMT), and Naïve Bayes tree (NBT). In another study, Eskandari et al. (Citation2020) proposed four data-mining algorithms including SVM, generalized linear model (GLM), functional data analysis (FDA), and RF for mapping fire danger at Koohdasht County which is in the Zagros region. They used data from 349 fires in the research region between 2001 and 2017 for developing the four recommended models.
Comparing results of the present study with Jaafari et al. (Citation2018) and Eskandari et al. (Citation2020), for wildfire spatial prediction shows that temperature is one of the important indicators with assertion of both studies. Moreover, the candidate MARS-CSO models (0.924) outperformed ADT (0.878) and CART (0.867) models from Jaafari et al. (Citation2018) and GLM (0.705) and FDA (0.714) models from Eskandari et al. (Citation2020) in term of accuracy. AUC which is calculated in all tree investigations, is recruited to compare the performance of the models. AUC of the proposed ADT and FDA models, respectively, in Jaafari et al. (Citation2018) and Eskandari et al. (Citation2020) studies were reported 82.57% and 0.77.7%. MARS-CSO model improves the accuracy of the simulation in proving the required maps by about 7% and 15% compared with ADT and FDA models respectively. Although both previous studies in achieving the simulation results are satisfactory, Their model’s reliability along with the accuracy can be enhanced for better fire susceptibility detection in the studied area. In addition, k-index is improved by 29% and 5% compared to the best fitted models of Jaafari et al. (Citation2018) and Eskandari et al. (Citation2020), respectively, since the MARS coupled with CSO algorithm in this study. It seems that the superiority of the proposed MARS-CSO model compared to those benchmark models in this study and also ADT and FDA models from Jaafari et al. (Citation2018) and Eskandari et al. (Citation2020) was tuning the hyperparameters of the standalone MARS model in order to better understanding of the relationships between contributing factors and target variables. Although tree-based models in this study had satisfactory performance for detecting wildfire, their training is relatively expensive as the complexity and time has taken are more compared MARS and integrated MARS techniques. In addition to pruning and other solutions in tree-based models, it can be seen that the accuracy of the models for training due to the over-fitting problem is far greater than testing set. However, in MARS model this problem is addressed by cross-validation techniques along with forward and backward stages of calibration process.
It is important to remember that using the models suggested in the present research has limitations. Most significantly, the models may not be as accurate as they are in the presence of significant alterations in variable components because they were developed employing geo-environmental data from a given period (e.g. rainfall). These conditions need regular updating of the susceptibility maps that have been generated. In order to estimate wildfire susceptibility with greater quality and consistency, it is also crucial to invest in databases and accurate wildfire records that encompass key explanatory factors; some of these variables were unavailable for use in this research. The developed ensembles are also very complex because of the issue’s enormous size (i.e. taking into account 11 ignition factors), as demonstrated by the prolonged computation times of the elite models (by comparison). Nevertheless, such limitations may be mitigated by optimizing the input configuration, a powerful concept for future research. Furthermore, the quality of the wildfire susceptibility mapping could be improved when other new optimization algorithms with fewer parameters are selected for searching the best hyperparameters for the MARS model.
7. Conclusion
Susceptibility analysis of natural hazards, like, flood, landslide wildfire, etc. is a basic prerequisite for future planning and management, early warning systems, and resource allocation in any region. Modeling wildfires at the regional scale is a non-linear and common complex problem, which is challenging to assess and predict. This research develops and validates a new hybrid AI model, named cat swarm optimization-based multivariate adaptive regression splines (MARS-CSO), to predict wildfire for a case study of Chaharmahal and Bakhtiari province, Iran. The proposed model is formulated by processing information from 262 historical fires from 2013 to 2018 and a set of spatially explicit explanatory variables. According to Pearson coefficient, land use/cover and NDVI with 0.464 and 0.432 respectively were two greatest contributing factors for fire occurrence lacations. By developing MARS-CSO, CSO with population size = 120 yielded the most consistent results for wildfire prediction. In order to evaluate MARS model prediction when its hyper-parameters were optimized with CSO algorithm and other benchmarked models, namely MT, REPTree, and standalone MARS model, several performance metrics along with ROC curve are used.
The results revealed that this algorithm overcomes the drawback of being trapped in the local optimum of the traditional MARS via comparison of statistical metrics, and visual comparison of wildfire susceptibility maps. Results indicate that all four models developed in this study have acceptable accuracy in term of AUC (> 0.8) when predicting future fire susceptibilities in the studied region. The most remarkable difference among the performances of the models may be the interpretability. Overall, this study can help other researchers develop fire susceptibility maps for other region and presents an approach useful for geo-environmental problems other than wildfire assessment.
Acknowledgments
Amir Mosavi wishes to acknowledge his support from H2020, the European Union's Horizon 2020 Research and Innovation Programme under the Programme SASPRO 2 COFUND Marie Sklodowska-Curie grant agreement No. 945478. In addition, this research is partly supported by DFKI IML (iml.dfki.de) and the Ministry of Science and Culture of the German State of Lower Saxony. For more information, visit cst.dfki.de. The responsibility lies with the authors.
Disclosure statement
No potential conflict of interest was reported by the authors.
Data availability statement
The datasets generated during the current study are available from the corresponding author upon reasonable request.
References
- Abedi Gheshlaghi H, Feizizadeh B, Blaschke T. 2020. GIS-based forest fire risk mapping using the analytical network process and fuzzy logic. J Environ Plann Manage. 63(3):481–499.
- Adab H, Kanniah KD, Solaimani K. 2013. Modeling forest fire risk in the northeast of Iran using remote sensing and GIS techniques. Nat Hazards. 65(3):1723–1743.
- Ahmed AM, Rashid TA, Saeed SAM. 2020. Cat swarm optimization algorithm: a survey and performance evaluation. Comput Intell Neurosci. 2020:4854895.
- Argañaraz JP, Pizarro GG, Zak M, Landi MA, Bellis LM. 2015. Human and biophysical drivers of fires in Semiarid Chaco mountains of Central Argentina. Sci Total Environ. 520:1–12.
- Arndt N, Vacik H, Koch V, Arpaci A, Gossow H. 2013. Modeling human-caused forest fire ignition for assessing forest fire danger in Austria. iForest. 6(6):315–325.
- Bahrami M, Bozorg-Haddad O, Chu X. 2018. Application of cat swarm optimization algorithm for optimal reservoir operation. J Irrig Drain Eng. 144(1):04017057.
- Bahrami M, Bozorg-Haddad O, Chu X. 2018. Cat swarm optimization (CSO) algorithm. In Advanced optimization by nature-inspired algorithms. Singapore: Springer; p. 9–18.
- Baratloo A, Rahmati F, Forouzanfar MM, Hashemi B, Motamedi M, Safari S. 2015. Evaluation of performance indexes of emergency department. Iran J Emerg Med. 2(1):33–38.
- Bateni SM, Vosoughifar HR, Truce B, Jeng DS. 2019. Estimation of clear-water local scour at pile groups using genetic expression programming and multivariate adaptive regression splines. J Waterway, Port, Coastal, Ocean Eng. 145(1):04018029.
- Bui DT, Khosravi K, Tiefenbacher J, Nguyen H, Kazakis N. 2020. Improving prediction of water quality indices using novel hybrid machine-learning algorithms. Sci Total Environ. 721:137612.
- Bax V, Francesconi W. 2018. Environmental predictors of forest change: an analysis of natural predisposition to deforestation in the tropical Andes region, Peru. Appl Geogr. 91:99–110.
- Bui DT, Bui QT, Nguyen QP, Pradhan B, Nampak H, Trinh PT. 2017. A hybrid artificial intelligence approach using GIS-based neural-fuzzy inference system and particle swarm optimization for forest fire susceptibility modeling at a tropical area. Agric For Meteorol. 233:32–44.
- Chandra S. 2005. Application of remote sensing and GIS technology in forest fire risk modeling and management of forest fires: a case study in the garhwal himalayan region. In Geo-information for disaster management. Berlin, Heidelberg: Springer; p. 1239–1254.
- Chuvieco E, Congalton RG. 1989. Application of remote sensing and geographic information systems to forest fire hazard mapping. Remote Sens Environ. 29(2):147–159.
- Chu SC, Tsai PW. 2007. Computational intelligence based on the behavior of cats. Int J Innov Comput Inf Control. 3(1):163–173.
- Costache R, Bui DT. 2020. Identification of areas prone to flash-flood phenomena using multiple-criteria decision-making, bivariate statistics, machine learning and their ensembles. Sci Total Environ. 712:136492.
- Costafreda-Aumedes S, Vega-Garcia C, Comas C. 2018. Improving fire season definition by optimized temporal modelling of daily human-caused ignitions. J Environ Manage. 217:90–99.
- De Moel H, van Vliet M, Aerts JC. 2014. Evaluating the effect of flood damage-reducing measures: a case study of the unembanked area of Rotterdam, the Netherlands. Reg Environ Change. 14(3):895–908.
- Dodangeh E, Choubin B, Eigdir AN, Nabipour N, Panahi M, Shamshirband S, Mosavi A. 2020. Integrated machine learning methods with resampling algorithms for flood susceptibility prediction. Sci Total Environ. 705:135983.
- Eskandari S, Pourghasemi HR, Tiefenbacher JP. 2020. Relations of land cover, topography, and climate to fire occurrence in natural regions of Iran: Applying new data mining techniques for modeling and mapping fire danger. Forest Ecol Manag. 473, 118338.
- Fallah-Zazuli M, Vafaeinejad A, Alesheykh AA, Modiri M, Aghamohammadi H. 2019. Mapping landslide susceptibility in the Zagros Mountains, Iran: a comparative study of different data mining models. Earth Sci Inform. 12(4):615–628.
- Friedman JH. 1991. Multivariate adaptive regression splines. Ann. Stat. 19(1):1–67.
- Ghaemi A, Rezaie-Balf M, Adamowski J, Kisi O, Quilty J. 2019. On the applicability of maximum overlap discrete wavelet transform integrated with MARS and M5 model tree for monthly pan evaporation prediction. Agric For Meteorol. 278:107647.
- Ghavidel Y, Farajzadeh M, Khaleghi Babaei M. 2016. Synoptic backgrounds of the widest wildfire in Mazandaran Province of Iran during December 11–13, 2010. Meteorol Atmos Phys. 128(6):763–777.
- Gholamnia K, Gudiyangada Nachappa T, Ghorbanzadeh O, Blaschke T. 2020. Comparisons of diverse machine learning approaches for wildfire susceptibility mapping. Symmetry. 12(4):604.
- Ghorbanzadeh O, Blaschke T, Gholamnia K, Aryal J. 2019. Forest fire susceptibility and risk mapping using social/infrastructural vulnerability and environmental variables. Fire. 2(3):50.
- Gigović L, Pourghasemi HR, Drobnjak S, Bai S. 2019. Testing a new ensemble model based on SVM and random forest in forest fire susceptibility assessment and its mapping in Serbia’s Tara National Park. Forests. 10(5):408.
- Heddam S, Kisi O. 2018. Modelling daily dissolved oxygen concentration using least square support vector machine, multivariate adaptive regression splines and M5 model tree. J Hydrol. 559:499–509.
- Herawati H, Santoso H. 2011. Tropical forest susceptibility to and risk of fire under changing climate: a review of fire nature, policy and institutions in Indonesia. For Policy Econ. 13(4):227–233.
- Hong H, Naghibi SA, Moradi Dashtpagerdi M, Pourghasemi HR, Chen W. 2017. A comparative assessment between linear and quadratic discriminant analyses (LDA-QDA) with frequency ratio and weights-of-evidence models for forest fire susceptibility mapping in China. Arab J Geosci. 10(7):1–14.
- Hosseini FS, Choubin B, Mosavi A, Nabipour N, Shamshirband S, Darabi H, Haghighi AT. 2020. Flash-flood hazard assessment using ensembles and Bayesian-based machine learning models: application of the simulated annealing feature selection method. Sci Total Environ. 711:135161.
- Huebner K, Lindo Z, Lechowicz MJ. 2012. Post-fire succession of collembolan communities in a northern hardwood forest. Eur J Soil Biol. 48:59–65.
- Jaafari A, Zenner EK, Pham BT. 2018. Wildfire spatial pattern analysis in the Zagros Mountains, Iran: a comparative study of decision tree based classifiers. Ecol Inf. 43:200–211.
- Jaafari A, Termeh SVR, Bui DT. 2019. Genetic and firefly metaheuristic algorithms for an optimized neuro-fuzzy prediction modeling of wildfire probability. J Environ Manage. 243:358–369.
- Jaiswal RK, Mukherjee S, Raju KD, Saxena R. 2002. Forest fire risk zone mapping from satellite imagery and GIS. Int J Appl Earth Obs Geoinf. 4(1):1–10.
- Kapoor P, Rani R, Jmit R. 2015. Efficient decision tree algorithm using J48 and reduced error pruning. Int J Eng Res Gen Sci. 3(3):1613–1621.
- Keshtegar B, Mert C, Kisi O. 2018. Comparison of four heuristic regression techniques in solar radiation modeling: kriging method vs RSM, MARS and M5 model tree. Renewable Sustainable Energy Rev. 81:330–341.
- Khosravi K, Pham BT, Chapi K, Shirzadi A, Shahabi H, Revhaug I, Prakash I, Tien Bui D. 2018. A comparative assessment of decision trees algorithms for flash flood susceptibility modeling at Haraz watershed, northern Iran. Sci Total Environ. 627:744–755.
- Khosravi K, Shahabi H, Pham BT, Adamowski J, Shirzadi A, Pradhan B, Dou J, Ly H-B, Gróf G, Ho HL, et al. 2019. A comparative assessment of flood susceptibility modeling using multi-criteria decision-making analysis and machine learning methods. J Hydrol. 573:311–323.
- Kuncheva LI. 2007. Combining pattern classifiers: methods and algorithms (kuncheva, li; 2004)[book review]. IEEE Trans Neural Netw. 18(3):964–964.
- Littell JS, Peterson DL, Riley KL, Liu Y, Luce CH. 2016. A review of the relationships between drought and forest fire in the United States. Glob Chang Biol. 22(7):2353–2369.
- Mabdeh AN, Al-Fugara AK, Khedher KM, Mabdeh M, Al-Shabeeb AR, Al-Adamat R. 2022. Forest fire susceptibility assessment and mapping using support vector regression and adaptive neuro-fuzzy inference system-based evolutionary algorithms. Sustainability. 14(15):9446.
- Majumder P, Eldho TI. 2016. A new groundwater management model by coupling analytic element method and reverse particle tracking with cat swarm optimization. Water Resour Manage. 30(6):1953–1972.
- Marchal J, Cumming SG, McIntire EJ. 2017. Land cover, more than monthly fire weather, drives fire-size distribution in Southern Québec forests: implications for fire risk management. PLoS One. 12(6):e0179294.
- Mohamed WNHW, Salleh MNM, Omar AH. 2012, November. A comparative study of reduced error pruning method in decision tree algorithms. 2012 IEEE International Conference on Control System, Computing and Engineering. IEEE . p. 392–397.
- Motazeh AG, Ashtiani EF, Baniasadi R, Choobar FM. 2013. Rating and mapping fire hazard in the hardwood Hyrcanian forests using GIS and expert choice software. Acknowledgement to Reviewers of the Manuscripts Submitted to Forestry Ideas in 2013. p. 141.
- Naderpour, M., Rizeei, H. M., Khakzad, N., & Pradhan, B. (2019). Forest fire induced Natech risk assessment: a survey of geospatial technologies. Reliab Eng Syst Saf, 191, 106558.
- Nasi, R., Dennis, R., Meijaard, E., Applegate, G., & Moore, P. (2002). Forest fire and biological diversity. UNASYLVA-FAO-, 36-40.
- Nami MH, Jaafari A, Fallah M, Nabiuni S. 2018. Spatial prediction of wildfire probability in the Hyrcanian ecoregion using evidential belief function model and GIS. Int J Environ Sci Technol. 15(2):373–384.
- Orouskhani M, Mansouri M, Orouskhani Y, Teshnehlab M. 2013. A hybrid method of modified cat swarm optimization and gradient descent algorithm for training ANFIS. Int J Comp Intel Appl. 12(02):1350007.
- Pham BT, Prakash I, Singh SK, Shirzadi A, Shahabi H, Tran T-T-T, Bui DT. 2019. Landslide susceptibility modeling using Reduced Error Pruning Trees and different ensemble techniques: hybrid machine learning approaches. Catena. 175:203–218.
- Podur J, Martell DL, Csillag F. 2003. Spatial patterns of lightning-caused forest fires in Ontario, 1976–1998. Ecol Modell. 164(1):1–20.
- Pourtaghi ZS, Pourghasemi HR, Rossi M. 2015. Forest fire susceptibility mapping in the Minudasht forests, Golestan province, Iran. Environ Earth Sci. 73(4):1515–1533.
- Pourtaghi ZS, Pourghasemi HR, Aretano R, Semeraro T. 2016. Investigation of general indicators influencing on forest fire and its susceptibility modeling using different data mining techniques. Ecol Indic. 64:72–84.
- Rahmati O, Pourghasemi HR. 2017. Identification of critical flood prone areas in data-scarce and ungauged regions: a comparison of three data mining models. Water Resour Manage. 31(5):1473–1487.
- Razavi-Termeh SV, Sadeghi-Niaraki A, Choi SM. 2020. Gully erosion susceptibility mapping using artificial intelligence and statistical models. Geomatics Nat Hazards Risk. 11(1):821–844.
- Rezaie-Balf M, Naganna SR, Ghaemi A, Deka PC. 2017. Wavelet coupled MARS and M5 Model Tree approaches for groundwater level forecasting. J Hydrol. 553:356–373.
- Rezaie-Balf M, Maleki N, Kim S, Ashrafian A, Babaie-Miri F, Kim NW, Chung I-M, Alaghmand S. 2019. Forecasting daily solar radiation using CEEMDAN decomposition-based MARS model trained by crow search algorithm. Energies. 12(8):1416.
- Rezaie-Balf M, Ghaemi A, Jun CS, Band S, Bateni SM. 2022. Towards an integrative, spatially-explicit modeling for flash floods susceptibility mapping based on remote sensing and flood inventory data in Southern Caspian Sea Littoral, Iran. Geocarto Int. 9:1–31.
- Rodrigues M, Jiménez-Ruano A, Peña-Angulo D, De la Riva J. 2018. A comprehensive spatial-temporal analysis of driving factors of human-caused wildfires in Spain using geographically weighted logistic regression. J Environ Manage. 225:177–192.
- Sachdeva S, Bhatia T, Verma AK. 2018. GIS-based evolutionary optimized gradient boosted decision trees for forest fire susceptibility mapping. Nat Hazards. 92(3):1399–1418.
- Sajedi‐Hosseini F, Choubin B, Solaimani K, Cerdà A, Kavian A. 2018. Spatial prediction of soil erosion susceptibility using a fuzzy analytical network process: application of the fuzzy decision making trial and evaluation laboratory approach. Land Degrad Dev. 29(9):3092–3103.
- Schoennagel T, Veblen T T, Romme WH. 2004. The interaction of fire, fuels, and climate across Rocky Mountain forests. BioScience. 54(7):661–676.
- Schweizer DW, Cisneros R. 2017. Forest fire policy: change conventional thinking of smoke management to prioritize long-term air quality and public health. Air Qual Atmos Health. 10(1):33–36.
- Shafizadeh-Moghadam H, Valavi R, Shahabi H, Chapi K, Shirzadi A. 2018. Novel forecasting approaches using combination of machine learning and statistical models for flood susceptibility mapping. J Environ Manage. 217:1–11.
- Tehrany MS, Jones S, Shabani F, Martínez-Álvarez F, Bui DT. 2019. A novel ensemble modeling approach for the spatial prediction of tropical forest fire susceptibility using logitboost machine learning classifier and multi-source geospatial data. Theor Appl Climatol. 137(1–2):637–653.
- Talebi A, Mahjoobi J, Dastorani MT, Moosavi V. 2017. Estimation of suspended sediment load using regression trees and model trees approaches (Case study: Hyderabad drainage basin in Iran). ISH J Hydraul Eng. 23(2):212–219.
- Tallarida RJ, Murray RB. 1987. Chi-square test. Manual of pharmacologic calculations.
- Tariq A, Shu H, Siddiqui S, Mousa BG, Munir I, Nasri A, Waqas H, Lu L, Baqa MF. 2021. Forest fire monitoring using spatial-statistical and Geo-spatial analysis of factors determining forest fire in Margalla Hills, Islamabad, Pakistan. Geomatics Nat Hazards Risk. 12(1):1212–1233.
- Tariq A, Shu H, Li Q, Altan O, Khan MR, Baqa MF, Lu L. 2021. Quantitative analysis of forest fires in southeastern Australia using sar data. Remote Sens. 13(12):2386.
- Tariq A, Shu H, Gagnon AS, Li Q, Mumtaz F, Hysa A, Siddique MA, Munir I. 2021. Assessing burned areas in wildfires and prescribed fires with spectral indices and SAR images in the Margalla Hills of Pakistan. Forests. 12(10):1371.
- Tariq A, Shu H, Siddiqui S, Munir I, Sharifi A, Li Q, Lu L. 2022. Spatio-temporal analysis of forest fire events in the Margalla Hills, Islamabad, Pakistan using socio-economic and environmental variable data with machine learning methods. J For Res. 33(1):183–194.
- Tehrany MS, Pradhan B, Mansor S, Ahmad N. 2015. Flood susceptibility assessment using GIS-based support vector machine model with different kernel types. Catena. 125:91–101.
- Termeh SVR, Kornejady A, Pourghasemi HR, Keesstra S. 2018. Flood susceptibility mapping using novel ensembles of adaptive neuro fuzzy inference system and metaheuristic algorithms. Sci Total Environ. 615:438–451.
- Tien Bui D, Le KTT, Nguyen VC, Le HD, Revhaug I. 2016. Tropical forest fire susceptibility mapping at the Cat Ba National Park Area, Hai Phong City, Vietnam, using GIS-based kernel logistic regression. Remote Sens. 8(4):347.
- Tuyen TT, Jaafari A, Yen HPH, Nguyen-Thoi T, Phong TV, Nguyen HD, Van Le H, Phuong TTM, Nguyen SH, Prakash I, et al. 2021. Mapping forest fire susceptibility using spatially explicit ensemble models based on the locally weighted learning algorithm. Ecol Inf. 63:101292.
- Tsangaratos P, Ilia I. 2016. Combining fuzzy logic and information theory for producing a landslide susceptibility model. Bull Geolog Soc Greece. 50(3):1737–1746.
- Vadrevu KP, Eaturu A, Badarinath K. 2010. Fire risk evaluation using multicriteria analysis—a case study. Environ Monit Assess. 166(1–4):223–239.
- Vahidnia MH, Alesheikh AA, Alimohammadi A, Hosseinali F. 2010. A GIS-based neuro-fuzzy procedure for integrating knowledge and data in landslide susceptibility mapping. Comput Geosci. 36(9):1101–1114.
- Van Boeckel TP, Thanapongtharm W, Robinson T, Biradar CM, Xiao X, Gilbert M. 2012. Improving risk models for avian influenza: the role of intensive poultry farming and flooded land during the 2004 Thailand epidemic. PLoS One. 7(11):e49528.
- Vandenberg‐Rodes A, Moftakhari HR, AghaKouchak A, Shahbaba B, Sanders BF, Matthew RA. 2016. Projecting nuisance flooding in a warming climate using generalized linear models and Gaussian processes. J Geophys Res Oceans. 121(11):8008–8020.
- Vilar, L., Gómez, I., Martínez-Vega, J., Echavarría, P., Riaño, D., & Martín, M. P. (2016). Multitemporal modelling of socio-economic wildfire drivers in central Spain between the 1980s and the 2000s: comparing generalized linear models to machine learning algorithms. PLoS One, 11(8), e0161344.
- Wang, Y., Hong, H., Chen, W., Li, S., Panahi, M., Khosravi, K., … & Costache, R. (2019). Flood susceptibility mapping in Dingnan County (China) using adaptive neuro-fuzzy inference system with biogeography based optimization and imperialistic competitive algorithm. J Environ Manage, 247, 712–729.
- Wu Z, He HS, Yang J, Liang Y. 2015. Defining fire environment zones in the boreal forests of northeastern China. Sci Total Environ. 518:106–116.
- Yao J, Raffuse SM, Brauer M, Williamson GJ, Bowman DM, Johnston FH, Henderson SB. 2018. Predicting the minimum height of forest fire smoke within the atmosphere using machine learning and data from the CALIPSO satellite. Remote Sens Environ. 206:98–106.
- Yusiong JPT. 2012. Optimizing artificial neural networks using cat swarm optimization algorithm. IJISA. 5(1):69–80.
- Zhao G, Pang B, Xu Z, Yue J, Tu T. 2018. Mapping flood susceptibility in mountainous areas on a national scale in China. Sci Total Environ. 615:1133–1142.
- Zawadzka J, Corstanje R, Harris J, Truckell I. 2020. Downscaling Landsat-8 land surface temperature maps in diverse urban landscapes using multivariate adaptive regression splines and very high resolution auxiliary data. Int J Digital Earth. 13(8):899–914.