
 ?Mathematical formulae have been encoded as MathML and are displayed in this HTML version using MathJax in order to improve their display. Uncheck the box to turn MathJax off. This feature requires Javascript. Click on a formula to zoom.
Abstract
Based on ground-based and satellite-based data, spatio-temporal analyses of air quality in Tehran were carried out during the lockdown periods (February-April) in 2020 and 2021. We evaluated the differences in temporal emissions of six air pollutants (NO2, CO, SO2, O3, PM2.5, and PM10) at various time scales, including diurnal, monthly, and relative changes. The results of ground-based measurements indicated that for all pollutants except O3, the magnitude decreased in 2020 (11-42%) compared to the baseline period (2015-2021). As a result of eased restrictions and unfavorable meteorological conditions, the reduction in air pollutants was lower in 2021 (5-32%), and PM2.5 and PM10 levels increased (3.75 and 11.22%). Satellite-based concentrations (NO2, CO, SO2, and AOD) varied from −8 to 54% in 2020 and from −41 to 60% in 2021 compared to 2019 as the pre-lockdown year. Concerning AOD, the trend is consistent with dust events during March and April in our region.
HIGHLIGHTS
Air quality improved in 2020 by lockdown restrictions and in 2021 degraded by eased restrictions and unfavorable meteorological conditions.
The diurnal patterns of the air pollutants during lockdown periods remained the same as in the pre-lockdown period with a lower magnitude.
Dust events affected the concentration of PM2.5 and PM10 in March and April.
Columnar remotely sensed air pollutants, could be used for monitoring air quality in Tehran, especially in terms of NO2 and CO.
1. Introduction
The rapid spread of Covid-19 is one of the main concerns for people all around the world. Governments around the world use a range of measures based on social distancing and self-isolation to curb disease transmission. It restricted large-scale public and private gatherings and reduced public and private transportation. As a result of declining commuting, fuel consumption and plant house activity were reduced (Cheng et al. Citation2020; Lonati and Riva Citation2021). Air pollution levels have decreased and air quality has improved due to reducing anthropogenic activities and related emissions (Marlier et al. Citation2020; Das et al. Citation2022).
Several studies in various scales and regions investigated the air quality in terms of air pollutants such as NO2, SO2, CO, PM10, PM2.5, and O3 to estimate variations during lockdown periods. A satellite-based study in Asian regions, such as China and India, found that NO2 was reduced by 17% in India and 25% in China from January -March 2020 compared to the same period in 2019 (Metya et al. Citation2020). SO2 also showed a significant reduction of 17% over the eastern part of India, and CO declined by 6.5% over the north-central of China (Metya et al. Citation2020). It was shown by Elshorbany et al. (Citation2021) that, in most states, traffic volumes decreased by 40-60% during the lockdown period of April to May in the United States. Due to a reduction in traffic volume, NO2, CO, and O3 concentrations in the northeast region decreased by 30%, 12%, and 13%, respectively. In addition, it was noted that Aerosol Optical Depth (AOD) decreased slightly as compared to the base period (Elshorbany et al. Citation2021). Lonati and Riva. (2021) found that the ground-based monthly concentrations of NO2 reduced by 35% over the Po valley of northern Italy during the lockdown period from January- June 2020 compared with the same months in 2014-2019. In the southeast of England, the NO2 concentration decreased by an average of 14-48% in March-May. During the same period, O3 concentration increased by up to 15% compared to the mean of the same period (Wyche et al. Citation2021). In five major Poland cities, AOD was investigated as an indicator of aerosol concentration in the total air column. Result showed that in April and May, the reduction was 23% and 18% compared to 2018-2019 (Filonchyk et al. Citation2021). While the reduction in PM2.5 was 8.7 − 26.4%, and PM10 was 8.5 − 33.9% in the same period in 2019 (Filonchyk et al. Citation2021).
On a global scale, using 597 major cities datasets around the world showed a significant fall in NO2 (23-37%), PM10 (14-20%), SO2 (2-20%), PM2.5 (7-16%) and CO (7-11%) during lockdown period compared to the pre-lockdown (Liu et al. Citation2021). Overall estimation by remote sensing indicated that NO2, SO2, and AOD levels substantially decreased in 2020 during the lockdown period compared to their averages for the baseline period in all continents. Maximum reductions were 33% and 41% for NO2 and SO2 in East Asia and 37% for AOD in South Asia (Zhang et al. Citation2020). In the case of O3, while the maximum reduction was observed as 11% in Europe, and 10% in North America, other study regions such as South and East Asia showed a relatively slight increase in O3 concentration (Zhang et al. Citation2020).
Approximately 5000 people die each year due to severe air pollution in Tehran, Iran’s capital city (Pishgar et al. Citation2020). In February 2020, to minimize the rapid spread of the disease during the SARS-CoV-2 outbreak in Iran, the movement restrictions were implemented by public health bodies at the national and sub-national levels. At the same time, limitations on using public transportation were recommended, which led to an increase in using personal cars (Faridi et al. Citation2020). By operating industrial sections with minimum staff, the Iranian authorities decreased the economic downturn caused by lockdown restrictions. However, some restrictions were gradually eased in 2021, such as those related to urban transportation.
Few studies have investigated lockdown measurement impacts on Tehran’s air quality. For example, Broomandi et al. Citation2020 analyzed ground-based measurements from 21 March to 21 April 2020 over 12 air quality stations and showed significant improvement in air quality in terms of NO2, SO2, CO, and PM10, while PM2.5 and satellite-based AOD showed increasing levels (Broomandi et al. Citation2020). Rad et al. (Citation2020) reported the same result by analyzing 12 air quality stations in Tehran from 1 March to 9 April. An increment in PM2.5 concentration was found in 22 air quality stations from 20 February to 2 April (Faridi et al. Citation2020).
These studies were limited to less than 6 weeks periods in 2020 and compared with 2019 as a pre-lockdown year. Since short periods in the pre-lockdown year may be influenced by short-term atmospheric changes and synoptic meteorological variations (Singh et al. Citation2020), it isn’t represented the lockdown effects. A comparative analysis of the air quality data from February to April in the first and second years of lockdown (2020 and 2021) was conducted to mitigate these short-term effects. This extended span covered a part of winter and spring which contained considerable meteorological changes with lower economic activities during Nowruz holiday (21 March to 2 April). We have utilized data (PM10, PM2.5, NO2, SO2, CO, and O3) from 23 air quality monitoring stations across Tehran along with the satellite data from MODIS/MAIAC and TROPOMI (AOD, NO2, SO2, and CO). Furthermore, meteorological factors have been studied in relation to air quality in lockdowns and pre-lockdown periods.
2. Data and methods
2.1. Study region
Tehran’s metropolis is the capital of the country (), with a population of around 8.5 million. In the daytime, the population exceeds 12.5 million due to commuting from nearby towns (Shahbazi et al. Citation2016). It is located in the semi-arid climatic zone and experiences four distinct seasons, i.e. winter, spring, summer, and autumn (Arhami et al. Citation2017).
Figure 1. Spatial distribution of Air Quality Control Stations in Tehran, roads, and built area.
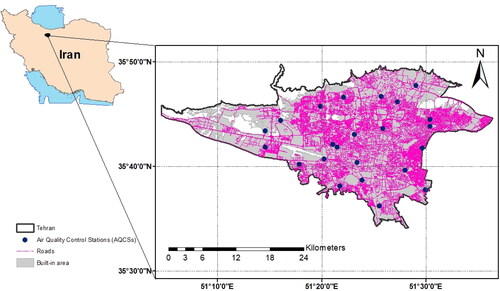
Air pollutants in Tehran are emitted from different sources. About 80% of the pollutants emissions (NOx, CO, PM2.5, and PM10) come from 4.24 million vehicles in Tehran (Azarmi and Arhami Citation2017; Shahbazi et al. Citation2017). The vicinity of Tehran is the other source of air pollutants, with about 50% of the country’s industrial activities (Yazdi et al. Citation2015). Moreover, Tehran is located in the world’s dust belt, subjected to several dust storms every year (Kamali et al. Citation2015; Ghotbi et al. Citation2016). Also, the topographical conditions and mountain chain surrounding the city decrease natural air ventilation and keep the atmosphere more stable (Sotoudeheian and Arhami Citation2014; Kamali et al. Citation2015). The inversion condition during autumn and winter enhanced the atmospheric stability resulting in the increasing air pollutants concentration near the surface under the lower boundary layer height (Azarmi and Arhami Citation2017).
2.2. Ground-based observations
The ground-level concentration of air pollutants including PM10, PM2.5, NO2, SO2, and CO, was obtained from 23 air quality monitoring stations in the Tehran megacity operated by Tehran Air Quality Control Company (https://airnow.tehran.ir/home/dataarchive.aspx). The Air Quality Control stations are mostly located in urban residential and commercial areas []. The measurements are carried out continuously using beta attenuation monitoring (Met One BAM-1020, USA; and Environment SA, MP 101 M, France), UV-spectrophotometry (Ecotech Serinus 10 Ozone Analyzer, Australia), chemiluminescence (Ecotech Serinus 40 Oxides of Nitrogen Analyzer, Australia), ultraviolet fluorescence (Ecotech Serinus 50 SO2 Analyzer, Australia), and non-dispersive infrared absorption (Ecotech Serinus 30 carbon monoxide Analyzer, Australia) methods (Yousefian et al. Citation2020).
2.3. Sentinel-5P TROPOMI observations
Sentinel-5 Precursor (S5P) satellite was launched on 13 October 2017 by the European Space Agency to monitor atmospheric chemistry and air pollution. The onboard sensor is called TROPOMI (TROPOspheric Monitoring Instrument). S5P is a near-polar sun-synchronous orbit satellite flying at an altitude of 817 km with an overpass time at ascending node of 13:30 h mean local solar time. The TROPOMI instrument operates in a push-broom configuration with a swath width of about 2600 km on the Earth’s surface. Four spectrometers system measures the ultraviolet (UV), UV–visible (UV–VIS), near-infrared (NIR), and shortwave infrared (SWIR) spectral bands (Voors et al. Citation2017; Cersosimo et al. Citation2020).
This study used offline Level-3 (L3) TROPOMI NO2, SO2, and CO products for February, March, and April of 2019 – 2021. The data was processed and downloaded from the Google Earth Engine (GEE) cloud-based platform (Gorelick et al. Citation2017) with a spatial resolution of 0.01 arc degrees (Crosman Citation2021). All cloudy pixels were omitted from each dataset and filtered to minimize the influence of the cloud on the data retrieval, and then units were converted to molecules cm−2.
2.4. Modis MAIAC AOD
MODIS sensors onboard the Aqua and Terra platforms observe the Earth at different spectral wavelengths, including 36 bands between 410 to 1450 nm with a daily temporal resolution and spatial resolution of 1 km, 0.5 km, and 0.25 km. Aqua overpasses the equator at ∼13:30 local time while Terra at ∼10:30 local time. Several algorithms have been applied to MODIS measurements to retrieve AOD at different spatial resolutions, including Dark Target (DT) algorithm with 10 km and 3 km resolution (Levy et al. Citation2013), Deep Blue (DB) algorithm with 10 km resolution (Hsu et al. Citation2013) and MAIAC algorithm with 1 km grid resolution (Lyapustin et al. Citation2018). The high-resolution MAIAC algorithm decouples aerosol and surface contributions using the time series analysis. The algorithm assumes that the surface is stable over a short time and heterogeneous spatially rather than features like aerosols and clouds. Several studies have evaluated MAIAC AOD retrieval in South Asia (Mhawish et al. Citation2019), China (Liu et al. Citation2019; Bilal et al. Citation2022), and North America (Jethva et al. Citation2019), and all showed higher retrieval accuracy than DT and DB mainly over an urban region with higher spatial coverage. This study used the combined Terra and Aqua MAIAC AOD at 550 nm. Only the highest quality data, designated with the quality assurance (QA) cloud mask value ‘clear’, were used.
2.5. Meteorological data
ERA5 is the 5th generation of the European Centre for Medium-Range Weather Forecasts (ECMWF) atmospheric reanalysis of the global climate (Hersbach et al. Citation2020). In this analysis, ERA5 daily averaged meteorological data like wind speed, temperature, and precipitation were used to evaluate the impact of meteorological variables on air pollutants concentrations.
2.6. Methodology
According to the workflow performed [], all 23 ground station measurements - NO2, SO2, O3, CO, PM2.5, and PM10 - were aggregated over Tehran from February -April, during 2015-2021. In this study, we applied both diurnal and monthly change analyses. As a next step, to compare the relative change results of ground-based air quality measurements and the major meteorological parameters, ERA5-derived meteorological parameters, including precipitation, air temperature, and wind speed, were collected in the same months between 2015-2021. The relative changes of all air pollutants concentrations and meteorological variables have been measured by calculating the changes during lockdown periods compared with the long-term mean of 2015-2021 during February - April months:
(1)
(1)
Figure 2. A flowchart showing the research process.
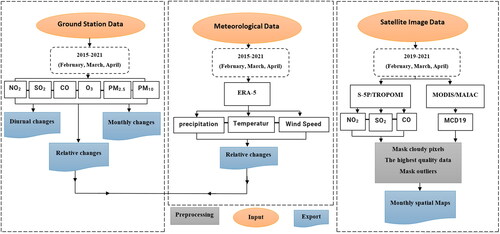
Finally, daily satellite air quality monitoring observations were used in the same months between 2019-2021. In this step, to achieve high-quality assurance images, the TROPOMI-based NO2, SO2, and CO products as well as the MODIS-derived AOD 550 nm were processed using the cloudy pixel mask.
3. Results
3.1. Diurnal variation of ground-level NO2, SO2, PM2.5, PM10, CO, and O3
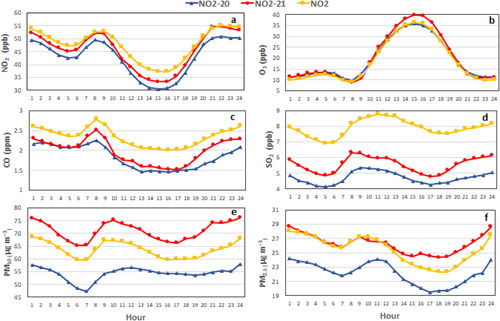
Diurnal variations in air pollutants were investigated during Tehran’s lockdown period when anthropogenic activities were restricted. There are several factors that influence the diurnal trend of air pollutants, including time of emission, meteorological conditions, and chemical and photochemical reactions (Seinfeld and Pandis Citation2006). Due to the closing of several anthropogenic activities, such as educational institutions, business centers, and holy places, transportation emissions have been drastically reduced. This is expected to have an influence on the diurnal variation of pollutants. Therefore, we tested the diurnal variation of the air pollutants during lockdown years (2020 and 2021) and compared it with the long-term diurnal variation from 2015 to 2021 [].
Figure 3. Diurnal variations of ambient air pollutants concentrations (a–f): NO2, O3, CO, SO2, PM10, and PM2.5 respectively, during February to April in 2020,2021, and long-term average in 2015–2021: blue, red, and yellow lines respectively.
3.1.1. Diurnal pattern
NO2 emissions in Tehran are mainly from the transportation sector (47%), thermal power plants (22%), and domestic and commercial activities (20%)(Shahbazi et al. Citation2016). On the other hand, 98% of CO is emitted from vehicular sources, and 68% of SO2 is mainly emitted from power plants and oil refiners, with only 21% from the industrial sector (Shahbazi et al. Citation2016).
The concentration of NO2 and CO decreased from midnight to about 6 am, followed by the morning peak (52.8 ppb and 2.8 ppm) between 7 to 9 am []. Then the concentration decreased and reached the minimum values (37.3 ppb and 2 ppm) between 3 to 4 pm. During the afternoon rush hours, the concentration of the pollutants rose and reached the level of (55.1 ppb and 2.6 ppb) at about 9 to 12 pm.
The diurnal pattern of SO2 was different from other trace gases (NO2 and CO) with the lowest SO2 concentration was found (6.9 ppm) from 4 to 5 am. The highest value was between 10-11 am (8.7 ppm), followed by decreasing trend until 7 pm, then increased and reached the level of 8.2 ppb at 11-12 pm. The second high SO2 concentration was observed at night due to the transportation of heavy-duty vehicles after 10 pm based on traffic control regulations (Taghvaee et al. Citation2018) and decreasing boundary layer height that enhances the accumulation of the pollutants near the surface (Xiang et al. Citation2019; Singh et al. Citation2020).
The particulate matter (PMx), including PM10 and PM2.5, showed similar diurnal patterns to trace gases (NO2 and CO). Previous studies reported different contribution levels of transportation system emission in PMx from 50% (Taghvaee et al. Citation2018) to 70% (Shahbazi et al. Citation2016), besides the power sector and industry. Also, dust storm events are responsible for 25% of PMx, especially in the spring and summer warm seasons, due to higher wind speed and lower precipitation (Arhami et al. Citation2017; Berezina et al. Citation2020; Singh et al. Citation2020).
Over Tehran, PM2.5 and PM10 had similar diurnal patterns, suggesting that they both come from the same source. The maximum PMx concentrations was found at midnight decreased until 7 am, followed by a morning peak (27.3 and 67.3 μg m−3 respectively) between 8 and 9 am. During working hours (typically 8 am to 5 pm), the concentrations decreased and reached the minimum between 4 to 7 pm (23.3 and 59.7 μg m−3). Then during rush hours in the afternoon, PM2.5 and PM10 increased and reached the highest values (28.1 and 68.6 μg m−3) from 12 pm to 1 am.
Tropospheric ozone is a secondary pollutant produced photochemically from primary trace gases such as NO2 in a process driven by solar radiation. The highest near-surface ozone concentration was 36.4 ppb between 2-3 pm due to higher solar radiation that enhanced the ozone formation.
Although the magnitude of air pollutants changed during the lockdown months [], the patterns of diurnal variations remained unchanged considerably. The diurnal pattern of air pollutants in this study has consistency with the annual reports of the Air Quality Control Company in Tehran (QM1400/02/01(U)/1), investigations in Beijing (Liu et al. Citation2015), and Navi Sad in Serbia (Davidović et al. Citation2021).
3.1.2. Diurnal changes during the lockdown period
The long-term (2015-2021) average concentration of NO2 was 47.7 ppb and reduced to the level of 42.8 and 45.5 ppb in 2020 and 2021, respectively, during the lockdown. On the other hand, CO is mainly emitted from transportation systems, and the diurnality is compliant with the traffic emissions (Liu et al. Citation2015). It can also transport from other regions due to its long lifetime of about two months (Singh et al. Citation2020). The long-term CO concentration (2015-2021) was 2.3 ppm, which decreased to 1.8 and 2 ppm in 2020 and 2021. Our result indicated significant changes in SO2 concentration during the lockdown period with 4.7 and 5.5 ppb in 2020 and 2021 compared to the background concentration of 7.9 ppb. The average concentration of O3 during 2015-2021 was 18.7 ppb, which increased to 19.4 and 20.1 ppb, respectively, in 2020 and 2021.
The background (2015-2021) concentrations of PM2.5 and PM10 were 25.4 and 63.7 μg m−3 which reduced relatively in 2020 to 22.2 and 54.3 μg m−3 during the lockdown. In 2021, even with the restriction imposed on people’s movement, the concentrations of PM2.5 and PM10 were increased to 26.3 and 71 μg m−3 compared to 2020 and background concentrations. The enhanced PMx during lockdown indicates the other variables that also affect the concentration of particulate matter and air quality. For more details, we discussed monthly variations of air pollutants, as well as the impact of meteorological variables on air quality changes during the lockdown.
3.2. Monthly variation in lockdown
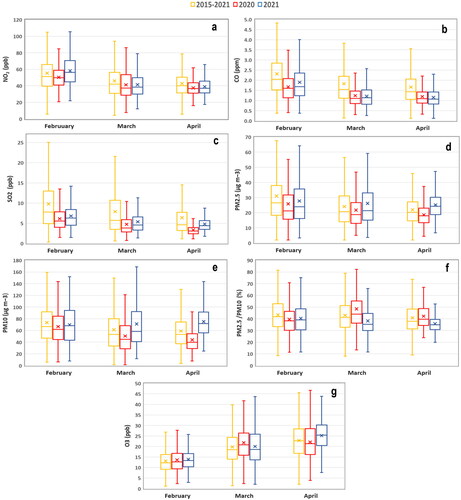
The monthly variations of air pollutants during 2020 and 2021 have been compared with the long-term monthly mean from 2015-2021 for February-April over Tehran []. The results illustrate that the concentrations of CO, SO2, and NO2 decreased in lockdown months in 2020 and 2021 compared to the long-term concentrations of 2015-2021. However, the lower concentrations during the 2020 months could be attributed to the strict restrictions in 2020, leading to more reduction in air pollutants concentrations than in 2021. Similarly, PM2.5 showed lower concentrations in February-April 2020 than in 2021 and baseline concentrations, while PM10 showed higher concentrations in March and April of 2021 than in 2020 and baseline concentrations. The highest concentrations of 5 air pollutants: PM10, PM2.5, NO2, CO, and SO2, were observed in February 2015-2021 (73.3 μg m−3, 31 μg m−3, 55.5 ppb, 2.6 ppm, and 9.7 ppb), respectively (about NO2, the highest concentration pertains to 2021 February with a little difference). Also, February 2015-2021 indicated the largest variation of PM2.5, NO2, CO, and SO2, (65 μg m−3, 99.1 ppb, 4.5 ppm, and 24.6 ppb). Unlike other pollutants, PM10 and PM2.5 showed an increasing trend in March (71.4 and 26.3 μg m−3) and April (72.4 and 24.7 μg m−3) of 2021 compared to 2015-2021 March (60.2 and 23.7 μg m−3) and April (58.2 and 21.7 μg m−3). The largest variation of PM10 was observed in March 2021 (157 μg m−3). The ratio of PM2.5/PM10 was also used as a proxy to identify the sources of particulate matter. High ratios declare anthropogenic aerosol dominance, whereas low ratios indicate dust aerosol dominance (Shahsavani et al. Citation2012; Meng et al. Citation2019). The lower PM2.5/PM10 ratios in March and April 2021 (36.9% and 34.1%) compared to the baseline in 2015- 2021 (39.3% and 37.3%) indicate natural-origin aerosols, mainly dust, were higher in 2021. The largest variation of PM2.5/PM10 ratio was 72.5% in February 2015-2021. Concerning O3 compared to gaseous air pollutants, an increasing trend was observed from February to April. The maximum value was observed in April 2021 (25.4 ppb). Also, the largest variation was in April 2015-2021 (43 ppb).
Figure 4. Monthly variations of ambient air pollutant concentrations (a–g): NO2, CO, SO2, PM2.5, PM10, PM2.5/PM10, and O3 respectively, from February to April 2020,2021, and long-term average in 2015–2021: blue, red, and yellow boxes respectively.
3.3. Relative changes in air pollutants and meteorological factors
The relative changes in air pollutants concentrations and meteorological variables have been measured by calculating the changes during lockdown periods of 2020 and 2021 compared with the long-term mean of 2015-2021 during the February to April months. In addition, t-tests were used to determine the significance of the changes in average air pollutants during the lockdown periods of 2020 and 2021 to the period of 2015-2021. Most of the air pollutants (except PM2.5 in 2020) have significant changes (p-value < 0.05) on average, during lockdown periods []. The results of the t-test in meteorological parameters [] indicated that the average meteorological conditions showed insignificant changes during the lockdown period except for temperature in 2021.
Table 1. T-test results of air pollutants concentrations in 2020 and 2021 during lockdown (February–April) to the same period over seven years (2015–2021).
Table 2. T-test result of meteorological data in 2020 and 2021 during lockdown (February–April) to the average of the same period over seven years (2015–2021).
Absolute and relative changes in air pollutants [] and meteorological conditions [] performed during Tehran’s 2020 and 2021 lockdown periods. NO2 showed a reduction of 10.51% and 5.15% in 2020 and 2021, respectively, compared to the long-term concentration from 2015-2021. NO2 variations in 2020 and 2021 owing to fewer vehicle movements due to the lockdown restrictions. The higher reduction in 2020 (∼11%) is due to the higher restriction in vehicular movement in the first year of the pandemic compared to the soft lockdown in 2021, which showed a relatively lower reduction (∼5%).
Table 3. Changes in period mean (February–April) air pollutant concentrations in 2020 and 2021 during lockdown to the same period’s average over seven years (2015–2021).
Table 4. Changes in period mean (February–April) meteorological parameters in 2020 and 2021 during lockdown to the average of the same period over seven years (2015–2021).
Surface ozone increased in 2020 and 2021 by 4.16% and 8.84% relative to the mean from 2015-2021. As mentioned above, ozone formation depends on several factors, including the presence of precursors such as NOX and VOCs. Another factor is solar radiation, mainly UV flux, as a driving force of ozone photochemistry (Wood et al. Citation2009; Jia et al. Citation2017). Nitrate also can play as a sink for ozone when the nitric oxide (NO) emissions increase, NO converts a large fraction of O3 to NO2. Photochemically state is formed between NO, NO2, and O3 in polluted air (Monks Citation2005; Wood et al. Citation2009), principally:
(2)
(2)
(3)
(3)
(4)
(4)
In EquationEq. (2)(2)
(2) , hν indicates photons and O(3P) is a single form of oxygen that tend to quickly bond with nearby molecules. In EquationEq. (3)
(3)
(3) , M is the reaction third body. The lowest NO2 concentration was observed in the 2020 lockdown period (February - April), which wasexpected to increase ozone formation (Wood et al. Citation2009; Jia et al. Citation2017).During the same period, Tehran experienced a 61.38% increase in precipitation (compared to the mean 2015–2021). As a result, a greater increase in rainy days, reduced the solar radiation and O3 concentration compared to the baseline and 2021. NO2 concentration in 2021 was more than in 2020. The lower precipitation and higher temperature in 2021 (-30% and 24% relative to the mean 2015-2021) prompted the oxidative air condition and intensified ozone formation.
CO concentrations in 2020 and 2021 declined by 20.53% and 14.15%, respectively, which was mainly due to the reduction in CO emission sources (mainly the transportation sector) during the lockdown periods. Similarly, SO2 concentrations significantly decreased in 2020 and 2021 by 42.96% and 32.34% due to a significant reduction in fossil fuel consumption during lockdown periods. Other studies also reported a significant decline in SO2 concentrations in recent years over Tehran (Heger and Sarraf Citation2018; Yousefian et al. Citation2020). Fuel oil and gasoline account for 95% of SO2 emissions in the city of Tehran (Delfi et al. Citation2018). The new air pollutant control policies on emission standards and fuel quality improvement decreased SO2 concentration in the last few years. Based on Tehran Air Quality Control report, the sulfur content of gasoline and diesel distributed in Tehran decreased from 200 and 7000 ppm in 2014 to 20 and 50 ppm in 2017 (Heger and Sarraf Citation2018).
The fine particulate matter (PM2.5) also showed significant reductions in 2020 by 12.73%, while a minor enhancement in PM2.5 concentrations was observed in 2021 by 3.75%. As PM2.5, PM10 showed a reduction during 2020 by 15.89% and an increasing concentration in 2021 (11.22%). The higher precipitation during 2020 enhanced the wet deposition of PM2.5 and PM10, while the wet deposition was lower during 2021 due to lower precipitation and higher atmospheric temperature that enhanced the particulate matter, mainly PM10, from natural sources. Similarly, other studies in Iraq (Hashim et al. Citation2021) and the United Kingdom (Wyche et al. Citation2021) indicated an increasing trend of particular matter in 2020 during the lockdown period compared to the same time in 2019 due to increased dust events.
On the other hand, PM2.5 and PM10 are emitted from both natural and anthropogenic sources, and meteorological conditions such as precipitation, temperature, and wind speed have significant effects on the concentrations. The lack of precipitation in 2021 (29.56% relative to the mean of 2015-2021) and increasing temperature (about 2° C more than the mean of 2015-2021) led to raising dust and increased particular matter concentration.
3.4. Spatial variation of satellite-based air pollutants
The spatio-temporal variation of columnar air pollutants obtained from satellite data was also investigated during the lockdown over Tehran city. Since TROPOMI products are available for three years, we have calculated the monthly average during 2019 - 2021 from February to April. The monthly mean of 2019 was considered a pre-lockdown period, while 2020 and 2021 were lockdown periods. The difference between lockdown (2020 and 2021) and pre-lockdown (2019) periods has been calculated to identify the spatial variation of retrieved satellite air pollutants during the lockdown period [].
Figure 5. Spatial distribution of tropospheric NO2 during February–April from 2019–2021 and difference maps with 2019.
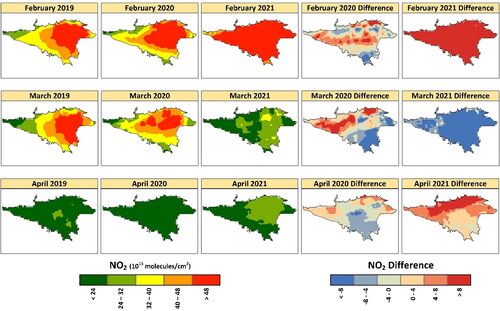
Figure 6. Spatial distribution of tropospheric CO column density during February–April from 2019- 2021 and difference maps with 2019.
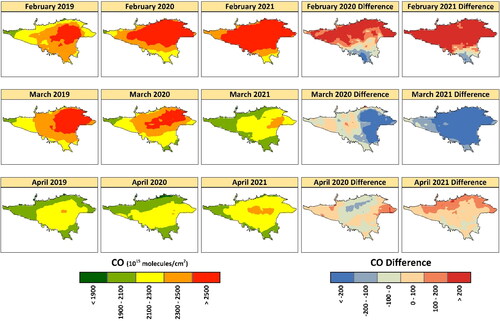
Figure 7. Spatial distribution of SO2 column density during February – April from 2019- 2021 and difference maps with 2019.
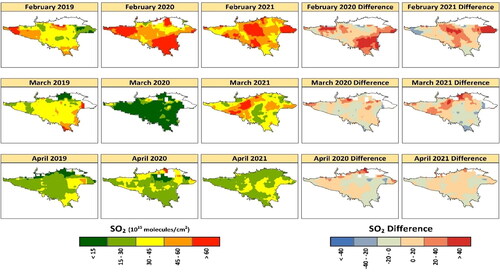
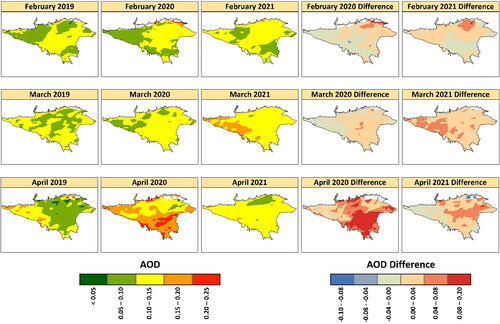
Figure 8. Spatial distribution of MAIAC AOD at 550 nm during February – April from 2019- 2021 and difference maps with 2019.
NO2 spatial average increased in February 2020 and 2021 by 1% and 60%, compared to 2019 []. In March 2021, average NO2 values dropped compared to February. A similar pattern was also shown by ground station data [] with a high difference between February and March 2021. The monthly NO2 average in March 2020 and 2021 decreased by 4% and 41%, and in April 2020 and 2021 varied by −8% and 29% compared to 2019. Despite the sharp variation in 2021, in 2020, pollution decreased in the southern and eastern parts of the city, while in the western part, NO2 column density increased.
In February, CO variations in 2020 and 2021 were −1% and 6% compared to 2019 []. In March 2020 and 2021, CO column density decreased by 3% and 10%, respectively. Similar to NO2, in March 2021, the column density dropped compared with February. April 2020 and 2021 had no notable changes (1% and 2% respectively) compared to 2019. Spatial variation in March 2020 showed more reduction in the eastern part of the city, and in 2021 reduction in all parts of the city was apparent. In April 2020, CO reduced in the central and southern parts, while in 2021, CO column density slightly increased in most of the city.
Monthly spatial variation of TROPOMI measured NO2 and CO showed more concentration in central and eastern parts of the region due to more anthropogenic emissions like transportation and industrial activities. The monthly SO2 average during 2020 and 2021 varied between 42% and 28% in February, 14% and −2% in March, and 14% and −9% in April, respectively, compared to 2019 []. SO2 increased in the southern and eastern parts in February 2020 and 2021. In March and April, there aren’t any considerable variations. Regarding the same studies, SO2 remains unchanged or increased in many regions during lockdown (Ghasempour et al. Citation2021).
Data on aerosol ratios were obtained from MAIAC AOD, which is proven to perform well in particular matter observations (Mhawish et al. Citation2020). The characteristics of AOD changes range from (.05-.2) over Tehran city, indicating low aerosol loading (Mhawish et al. Citation2019). The monthly AOD average during 2020 and 2021 increased by 8% and 3% in February, 4% and 26% in March, and 54% and 14% in April compared to 2019. In 2020 and 2021, especially in March and April, a significant increase in AOD column density was observed, which was probably due to the meteorological conditions [].
3.4.1. Synthesis of spatial and temporal variations
Temporal ground-based and spatial satellite-based variations had considerable similarities during the study period. The monthly columnar TROPOMI NO2, CO, and SO2 averages were higher in February compared to March and April. On the other hand, the highest concentration of ground-based air pollutants of NO2, SO2, CO, and PMx was observed in February. Additionally, the monthly mean of satellite-retrieved NO2 and CO was consistent with ground-based data illustrating more sensitivity of these TROPOMI-based columnar pollutants to anthropogenic emissions. Spatial distribution of the air pollutants displayed an overall decrease in air pollutants such as NO2 and CO during the lockdown years of 2020 and 2021 (except February of 2021). While the lockdown restrictions were relaxed in 2021, and the anthropogenic concentration is more than in 2020 (Behera et al. Citation2021). Our results suggest that AOD was less sensitive to the particular matter in February but it was more compliant to dust events in March and April. Some differences between ground-based and satellite-based air pollutants are that satellites retrieve air pollutants through air column measurements, while ground-based pollutants are measured near the earth’s surface.
4. Discussion
According to the National Oil Company, gasoline consumption in Tehran was reduced by 50% during the lockdown period, along with traffic reduction by 73% (Rad et al. Citation2020). The decline in fuel consumption reduced the emission of NO2, CO, and SO2 during the 2020 and 2021 lockdown periods [ and ]. Stricter lockdown restrictions in 2020 led to better air quality conditions, while in 2021 the lockdown restrictions were relaxed, and anthropogenic emissions increased. The air quality in 2021 was degraded compared to 2020 but still better than the baseline period (2015-2021).
Significant seasonal and monthly variations in air quality were observed in Tehran. Monthly TROPOMI-based columnar NO2, CO, and SO2 were higher in February than in March and April. The colder month of February showed the highest concentration of ground-based air pollutants of NO2, SO2, CO, and PMx. The higher ambient air pollutants concentration in cold months can be attributed to weaker vertical mixing mainly due to decreasing boundary layer height, stagnant weather, and temperature inversion (Tang et al. Citation2012; Hassanvand et al. Citation2014; Yoo et al. Citation2015; Ghotbi et al. Citation2016; Meng et al. Citation2019).
Although the concentration of air pollutants decreased during the 3-month lockdown period (February-April), the concentration of air pollutants in February 2021 was comparable to the long-term average in this month. For example, NO2 concentration was more than the long-term concentration. Also, the satellite data showed a high concentration of air pollutants particularly NO2 and CO in February 2021. This increment could be attributed to the low-quality fuels used in power plants during the cold season, the stable atmosphere, and temperature inversion condition that enhanced the concentration of near-surface air pollutants. However, more investigations are needed to understand the contribution of meteorology and emission sources to winter air quality. To examine the air pollution in other cold months, it is helpful to extend the study period in the autumn and winter months in similar studies.
Our findings indicated that SO2, NO2, CO, and PM10 were reduced by 43%, 11%, 21%, and 16% respectively, compared to the long-term period of 2015-2021. The present study considered the 3-month period as the lockdown period, but a similar decreasing trend was observed in studies conducted in 2020. For instance, Broomandi et al. (Citation2020) reported ground-based measurements from 21 March to 21 April 2020, compared to the same period in 2019. Reduction of 5-28% SO2, 1-33% NO2, 5-41% CO, and 1.4-30% PM10 were observed.
Our results indicated that PM2.5 and PM10 concentrations in 2020 and February 2021 were lower than the baseline period. But the concentrations in March and April 2021 increased compared to the same months in 2015-2021 long-term period. Furthermore, lower ratios of PM2.5/PM10 indicate the natural origins of the aerosols. During warmer months, lack of precipitation and rising wind speed in the region increased the intensity and the frequency of dust storms that increased the concentration of the coarse particles from natural sources (Shahsavani et al. Citation2012; Goudie Citation2014; Namdari et al. Citation2018; Karimi et al. Citation2019). The highest spatial average AOD was in March and April, which are affected by dust storms in our study period.
Despite our results, which indicated that PM2.5 concentration was reduced by 13% during the lockdown period of 2020, previous studies indicated an increment in the concentration of particular matter during the lockdown period of 2020. Broomandi et al. (Citation2020) reported a 2-50% rise in PM2.5 and Faridi et al. (Citation2020) reported 20.5% and 16.5%, increment in PM2.5 and PM10.
The difference between the results of the current study and previous studies concerned the duration of the background period. In the previous studies, the comparisons were made with 2019, while this study considered 2015-2021 as the background period which represented the average air quality better than one year.
5. Conclusion
In contrast with the same months of 2015-2021 background period, this study showed a significant reduction in air pollutants (NO2, CO, SO2, PM2.5, and PM10) during the lockdown period (February-April) of 2020. Despite this, air pollution levels are higher in 2021 compared to 2020 due to the relaxation of the lockdown. Enhanced dust emissions in March and April of 2021 could be attributed to lower rainfall and higher temperatures, resulting in an increase in PM2.5 and PM10.
The monthly average of TROPOMI NO2, SO2, and CO showed a similar pattern to the ground-based data in all months with the highest concentration in February. The monthly mean AOD showed higher values in March and April due to the higher frequency of dust storms.
This study contributes to the understanding the impacts of reducing emissions and meteorological variables on local air quality. Thus, considering air quality improvement during the lockdown period, policymakers could use this experience to reduce anthropogenic air pollution by improving fuel quality, implementing greener technologies in transportation and industrial systems, and reducing unnecessary movements by increasing teleworking.
Acknowledgment
The authors like to thank the GEE team and platform, and their collaborators (NASA, ESA, USGS, NOAA, and so on) for providing the satellite imagery free of charge. The authors also thank the Tehran Air Quality Control Company for their collaboration to provide easy access to air quality data.
Disclosure statement
The authors declare that they have no conflict of interest.
References
- Arhami M, Hosseini V, Shahne MZ, Bigdeli M, Lai A, Schauer JJ. 2017. Seasonal trends, chemical speciation and source apportionment of fine PM in Tehran. Atmos Environ. 153:70–82.
- Azarmi F, Arhami M. 2017. Air pollution challenges in the megacity of Tehran. The Magazine for Environmental Managers. April, 2017, A&WMA.
- Behera MD, Mudi S, Shome P, Das PK, Kumar S, Joshi A, Rathore A, Deep A, Kumar A, Sanwariya C, et al. 2021. COVID-19 slowdown induced improvement in air quality in India: rapid assessment using Sentinel-5P TROPOMI data. Geocarto Int. :1–21.DOI: 10.1080/10106049.2021.1993351.
- Berezina E, Moiseenko K, Skorokhod A, Pankratova NV, Belikov I, Belousov V, Elansky NF. 2020. Impact of VOCs and NOx on ozone formation in Moscow. Atmosphere. 11(11):1262.
- Bilal M, Qiu Z, Nichol JE, Mhawish A, Ali MA, Khedher KM, de Leeuw G, Yu W, Tiwari P, Nazeer M, et al. 2022. Uncertainty in aqua-modis aerosol retrieval algorithms during covid-19 lockdown. IEEE Geosci Remote Sensing Lett. 19:1–5.
- Broomandi P, Karaca F, Nikfal A, Jahanbakhshi A, Tamjidi M, Kim JR. 2020. Impact of COVID-19 event on the air quality in Iran. Aerosol Air Qual Res. 20(8):1793–1804.
- Cersosimo A, Serio C, Masiello G. 2020. TROPOMI NO2 tropospheric column data: regridding to 1 km grid-resolution and assessment of their consistency with in situ surface observations. Remote Sens. 12(14):2212.
- Cheng H-Y, Jian S-W, Liu D-P, Ng T-C, Huang W-T, Lin H-H. 2020. Contact tracing assessment of COVID-19 transmission dynamics in Taiwan and risk at different exposure periods before and after symptom onset. JAMA Intern Med. 180(9):1156–1163.
- Crosman E. 2021. Meteorological drivers of permian basin methane anomalies derived from TROPOMI. Remote Sens. 13(5):896.
- Das P, Mandal I, Pal S, Mahato S, Talukdar S, Debanshi S. 2022. Comparing air quality during nationwide and regional lockdown in Mumbai Metropolitan City of India. Geocarto Int. 1–24. DOI: 10.1080/10106049.2022.2034987.
- Davidović M, Dmitrašinović S, Jovanović M, Radonić J, Jovašević-Stojanović MJAS. 2021. Diurnal, temporal and spatial variations of main air pollutants before and during emergency lockdown in the City of Novi Sad (Serbia). Appl Sci. 11(3):1212.
- Delfi S, Mosaferi M, Khalafi A, Zoroufchi Benis K. 2018. Sulfur dioxide emissions in Iran and environmental impacts of sulfur recovery plant in Tabriz Oil Refinery. ه مدیریت و مهندسی بهداشت محیط. 5(3):159–166.
- Elshorbany YF, Kapper HC, Ziemke JR, Parr SA. 2021. The status of air quality in the united states during the COVID-19 pandemic: a remote sensing perspective. Remote Sens. 13(3):369.
- Faridi S, Yousefian F, Niazi S, Ghalhari MR, Hassanvand MS, Naddafi K. 2020. Impact of SARS-CoV-2 on ambient air particulate matter in Tehran. Aerosol Air Qual Res. 20(8):1805–1811.
- Filonchyk M, Hurynovich V, Yan H. 2021. Impact of Covid-19 lockdown on air quality in the Poland, Eastern Europe. Environ Res. 198:110454.
- Ghasempour F, Sekertekin A, Kutoglu SH. 2021. Google Earth Engine based spatio-temporal analysis of air pollutants before and during the first wave COVID-19 outbreak over Turkey via remote sensing. J Clean Prod. 319:128599.
- Ghotbi S, Sotoudeheian S, Arhami M. 2016. Estimating urban ground-level PM10 using MODIS 3km AOD product and meteorological parameters from WRF model. Atmos Environ. 141:333–346.
- Gorelick N, Hancher M, Dixon M, Ilyushchenko S, Thau D, Moore R. 2017. Google Earth Engine: planetary-scale geospatial analysis for everyone. Remote Sens Environ. 202:18–27.
- Goudie AS. 2014. Desert dust and human health disorders. Environ Int. 63:101–113.
- Hashim BM, Al-Naseri SK, Al-Maliki A, Al-Ansari N. 2021. Impact of COVID-19 lockdown on NO2, O3, PM2. 5 and PM10 concentrations and assessing air quality changes in Baghdad, Iraq. Sci Total Environ. 754:141978.
- Hassanvand MS, Naddafi K, Faridi S, Arhami M, Nabizadeh R, Sowlat MH, Pourpak Z, Rastkari N, Momeniha F, Kashani HJAE. 2014. Indoor/outdoor relationships of PM10, PM2. 5, and PM1 mass concentrations and their water-soluble ions in a retirement home and a school dormitory.Atmos Environ. 82:375–382.
- Heger M, Sarraf M. 2018. Air pollution in Tehran: health costs, sources, and policies. Environment and Natural Resources Global Practice Discussion Paper; No. 6. World Bank, Washington, DC. © World Bank.
- Hersbach H, Bell B, Berrisford P, Hirahara S, Horányi A, Muñoz‐Sabater J, Nicolas J, Peubey C, Radu R, Schepers D, et al. 2020. The ERA5 global reanalysis. QJR Meteorol Soc. 146(730):1999–2049.
- Hsu N, Jeong MJ, Bettenhausen C, Sayer A, Hansell R, Seftor C, Huang J, Tsay SC. 2013. Enhanced Deep Blue aerosol retrieval algorithm: the second generation. J Geophys Res Atmos. 118(16):9296–9315.
- Jethva H, Torres O, Yoshida Y. 2019. Accuracy assessment of MODIS land aerosol optical thickness algorithms using AERONET measurements over North America. Atmos Meas Tech. 12(8):4291–4307.
- Jia M, Zhao T, Cheng X, Gong S, Zhang X, Tang L, Liu D, Wu X, Wang L, Chen Y. 2017. Inverse relations of PM2. 5 and O3 in air compound pollution between cold and hot seasons over an urban area of east China. Atmosphere. 8(12):59.
- Kamali N, Zare Shahne M, Arhami M. 2015. Implementing spectral decomposition of time series data in artificial neural networks to predict air pollutant concentrations. Environ Eng Sci. 32(5):379–388.
- Karimi N, Namdari S, Sorooshian A, Bilal M, Heidary P. 2019. Evaluation and modification of SARA high-resolution AOD retrieval algorithm during high dust loading conditions over bright desert surfaces. Atmos Pollut Res. 10(4):1005–1014.
- Levy R, Mattoo S, Munchak L, Remer L, Sayer A, Patadia F, Hsu N. 2013. The Collection 6 MODIS aerosol products over land and ocean. Atmos Meas Tech. 6(11):2989–3034.
- Liu F, Wang M, Zheng M. 2021. Effects of COVID-19 lockdown on global air quality and health. Sci Total Environ. 755(Pt 1):142533.
- Liu N, Zou B, Feng H, Wang W, Tang Y, Liang Y. 2019. Evaluation and comparison of multiangle implementation of the atmospheric correction algorithm, Dark Target, and Deep Blue aerosol products over China. Atmos Chem Phys. 19(12):8243–8268.
- Liu Z, Hu B, Wang L, Wu F, Gao W, Wang Y. 2015. Seasonal and diurnal variation in particulate matter (PM 10 and PM 2.5) at an urban site of Beijing: analyses from a 9-year study. Environ Sci Pollut Res. 22(1):627–642.
- Lonati G, Riva F. 2021. Regional scale impact of the COVID-19 lockdown on air quality: gaseous pollutants in the Po Valley, Northern Italy. Atmosphere. 12(2):264.
- Lyapustin A, Wang Y, Korkin S, Huang D. 2018. MODIS collection 6 MAIAC algorithm. Atmos Meas Tech. 11(10):5741–5765.
- Marlier ME, Xing J, Zhu Y, Wang S. 2020. Impacts of COVID-19 response actions on air quality in China. Environ Res Commun. 2(7):075003.
- Meng X, Wu Y, Pan Z, Wang H, Yin G, Zhao H. 2019. Seasonal characteristics and particle-size distributions of particulate air pollutants in Urumqi. IJERPH. 16(3):396.
- Metya A, Dagupta P, Halder S, Chakraborty S, Tiwari YK. 2020. COVID-19 lockdowns improve air quality in the South-East Asian regions, as seen by the remote sensing satellites. Aerosol Air Qual Res. 20(8):1772–1782.
- Mhawish A, Banerjee T, Sorek-Hamer M, Lyapustin A, Broday DM, Chatfield R. 2019. Comparison and evaluation of MODIS Multi-angle Implementation of Atmospheric Correction (MAIAC) aerosol product over South Asia. Remote Sens Environ. 224:12–28.
- Mhawish A, Banerjee T, Sorek-Hamer M, Bilal M, Lyapustin AI, Chatfield R, Broday DM. 2020. Estimation of high-resolution PM2. 5 over the Indo-Gangetic plain by fusion of satellite data, meteorology, and land use variables. Environ Sci Technol. 54(13):7891–7900.
- Monks PS. 2005. Gas-phase radical chemistry in the troposphere. Chem Soc Rev. 34(5):376–395.
- Namdari S, Karimi N, Sorooshian A, Mohammadi G, Sehatkashani S. 2018. Impacts of climate and synoptic fluctuations on dust storm activity over the Middle East. Atmos Environ (1994). 173:265–276.
- Pishgar E, Fanni Z, Tavakkolinia J, Mohammadi A, Kiani B, Bergquist R. 2020. Mortality rates due to respiratory tract diseases in Tehran, Iran during 2008–2018: a spatiotemporal, cross-sectional study. BMC Public Health. 20(1):1–12.
- Rad AK, Shariati M, Zarei M. 2020. The impact of COVID-19 on air pollution in Iran in the first and second waves with emphasis on the city of Tehran. J Air Polluti Health. 5(3):181–192.
- Seinfeld JH, Pandis SN. 2006. Atmospheric chemistry and physics from air pollution to climate change. New York: John Wiley & Sons.
- Shahbazi H, Ganjiazad R, Hosseini V, Hamedi M. 2017. Investigating the influence of traffic emission reduction plans on Tehran air quality using WRF/CAMx modeling tools. Transp Res Part D: Transp Environ. 57:484–495.
- Shahbazi H, Reyhanian M, Hosseini V, Afshin H. 2016. The relative contributions of mobile sources to air pollutant emissions in Tehran, Iran: an emission inventory approach. Emiss Control Sci Technol. 2(1):44–56.
- Shahsavani A, Naddafi K, Jafarzade Haghighifard N, Mesdaghinia A, Yunesian M, Nabizadeh R, Arahami M, Sowlat MH, Yarahmadi M, Saki H, et al. 2012. The evaluation of PM10, PM2. 5, and PM1 concentrations during the Middle Eastern Dust (MED) events in Ahvaz, Iran, from April through September 2010. J Arid Environ. 77:72–83.
- Singh V, Singh S, Biswal A, Kesarkar AP, Mor S, Ravindra K. 2020. Diurnal and temporal changes in air pollution during COVID-19 strict lockdown over different regions of India. Environ Pollut. 266(Pt 3):115368.
- Sotoudeheian S, Arhami M. 2014. Estimating ground-level PM10 using satellite remote sensing and ground-based meteorological measurements over Tehran. J Environ Health Sci Eng. 12(1):1–13.
- Taghvaee S, Sowlat MH, Mousavi A, Hassanvand MS, Yunesian M, Naddafi K, CJSotte S. 2018. Source apportionment of ambient PM2.5 in two locations in central Tehran using the Positive Matrix Factorization (PMF) model. Sci Total Environ. 628:672–686.
- Tang G, Wang Y, Li X, Ji D, Hsu S, Gao X. 2012. Spatial-temporal variations in surface ozone in Northern China as observed during 2009–2010 and possible implications for future air quality control strategies. Atmos Chem Phys. 12(5):2757–2776.
- Voors R, de Vries J, Bhatti IS, Lobb D, Wood T, van der Valk N, Aben I, Veefkind P. 2017. TROPOMI, the Sentinel 5 Precursor instrument for air quality and climate observations: status of the current design. International Conference on Space Optics—ICSO 2012; International Society for Optics and Photonics.
- Wood EC, Herndon SC, Onasch TB, Kroll JH, Canagaratna MR, Kolb CE, Worsnop DR, Neuman JA, Seila R, Zavala M, et al. 2009. A case study of ozone production, nitrogen oxides, and the radical budget in Mexico City. Atmos Chem Phys. 9(7):2499–2516.
- Wyche K, Nichols M, Parfitt H, Beckett P, Gregg D, Smallbone K, Monks P. 2021. Changes in ambient air quality and atmospheric composition and reactivity in the South East of the UK as a result of the COVID-19 lockdown. Sci Total Environ. 755:142526.
- Xiang Y, Zhang T, Liu J, Lv L, Dong Y, Chen Z. 2019. Atmosphere boundary layer height and its effect on air pollutants in Beijing during winter heavy pollution. Atmos Res. 215:305–316.
- Yazdi MN, Delavarrafiee M, Arhami M. 2015. Evaluating near highway air pollutant levels and estimating emission factors: a case study of Tehran, Iran. Sci Total Environ. 538:375–384.
- Yoo J-M, Jeong M-J, Kim D, Stockwell WR, Yang J-H, Shin H-W, Lee M-I, Song C-K, Lee S-D. 2015. Spatiotemporal variations of air pollutants (O3, NO2, SO2, CO, PM10, and VOCs) with land-use types. Atmos Chem Phys. 15(18):10857–10885.
- Yousefian F, Faridi S, Azimi F, Aghaei M, Shamsipour M, Yaghmaeian K, Hassanvand MS. 2020. Temporal variations of ambient air pollutants and meteorological influences on their concentrations in Tehran during 2012–2017. Sci Rep. 10(1):1–11.
- Zhang Z, Arshad A, Zhang C, Hussain S, Li W. 2020. Unprecedented temporary reduction in global air pollution associated with COVID-19 forced confinement: a continental and city scale analysis. Remote Sens. 12(15):2420.