
Abstract
This paper proposes an approach of fusion geo-referenced and non-georeferenced data. These data can be acquired by a) unmanned surface vehicles (USVs), b) unmanned aerial vehicles (UAVs), c) airborne and submersible optical sensors, d) acoustic sensors and e) aquatic sound profiling instruments. The test scenario consisted of monitoring and morphological characterisation of a confined water body. As part of the data integration and processing process, object segmentation modules were implemented for tracking and identification of underwater fauna, accompanied by Structure-from-Motion (SfM) and multi-view stereophotogrammetry (MVS) techniques for 3D reconstruction. The results obtained make it possible to recreate morphological models of the study/test areas by coupling all the existing information above and below the water mirror. The spatial resolution obtained is of centimetric order and the resulting data have the ideal quality to be used in underwater mapping and monitoring, as well as in 3D geomorphological measurements of surface water bodies
Multi-source geo-referenced and non-georeferenced data fusion strategy
Mapping of surface water bodies using unmanned aerial/aquatic vehicles.
Application of segmentation techniques for monitoring and tracking of aquatic fauna.
Three-dimensional reconstruction of underwater environments at high spatial resolution
Robust framework for the integration of data from passive and active sensors
Highlights
1. Introduction
Since Galileo’s thermoscope in the sixteenth century (Taylor Citation1942), there have been many advances in the development of sensors to measure different physico-chemical variables in the environment. Another aspect to consider is the availability and efficiency has been improving with new technologies. Different types of passive and active sensors are available to remotely sense objects, typically attached to satellites or airborne, maritime and terrestrial platforms, as well as static measurement platforms. It is therefore necessary to integrate data from different sources in a multi-platform data fusion scheme that allows the original data to be individually robust. During the 1980s, some of the first works on sensor (Pau Citation1988)/data (Chair and Varshney Citation1986) integration appeared, and the term fusion began to be proposed (Baker et al. 1997). However it was Hacket and Shah (Hackett and Shah Citation1990) who published the first classification and compilation of the state of the art on sensor and data fusion using this term in a formal way. Later, Wald (Citation1999) presents a review, analyzing the obstacles to date, discusses the need for a consensus on the terms and concepts of data fusion definitions and proposes a more appropriate definition in the field of remote sensing. Data fusion is a formal framework that expresses the means and tools for combining data from different sources, and aims to obtain higher quality information, and adds that: data fusion should be seen as a methodological framework and not simply as a collection of tools and means.
A great diversity of sensors such as multispectral and hyperspectral optical sensors had evolved considerably in the last two decades (Bioucas-Dias et al. Citation2013). On the other hand, Khodadadzadeh, (Khodadadzadeh et al. Citation2015) presented his proposal for data fusion from LIDAR technology. SAR synthetic aperture radar has been widely used above the Earth’s surface. However, to reach the depths of oceans, rivers and lakes, acoustic sensors and SONAR are the most efficient technology below the water surface. This wide variety of environments with unique characteristics requires a wide variety of sensors and platforms capable of transporting them. Sensors are becoming increasingly advanced, lightweight and rugged. Platforms, on the other hand, are constantly increasing in capabilities and variety. For a long time, airplanes were the ideal platform for carrying optical sensors; later acoustic sensors appeared on ships. The development of space flight made it possible to overcome the earth’s atmospheric barrier by allowing satellites to be placed in orbit. Recently, the development of unmanned autonomous platforms has been highlighted; unmanned aerial vehicle (UAV) are the most widely used (Watts et al. Citation2012). It should be noted that technological advances have reduced the cost of platforms and sensors, making them indispensable tools for multiple users, who have found in these devices an alternative to the high costs, inconveniences or dangers that can occur with traditional platforms (Carrivick et al. Citation2013).
Recently, research towards integrating platforms, sensors and data has increased. As well as proposals for monitoring geophysical, meteorological, environmental and industrial phenomena using UAV systems (Villalpando et al. Citation2020; Nikolakopoulos et al. Citation2018) and relying on other ground-based sensors (Dąbrowski et al. Citation2021; Alcarria et al. Citation2018). Its growing use in ecology and geosciences, for the analysis of geological outcrops (Tavani et al. Citation2014) and for the modelling of their facies characteristics (Assali et al. Citation2014), as a tool in paleoseismology (structural Haddad et al. Citation2012) and geology applications (Bemis et al. Citation2014) should be highlighted. There are also works for monitoring and evaluation of topographic changes in coastal areas (Gesch and Wilson Citation2001; Gonçalves and Henriques Citation2015; Genchi et al. Citation2020), integrated environmental mapping and monitoring IEMM (Nilssen et al. Citation2015) in marine environments. As well as the development of prototype platforms that integrate echo sounders and multispectral cameras for bathymetric and environmental measurements in shallow waters (Specht et al. Citation2021; Giordano et al. Citation2015). Current remote sensing work is often carried out in complex heterogeneous environments, areas where different types of soil and vegetation converge with bodies of water. In this scenario, sensors based on microwave radiation are not suitable to penetrate the aquatic environment. On the other hand, those based on light detection and ranging are more efficient in water. Images obtained from the air are widely used although their quality depends on water and light conditions (Gao Citation2009). The type of platform on which the sensor is mounted plays an important role, so the use of autonomous air/land or aquatic systems optimizes sample acquisition. Therefore, the goal of this research is to propose a framework that allows the ingestion and adequacy of the information regardless of the source and of such fundamental characteristics as the geolocation of the data. As a test application, a shallow water body is considered where data (photographs and video) were acquired with multispectral optical cameras. The sensors were placed inside and outside the water body, being the underwater data (video) the ones lacking a geolocation. The article is structured as follows: the first section is an introduction to geospatial data fusion and its integration in different platforms and applications. Section 2 mentions the area where the data fusion scheme was tested, Section 3 describes the sensors and data used in the implementation, the methodology is described in Section 4 of this manuscript and finally the results and conclusions are shown in Sections 5 and 6, respectively.
2. Experimentation and testing area
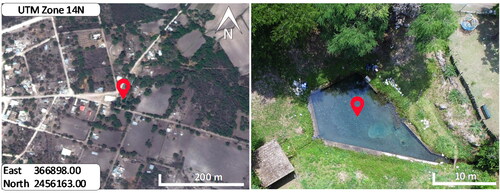
The test area is an isolated body of water in a small depression in the terrain (see ), creating a pond. The pond is fed by a spring that emerges in the depths of the water, modifying the morphology of the bottom and forming structures similar to craters or funnels. Although in this area, the water is transparent and there is no current, there is a considerable amount of algae suspended near the surface. The depth of the pond is 1.2 m at the deepest part with an average depth value of 0.85 m.
Figure 1. The general location of the study area is shown in the first box of the image, it is a pond fed by a spring submerged in the bottom. The second box on the right shows an aerial view of the pond in more detail from an image taken from the UAV.
3. Sensors and data
As a first stage of development, multispectral optical sensors (Chen et al. Citation2022) were considered as an ideal alternative for the study due to their versatility to capture information above and below the water surface. It is important to note that optical sensors have limitations to penetrate water bodies. The natural solution for this medium (water) is the use of ultrasonic sensors such as echo sounders. However, these are expensive devices. A low-cost alternative that allows mapping the bottom of the water body is to use an optical sensor coupled to an aquatic vehicle and that the sensor is strategically located below the water mirror avoiding the problematic change of medium (air-water) and minimizing its effects. This option has as a challenge to solve that the optical sensor that is introduced into the water is not possible to have GPS information so the acquired data will not be georeferenced and it will be necessary to establish a 3D reconstruction model directly from the geometric characteristics of identifiable objects in the video/photographs recorded with the sensor. The sensors used were mounted on an aquatic platform and an aerial AUV of the DJI Company. The main characteristics of each sensor are: a) Camera in aquatic platform FujiXP90 sensor, resolution of 16 MP, RGB spectral bands of operation (400–700 nm) and does not contain GPS. Therefore, the acquired data are not georeferenced and b) optical camera on DJI platform whose main features are Sony Exmor sensor, 12.4 MP resolution, RGB colour-space and in this case, it has integrated GPS. It is important to note that low-cost devices were chosen for the design and integration of this prototype. One of the challenges to overcome and that is important in this work is to fuse information from two sensors when part of the information is not referenced, a situation that greatly increases the complexity of the fusion.
3.1. Sensor characterization
The initial phase, considered as step 0, is the sensor characterization. Given the lack of GPS in the camera that was mounted on the aquatic platform, several experiments were performed inside the laboratory with the intention of obtaining controlled conditions. shows some of the characterization tests performed.
Figure 2. Tests in a controlled environment: a) laboratory test, b) trawling platform, c) aquatic environment test aquarium.
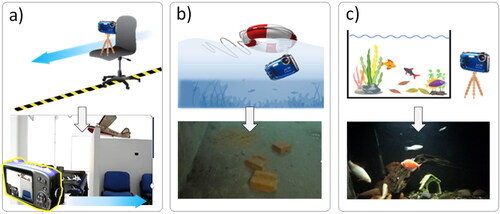
The first test () aims to find the optimal degree of scene-to-scene overlap. This task was very important, since the purpose of the aquatic camera is to generate three-dimensional topography of the bottom of the water body. The test was implemented in the laboratory by attaching the camera to a mobile platform while capturing the images. The next test () was to perform trajectories inside a water container (pond), so it was necessary to build a floating device that could carry the camera. A floating device was designed, the submersible camera was attached to the ventral area of the device and introduced into a tank of water. The device was manually towed, and different objects were placed on the bottom of the tank to measure the accuracy of the images acquired. In this test the first estimators were developed to measure objects from the sensor’s manufacturing characteristics as a function of the distance (depth) between camera and target. The third laboratory test () consisted of continuously capturing information from moving objects. For this purpose, an aquarium and different fish inside it were used. The illumination conditions were similar to the measurements made in the previous test, i.e. low luminosity was chosen with the intention of replicating a typical scenario in field observations where poor ambient light conditions or turbidity are present.
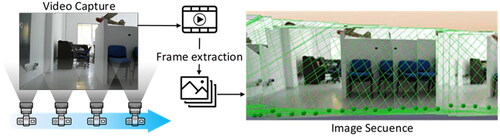
In each test, the information acquired was stored in a 60 frames per second video format, acquiring a large amount of information in each test. It is worth mentioning that during the data processing a resampling was applied selecting 1 frame for every 30, that is, 2 frames per second of video. From these ‘snapshots’, enough information was obtained to achieve picture data overlapping, as shown in . This same methodology was applied in experiment 2, related to the pond.
Figure 3. Non-georeferenced data acquisition and sequence image generation.
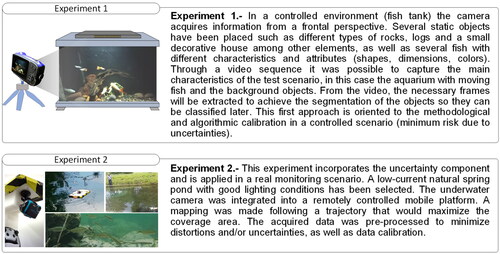
Once these images are obtained, it is possible to use stereoscopic vision tools, as well as digital photogrammetry (Shmueli et al. Citation2015). After performing these procedures it is possible to perform the next step, in which a 3D reconstruction of the environment could be performed (Rumpler et al. Citation2017). With this 3D model it is possible to record the particular features of the surface of the studied environment, and the objects that are inside it. But a very important aspect is that in addition to being able to obtain high-resolution 3D underwater mapping (Menna et al. Citation2018) it is also very convenient to be able to recognize and separate moving objects from fixed elements (Bugeau and Pérez Citation2009). To address this challenge, we initially experimented with a smaller scale body of water, a fish tank, and later validated it in a small lake. The considerations in each experiment are shown in .
Figure 4. Experiment approach to segment moving objects from background objects. Experiment 1: controlled environment, fish tank, Experiment 2: real environment–small lake.
3.2. Segmentation test and identification of moving objects
The general procedure to identify moving objects from background objects starts with a thresholding and binarization of the snapshots. Objects that do not belong to the background can be determined by the absolute difference between frames. To segment the objects of an image we are interested in, we use a threshold, i.e. a value that allows us to decide which pixels compose the objects we are looking for and which pixels are only the environment of these objects (See ). This method uses the grayscales of the image, so it is necessary to make a previous treatment (step1). In order to identify moving objects not only from the static background, it is necessary to identify object boundaries and close shapes (step 2). This method is based on two basic properties of the grey level values (discontinuity and similarity). Discontinuity divides the image based on sudden changes in grey level (detection of single points, lines and edges), similarity on the other hand divides the image based on the search for areas that have similar values (threshold, region growth).
Figure 5. General workflow chart, starting with the reading and matching of the input data, continuing with the data processing, followed by the object segmentation process and ending with the moving object detection process.
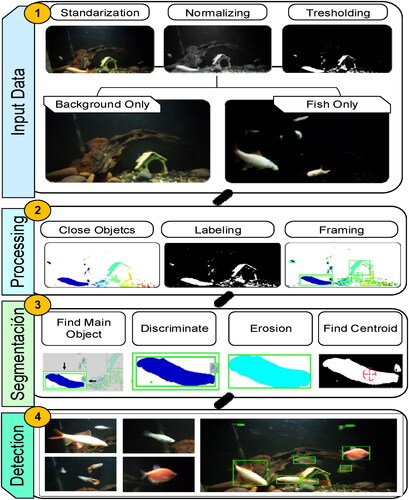
At this point the element of interest has been identified, the next step is to segment it and delimit the identification area. Additionally, the centroid of the object is calculated (step 3), which will be necessary for an accurate identification of the fish, since even if it moves in different positions, the geometric proportions remain constant, providing a reliable identification criterion.
The previous steps allow separating the moving objects from the background objects, so now these procedures are applied iteratively to the resampled video sequence achieving to track the objects that appear in the video, which will allow performing the process from frames obtained simultaneously to the video transmission in near real time (step 4). The processes shown in each of the stages were developed and implemented under the MATLAB program.
4. Methodology
Organizing and reformatting information from multiple platforms and sensors is an arduous task that requires a well-defined structure. In this section, it’s present an alternative for the generation of 3D underwater environments from aerial and aquatic platform data with the peculiarity that the input data can be georeferenced or non-georeferenced. shows the general structure for data fusion. It consists of four main steps and a characterization step, which is called step 0. Sections 3.1 and 3.2 showed the calibration and characterization of the multispectral optical sensor that was attached to a homemade aquatic platform. The camera used to acquire aerial data is the original with the phantom equipment of the DJI Company, this sensor has GPS and is very well characterized in the specifications of the same brand (https://www.dji.com/phantom-3/info).
Figure 6. Proposed methodological scheme for the fusion of heterogeneous and multiplatform information.
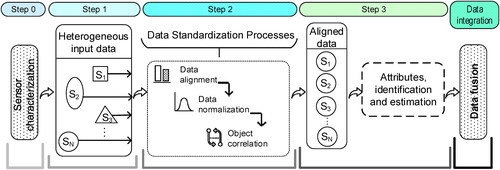
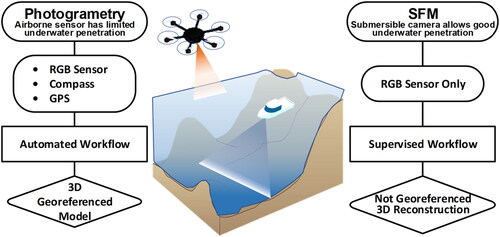
Step 1 consists of acquiring data from different platforms. In this research, it was proposed to merge aerial and aquatic data from multispectral optical sensors. The challenge is to generate a framework that integrates both data even though the data acquired from the aquatic platform are not georeferenced. The main motivation for Data Fusion is to improve the quality of the result by maximizing the strengths of each of the sensors used. As can be seen in , image-based sensors are dependent on the penetration of light into the medium (Hare Citation1994). Likewise, when there is a reflection of the sun on the water surface, it is impossible to see beyond the water mirror. Another scenario is when there are shadows produced by some object that prevent the penetration of light into the water causing a lack of information in the images. These problems can be solved by placing a suitable sensor inside the aquatic environment, i.e. under the water surface. This allows to eliminate the variables related to the change of air/water environment and to fill in the information gaps in the images taken from the air. This strategy proposes the generation of a virtual environment of the underwater level with real metrics (distances, shapes, structures, etc.) but without geolocation. To add the spatial information we take as reference (control points) the identifiable elements of both data sets (images acquired by the UAV and the video captured by the submerged sensor).
Figure 7. Comparative table of methodologies used in the study. In the centre there is a representation of the application scenario and the different stages of each method associated to its respective UAV-USV platform.
It was necessary to implement a platform capable of transporting the aquatic sensor. The device built was very basic but functional allowing remote manipulation and control (See ). The remotely operated platform is a simple, low-cost operating device. It is constructed of extruded polystyrene to give it high buoyancy, low weight and small size. A motorized propulsion system and rudders were also added for control.
Figure 8. The first row shows the main characteristics of the XP90 submersible sensor, then a simplified diagram of the main characteristics of the remote platform and the sensor, the model and characteristics of the sensor mounted on the UAV are shown in the last row of the diagram.
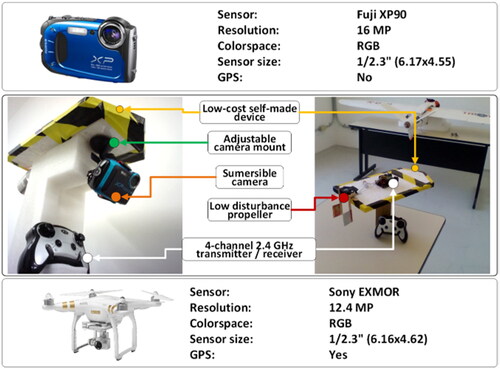
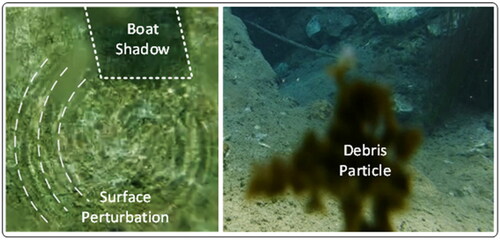
The sensor was installed at the bottom of the boat in an articulated mounting, taking into account the centre of gravity to avoid changes in the inclination when applying power and to reduce the movement due to waves. Transmission/reception distance tests were performed with and without obstacles between the receiver and the transmitter, achieving an effective control distance of about 116 m with line of sight and about 50 m with obstacles. The data acquired by the aquatic platform are particularly complex due to the nature of the sensing. One of the factors to consider in this type of platform is the surface perturbation caused by the movement of the platform in the water mirror as well as the various sediments or elements suspended in the water. shows these conditions.
Figure 9. The platform can produce alterations in the water surface distorting the image obtained and the suspended matter can generate anomalies in the captures or completely obstruct the vision of the sensor.
The second stage of image capture in the test areas consisted of capturing images from the air to complement the underwater shots of the test area, using a commercial UAV model Phantom 3 suitable for this purpose. Data standardization processes are part of step 2. The main actions to be performed are data alignment, object correlation and information standardization.
In order to have a better correlation between the data acquired by both platforms, we chose to perform special mapping trajectories for each platform. For aerial platforms the trajectories are usually in scanning lines in rectangular areas also called ‘front and back’ to form a mesh (Franco and Buttazzo Citation2016) efficient in coverage and energy expenditure. The flight height was 50 m, obtaining a surface spatial resolution of 3 cm. Four control points were measured with a differential GPS to increase the accuracy of the data acquired. In the case of the sensor to capture information below the lagoon surface, which has the geometry of an irregular polygon, a spiral trajectory is desirable (Cabreira et al. Citation2019) that favours navigation through the turning range of the vessel and allows better coverage at the corners and edges of the lagoon. This is especially important given that the mobile platform does not have GPS, so the information obtained is located and oriented only with the points of correspondence between the images. Considering the above, a continuous video was captured with a duration of 11:49 min with a resolution of 1280 × 720 pixels at 60 frames per second. Six frames were sampled for each second of filming to reduce the sample size, obtaining 7,090 frames of the pond bottom.
The approach to 3D reconstruction depends on the characteristics of the environment, the sensor and the platform. In the proposed case, the fundamental difference lies in the absence of geospatial information from the underwater camera, this directly influences the choice of tools for information processing. Currently, there is a wide variety of specialized software available that allows appropriate data to be entered, output parameters to be selected and the program to be run. Causing the user to often overlook the strengths and weaknesses of the methodology and software, which can lead to it being used as a black box into which data is entered and results are obtained automatically (Remondino et al. Citation2017). This could be verified in the first result obtained using the commercial software Pix4D that through its automated workflow did not obtain an adequate reconstruction as shown in (middle section) of the underwater captures, obtaining point clouds without geometric coherence. However, the result was as expected considering the anomalies in the images and the lack of georeferenced data.
Figure 10. Table contrasting the results of the 3D reconstruction in relation to the workflow used for the 3D reconstruction (supervised and unsupervised) and to the platform used (UAV-USV).
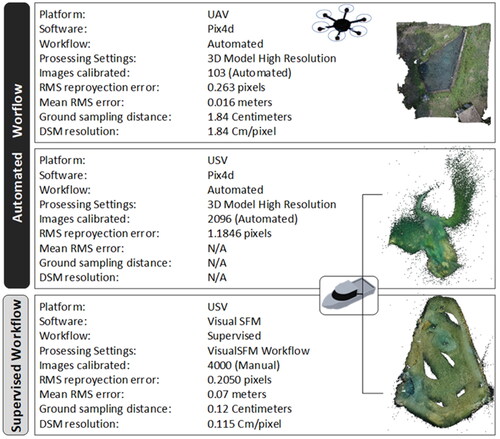
Therefore, it was decided to use a supervised method, supported by the open source software VisualSFM for 3D reconstruction and CloudCompare for point cloud validation. Resulting in the homogenization of data from both platforms and sensors. The results of the automated and supervised workflow are also shown in .
Step 3 starts with the alignment and adequacy of the data. The case analyzed in this manuscript contemplates the compatibility of geo-referenced and non-georeferenced data. As already mentioned, surveys without the use of GPS require good area coverage and image quality to have more key points, as these are dependent on texture and resolution. From the route shown in , 4000 frames were extracted with which it was possible to obtain a good quality 3D reconstruction of the pond’s morphology.
Figure 11. Upper view of the study area and geometric path calculated from supervised SFM, in a) the result of the point cloud obtained is shown, in b) the path reconstructed from the resulting cloud is shown, the digital terrain model is shown in c) and the digital elevation model in d).
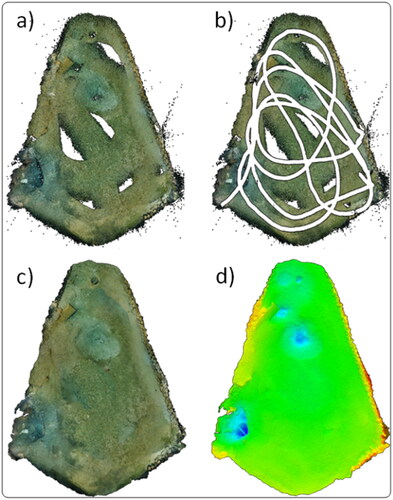
The resulting scattered point cloud using the SFM technique, appears in , discontinuities in the densification are observed, these correspond to areas where there was less overlap given the navigation paths and the texture of the background, which in these areas is too homogeneous. shows the point cloud below the navigation trajectory of the USV platform, this trajectory could be reconstructed from the point cloud resulting from the application of SFM. shows a digital model of the water bottom. It was generated from the dense cloud, obtaining a detailed reconstruction in the lower crater-shaped parts that correspond to springs; this explains the difference in colouring with respect to the rest of the background. Finally, the digital elevation model in . The data are ready to be integrated with the georeferenced data acquired by the airborne sensor.
5. Results: Data fusion & 3D reconstruction solution strategies
The data fusion shown in this article involves multispectral optical sensors. The importance of this article is to integrate georeferenced and non-georeferenced data for the reconstruction of 3D environments in water bodies at the surface level and underwater data. In addition, this fusion method also involves the interaction of two different 3D reconstruction techniques, the SFM and MVS technique. SFM was oriented towards aerial data, while Multi View Stereo (MVS) was applied to non-georeferenced data from the water platform. The framework obtained, SFM-MVS, allows the advantages of each model to be exploited and their weaknesses to be minimized.
The processing of the air and water data sets was carried out in a differentiated way in the first stage, this because finding coincidences between key points would be computationally inefficient given the difference between the characteristics and capacities of both sensors, as well as the orientation of the cameras and the number of frames used in each case. Both techniques are based on image-based terrain feature extraction algorithms, but with different strategies, in conventional photogrammetry the position and orientation of the camera is possessed in advance, while in SFM approach the camera orientation and scene geometry are simultaneously reconstructed through automatic identification of matching features in multiple images.
Thus, to geometrically and spatially assemble both point clouds, the most important coinciding points were identified, which correspond to the depressions of springs, rocks of defined shapes and elements of differentiable colouring. Once identified, the orientation, scale and positioning of the point cloud obtained from the USV platform was corrected, using the UAV cloud as a reference. To validate the result of the referencing of the clouds, a cloud-to-cloud analysis was carried out to measure the accuracy of alignment and positioning using the open source software CloudCompare (). It is important to mention that the comparison allowed to a) identifying geometrically and morphologically objects in both scenes, b) transferring georeferencing to the non-georeferenced cloud and c) checking spatial coherence in both point clouds. It is also required to ratify that from the georeferenced cloud the shallow identifiable objects were selected, as well as those at the water mirror level, shown in yellow circles in . Subsequently, the underwater cloud was oriented and georeferenced taking the selected objects as control points; the estimated depth levels (bathymetry) is that obtained from the reconstruction of the underwater camera already georeferenced and these data were used to calibrate the data obtained by the aerial drone, thus achieving a feedback or double level correction, making the fusion of both point clouds with different characteristics more efficient.
Figure 12. Comparison between UAV and USV point clouds. The scale indicates the absolute relative distances found between the two point clouds.
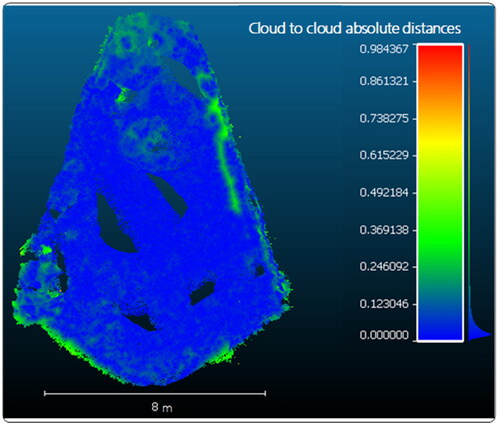
Figure 13. 3D reconstruction of data fusion from the platform used (UAV-USV).
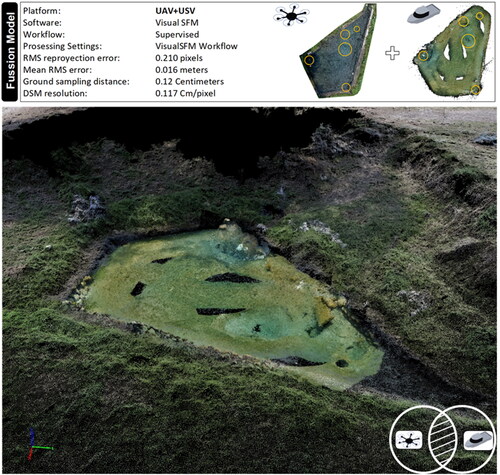
As shown in , more than 70% of the points compared have absolute distances <0.082 m, which is a fairly accurate result considering the platforms, sensors and methods used for data collection, the different sampling distances in the field and densities in each of the point clouds as well as the photogrammetric methods used.
Once the UAV and USV point clouds have been validated they can be merged into a 3D reconstruction, the results of the merging of both clouds are very similar to the first result of the UAV photogrammetric method (see ). This indicates that the coupling of both point clouds did not cause a significant change in the resolution and accuracy of the model taking into account the low number of coincident reference points in both point clouds and without the use of GPS control point.
6. Conclusions
This work shows a comprehensive methodology for the coupling of spatially referenced and non-georeferenced data. The main capabilities of the proposed methodology are: a) tracking, segmentation and tracking of objects in an underwater environment, b) alignment of data from commercial and homemade platforms and c) recreation of 3D virtual scenarios from data fusion applying SFM-MVS techniques.
Segmentation techniques were used to identify and track objects in the test environment. In this test case the fish of the rest of the aquarium, and identify the objects from frames extracted from a video sequence. The process of subsampling frames was very important as it allowed to reduce the number of frames to be processed and in the particular case of the segmentation procedure to allow a near-real-time execution.
The proposal also highlights the relevance of using an aquatic platform, specially developed for this study, which together with a submersible optical sensor, proved to be efficient when deployed in the field. The device is very low cost and simple to operate, ideal for use in surface water bodies. As a complement to the surface vehicle, an unmanned aerial vehicle was used in conjunction with the surface vehicle, which when operated together achieved complete coverage of the study area, obtaining information above and below the surface of the water body and the surrounding terrain.
The relevance of applying SFM and MVS techniques for the reconstruction of underwater and aerial photogrammetric information was validated. It was also proposed to merge the 3D reconstructions of each technique into a single model. This resulted in a morphological model that integrates the information above and below the water mirror with sufficient quality to be a suitable option for mapping, monitoring and three-dimensional measurements of surface water bodies. All this without the need for complex GPS devices and achieving accuracies of the order of 0.016 m using point clouds with different point densities and obtained by different techniques.
Disclosure statement
No potential conflict of interest was reported by the author(s).
Data availability statement
The data supporting this study’s findings are available from the corresponding author, upon reasonable request.
References
- Alcarria R, Bordel B, Manso MÁ, Iturrioz T. 2018. Analyzing UAV-based remote sensing and WSN support for data fusion. In: Álvaro Rocha, Teresa Guarda, editors. ICITS2018. Proceedings of the International Conference on Information Technology & Jan 10–12; Libertad City (ECU) Systems, vol. 721. Cham: Springer International Publishing.
- Assali P, Grussenmeyer P, Villemin T, Pollet N, Viguier F. 2014. Surveying and modeling of rock discontinuities by terrestrial laser scanning and photogrammetry: semi-automatic approaches for linear outcrop inspection. J Struct Geol. 66:102–114.
- Baker K, Bermingham J, McDonald C. 1997. Data fusion: an appraisal and experimental evaluation. J Mark Res Soc. 39(1):1–12.
- Bemis SP, Micklethwaite S, Turner D, James MR, Akciz S, Thiele ST, Bangash HA. 2014. Ground-based and UAV-based photogrammetry: a multi-scale, high-resolution mapping tool for structural geology and paleoseismology. J Struct Geol. 69:163–178.
- Bioucas-Dias JM, Plaza A, Camps-Valls G, Scheunders P, Nasrabadi N, Chanussot J. 2013. Hyperspectral remote sensing data analysis and future challenges. IEEE Geosci Remote Sens Mag. 1(2):6–36.
- Bugeau A, Pérez P. 2009. Detection and segmentation of moving objects in complex scenes. Comput Vis Image Underst. 113(4):459–476.
- Cabreira TM, Brisolara LB, Ferreira Paulo R. 2019. Survey on coverage path planning with unmanned aerial vehicles. Drones. 3(1):4– 38.
- Carrivick JL, Smith MW, Quincey DJ, Carver SJ. 2013. Developments in budget remote sensing for the geosciences. Geol. Today. 29(4):138–143.
- Chair Z, Varshney PK. 1986. Optimal data fusion in multiple sensor detection systems. IEEE Trans Aerosp Electron Syst. 22(1):98–101.
- Chen R, Xu J, Zhang S. 2022. Comparative study on 3D optical sensors for short-range applications. Opt Lasers Eng. 149:106763.
- Dąbrowski PS, Specht C, Specht M, Burdziakowski P, Makar A, Lewicka O. 2021. Integration of multi-source geospatial data from GNSS receivers, terrestrial laser scanners, and unmanned aerial vehicles. Can J Remote Sens. 47(4):621–634.
- Franco DC, Buttazzo G. 2016. Coverage path planning for UAVs photogrammetry with energy and resolution constraints. J Intell Robot Syst. 83(3–4):445–462.
- Gao J. 2009. Bathymetric mapping by means of remote sensing: methods, accuracy and limitations. Prog Phys Geogr Earth Environ. 33(1):103–116.
- Genchi SA, Vitale AJ, Perillo GME, Seitz C, Delrieux CA. 2020. Mapping topobathymetry in a shallow tidal environment using low-cost technology. Remote Sens. 12(9):1394.
- Gesch D, Wilson R. 2001. Development of a seamless multisource topographic/bathymetric elevation model of Tampa Bay. Mar Technol Soc J. 35(4):58–64.
- Giordano F, Mattei G, Parente C, Peluso F, Santamaria R. 2015. Integrating sensors into a marine drone for bathymetric 3D surveys in shallow waters. Sensors. 16(1):41.
- Gonçalves JA, Henriques R. 2015. UAV photogrammetry for topographic monitoring of coastal areas. ISPRS J Photogramm Remote Sens. 104:101–111.
- Hackett JK, Shah M. 1990. Multi-sensor fusion: a perspective. Proceedings of the IEEE International Conference on Robotics and Automation, vol. 2, pp. 1324–1330.
- Haddad DE, Akciz SO, Arrowsmith JR, Rhodes DD, Oldow JS, Zielke O, Toke NA, Haddad AG, Mauer J, Shilpakar P. 2012. Applications of airborne and terrestrial laser scanning to paleoseismology. Geosphere. 8(4):771–786.
- Hare R. 1994. Calibrating Larsen-500 lidar bathymetry in dolphin and union strait using dense acoustic ground-truth. Int Hydrogr Rev. 71(1):91–108.
- Khodadadzadeh M, Li J, Prasad S, Plaza A. 2015. Fusion of hyperspectral and LiDAR remote sensing data using multiple feature learning. IEEE J Sel Top Appl Earth Obs Remote Sens. 8(6):2971–2983.
- Menna F, Agrafiotis P, Georgopoulos A. 2018. State of the art and applications in archaeological underwater 3D recording and mapping. J Cult Herit. 33:231–248.
- Nikolakopoulos KG, Lampropoulou P, Fakiris E, Sardelianos D, Papatheodorou G. Synergistic use of UAV and USV data and petrographic analyses for the investigation of beachrock formations: a case study from Syros Island, Aegean Sea, Greece. Minerals 2018, vol. 8. p. 534.
- Nilssen I, Ødegård Ø, Sørensen AJ, Johnsen G, Moline MA, Jø B. 2015. Integrated environmental mapping and monitoring, a methodological approach to optimise knowledge gathering and sampling strategy. Mar Pollut Bull. 96(1–2):374–383.
- Pau LF. 1988. Sensor data fusion. J Intell Rob Syst. 1(2):103–116.
- Remondino F, Nocerino E, Toschi I, Menna F. 2017. A critical review of automated photogrammetric processing of large datasets. Int Arch Photogramm Remote Sens Spat Inf Sci-ISPRS Arch. 42(2W5):591–599.
- Rumpler M, Tscharf A, Mostegel C, Daftry S, Hoppe C, Prettenthaler R, Fraundorfer F, Mayer G, Bischof H. 2017. Evaluations on multi-scale camera networks for precise and geo-accurate reconstructions from aerial and terrestrial images with user guidance. Comput Vis Image Underst. 157:255–273.
- Shmueli J, Eder MA, Tesauro A. 2015. A versatile stereo photogrammetry based technique for measuring fracture mode displacements in structures. Precis Eng. 39:38–46.
- Specht M, Stateczny A, Specht C, Widźgowski S, Lewicka O, Wiśniewska M. 2021. Concept of an innovative autonomous unmanned system for bathymetric monitoring of shallow waterbodies (INNOBAT System). Energies. 14(17):5370.
- Tavani S, Granado P, Corradetti A, Girundo M, Iannace A, Arbués P, Muñoz JA, Mazzoli S. 2014. Building a virtual outcrop, extracting geological information from it, and sharing the results in Google Earth via OpenPlot and photoscan: an example from the Khaviz Anticline (Iran). Comput Geosci. 63:44–53.
- Taylor FS. 1942. The origin of the thermometer. Ann Sci. 5(2):129–156.
- Villalpando F, Tuxpan J, Ramos-Leal JA, Carranco-Lozada S. 2020. New framework based on fusion information from multiple landslide data sources and 3D visualization. J Earth Sci. 31(1):159–168.
- Wald L. 1999. Some terms of reference in data fusion. IEEE Trans Geosci Remote Sens. 37(3):1190–1193.
- Watts AC, Ambrosia VG, Hinkley EA. 2012. Unmanned aircraft systems in remote sensing and scientific research: classification and considerations of use. Remote Sens. 4(6):1671–1692.