
 ?Mathematical formulae have been encoded as MathML and are displayed in this HTML version using MathJax in order to improve their display. Uncheck the box to turn MathJax off. This feature requires Javascript. Click on a formula to zoom.
Abstract
The manual process of plant leaves disease detection takes more time to perform. To achieve successful classification results, a flawless feature extraction process is required for a detection model. Aiming at the localization of diseased-plant leaves, this paper performs complex tasks like segmentation, and multi-disease classification of plant leaves using ‘improved segmentation, feature extraction, and classification’ models. Here, the Adaptive Fusion of K-Means Region Growing (AFKMRG) accomplishes the abnormality segmentation of leaves. The extracted features are subjected to the Enhanced Long short-term memory (LSTM) for performing the multi-disease classification. Here, the segmentation, classification, and feature extraction are improved by the Fitness Sorted Jaya-Forest Optimization Algorithm (FSJ-FOA). From the empirical results, the accuracy and precision of the designed method is attains 98.35% and 98.40% for all kinds of leaves. Results show that the designed multi-disease classification of plant leaves method provides elevated performance with diverse performance metrics.
1. Introduction
The development of the country is mainly based on its agricultural practices in it. So, it is necessary to maintain the crops as healthier as possible (Hang et al. Citation2019). The seasonal variations may cause some defects to the plant leaves, which affect the growth of plants. Multiple types of diseases can affect the plant leaves and the most common types of diseases among them are dwarf mosaic, brown spot, curvulria leaf spot, gray leaf spot, northern leaf bright, round spot, rust, and southern leaf bright (Taujuddin et al. Citation2020). Initially, these diseases gradually affect the plant leaves and further affect the entire plant thereby reducing the quality and quantity of the crops. The identification and classification of these diseases of each plant leaf are hard for the normal human eye since there are an enormous amount of plants on a single farm (Wiesner-Hanks and Nelson Citation2016). However, it is essential to identify each plant since a single infected leaf of a plant can spread the disease gradually to the whole plant. The use of pesticides without awareness may spoil the land, and hiring professionals may be expensive for the farmers (Prasad et al. Citation2016). It is essential to detect the exact diseases for preventing them from further spreading. Therefore, the primary source of disease detection is routine monitoring of plant leaves by using automated plant leaf disease detection technology (Min and Htun Citation2018; Liang et al. Citation2019).
The multi-disease detection and classification of plant leaves should be done accurately in a short period to prevent unnecessary waste of resources. Advanced analysis is not possible when the disease affected the plant leaves without any explicit symptoms. Still, the maximum number of plants reveal explicit symptoms, which are diagnosed by the plant pathologist based on the optical observations of the affected leaves of plants (Sileshi et al. Citation2016; Simmi et al. Citation2020). However, plant pathologists face some difficulties in the accurate prediction of plant disease due to the availability of an excessive variety of plants and the earlier spread of diseases during seasonal changes. The detection of characteristic symptoms of plant leaves diseases is hard for pathologists due to a lack of skills in observation and unawareness of certain diseases (Singh and Misra Citation2017; Goodridge et al. Citation2017).
In (Dai et al. Citation2020) have developed a Generative Adversarial Network with Dual-Attention and Topology-Fusion mechanisms termed DATFGAN. In (Sharma et al. Citation2020) have proposed a new approach with artificial intelligence for the detection and classification of leaf diseases in an automatic manner. In (Atila et al. Citation2021) have developed an architecture based on deep learning called EfficientNet for the classification of disease leaves. In (Zhang et al. Citation2018) have developed two improved deep learning-based models such as improved GoogLeNet and Cifar10 models for highly accurate maize leaf disease detection. In (Liu et al. Citation2020) have developed a new approach based on GANs named LeafGAN to generate four dissimilar grape leaf disease images for training the detection models. The proposed model has provided a feasible solution for data augmentation of images and generated adequate leaf images. In (Chen et al. Citation2020) have proposed a new approach based on image processing techniques for the automatic detection and classification of plant leaf diseases. In (Singh et al. Citation2018) have introduced a method namely Bacterial foraging optimization based on Radial Basis Function Neural Network (BRBFNN). In (Pham et al. Citation2020) have proposed a wrapper-based feature selection approach using an adaptive particle-grey wolf hybrid meta-heuristic algorithm.
In recent decades, the automated detection and classification of multiple diseases of plant leaves have been executed by various classical machine learning models. However, the models are designed through limited-resolution images. Therefore, deep learning methods provide great benefits in multi-disease detection and classification of plant leaves with less time and high accuracy. The deep learning methods are used to extract optimal feature representations from a large image dataset and also ensure the scope of computer vision in the precision agriculture field (Vellaichamy et al. Citation2021; Krishnamoorthy et al. Citation2021). CNN-based model is trained for identifying plant leaf diseases (Ramesh and Vydeki Citation2020). The CNN-based models improve the identification accuracy based on modifying the ratio of the size of the training set to the testing set al.though the CNN models have obtained better results, the recognition rate is reduced by the usage of more parameters and longer training convergence times (Hang et al. Citation2019; Gokulnath and Devi Citation2021). AlexNet model is implemented to combine global pooling and batch normalization for the identification of various leaf diseases, and these studies based on CNN models define the effectiveness of Deformable Convolution Neural Networks (DCNNs) to identify leaf diseases (Naz et al. Citation2019). However, the images obtained from the farms have poor quality, which leads to a reduced accuracy rate of pre-trained classifiers that are already trained based on high-quality image datasets (Sachdeva et al. Citation2021). Hence, the multi-disease leaf detection and classification uses several digital image processing techniques. However, these methods cannot achieve a high recognition rate when dealing with a large number of samples (Sachdeva et al. Citation2021). Therefore, it is essential to introduce improved methodologies for the efficient detection and classification of plant leaves that are affected by multiple diseases.
The multi-disease classification of plant leaves using traditional methods is time-consuming and needs more resources. The features of the numerous techniques for enhanced prediction of plant-leaves disease are reviewed below. This model enhances classification accuracy. It is used in real-world benefits by minimizing the number of network constraints. This technique attains high accuracy even for large data sets and more types of diseases. It provides remedies for the classified disease. This method gives high accuracy even for lower-resolution images. This model has improved recognition and training efficiency. This technique has effectively generated sufficient leaf images with prominent lesions. This model recognizes plant diseases well as well as monitors the growth of plants for future use. It provides great computational efficiency for identification and classification. This model can be implemented in resource-constrained devices like smartphones. The challenges for the various existing multi-disease classification of plant leaves are given below. This model is harder to train for very larger image datasets. It suffers from complexity to train the neural network since this model requires large datasets for training. This model has slowed down when processing max-pool-like operations. This model is not suitable for rapid plant disease identification using smartphones. This model has overfitting problems while using a large number of datasets. The accuracy rate downs slightly when it deals with high-resolution images. This model causes deviations in the result in the case of slight and moderate disease due to a negligible gap. This model is not improved to detect bacterial or viral diseases in plant leaves. It requires more trainable parameters for large-size images. The research based on optimal weighted features for existing and proposed work is described given below. The optimization of the weight function is done in such a way that the precision and recall should be maximized after image retrieval. (Darapureddy et al. Citation2021). The Radiomics-based strategies, the histogram, and Gray-Level Co-Occurrence Matrix (GLCM)-based radionics features were extracted from cancerous (Zhang et al. Citation2017). The T1-weighted images extract the local features of each brain tissue. This pre-processing is done using Statistical Parametric Mapping (SPM) and Voxel-Based Morphometry (VBM) (Kondo et al. Citation2015). In the proposed work, the deep features are acquired using the pooling layer of the CNN technique by optimizing the hidden neurons of CNN using a new heuristic algorithm for maximizing the performance.
The major contribution of the multi-disease classification of plant leaves is represented as follows:
To employ the classification of multiple diseases of different types of plant leaves like strawberry, grape, apple, peach, cherry, pepper, potato, citrus, and tomato leaves by adopting enhanced abnormality segmentation, deep feature extraction, and enhanced classification model with the purpose of hybridized optimization-based algorithm.
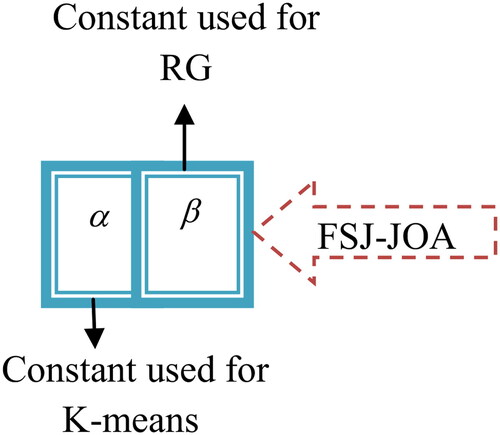
To implement the leaf segmentation using binary thresholding and abnormality segmentation process by AFKMRG technique using FSJ-FOA algorithm. The abnormality-segmented image is produced by combining the outcomes of both K-means and RG after being multiplied with fusion weights that are optimized by the FSJ-FOA algorithm. It increases the quality of segmented images.
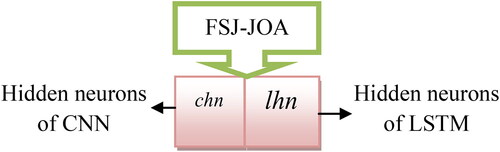
To develop a novel FSJ-FOA model for improving the quality of segmented images by optimizing the fusion constants in segmentation and to improve the efficiency of classification by optimizing the hidden neurons of CNN with the aim of significant feature extraction from the pooling layer and by optimizing the hidden neurons of LSTM for classifying the multi-disease in plant leaves.
To evaluate the effectiveness of the recommended multi-disease classification of plant leaves model on trained datasets using different performance measures through comparing with conventional classifiers and meta-heuristic algorithms.
2. Literature review
2.1. Related works
(Dai et al. Citation2020) have developed a Generative Adversarial Network with Dual-Attention and Topology-Fusion mechanisms termed DATFGAN. This network was used to attain clear and high-resolution images from unclear images. Moreover, the count of parameters was reduced using the weight-sharing scheme. The proposed network has attained better results. The performance evaluation on the proposed network has provided robust performance for real-world applications.
(Sharma et al. Citation2020) have proposed a new approach with artificial intelligence for the detection and classification of leaf diseases in an automatic manner. This approach was used for easy and quick detection of disease and then it performed efficient classification, thereby observing the essential remedies for curing that plant diseases (Sreedevi and Manike Citation2022). The primary goal of this approach was to improve the yield of crops. In this approach, various steps like image collection, pre-processing, segmentation, and classification were done based on several machine learning techniques. The experimental analysis of this approach has shown improved detection and classification performance.
(Atila et al. Citation2021) have developed an architecture based on deep learning called EfficientNet for the classification of disease leaves. The transfer learning approach was utilized to learn the proposed method and other deep-structured architectures. The experimental results have shown that EfficientNet architecture has attained better values than the original and augmented datasets of other deep learning models owing to accuracy and precision.
(Zhang et al. Citation2018) have developed two improved deep learning-based models such as improved GoogLeNet and Cifar10 models for highly accurate maize leaf disease detection. The experimental results have shown that the improved models have attained better efficiency than the VGG and AlexNet structures in terms of accuracy, and it has also provided a fast convergence rate.
(Liu et al. Citation2020) have developed a new approach based on GANs named LeafGAN to generate four dissimilar grape leaf disease images for training the detection models. The proposed model has provided a suitable solution for augmentation with data of images and generated adequate leaf images. This data augmentation method has solved the overfitting problems and enhanced the accuracy of the proposed disease detection model.
(Chen et al. Citation2020) have proposed a new approach based on image processing techniques for the automatic detection and classification of plant leaf diseases. The segmentation process was performed by the grey variance method to spot the diseased regions without any background images. The features such as texture, color, area, and pixels from the diseased part were extracted as feature indicators. Finally, the classification performance was done. The offered method gives better outcomes. The results of the comparison have revealed that the novel method was effective in terms of detecting the diseased plant.
(Chohan et al. Citation2018) have introduced a method namely Bacterial foraging optimization based Radial Basis Function Neural Network (BRBFNN). The feature extraction step was employed by the region-growing algorithm to improve the development of the proposed network. The experimental results of the proposed method have attained higher identification and classification accuracy.
(Pham et al. Citation2020) have proposed a wrapper-based feature selection approach using an adaptive particle-grey wolf hybrid meta-heuristic algorithm. At first, the pre-processing method was employed and the feature extraction process was done by a wrapper-based algorithm. The selected features were fed into Artificial Neural Network (ANN) for the effective process of detection. The classification approach of the proposed model was compared with other approaches like CNN models and the results have shown that the ANN was better than the CNN in terms of classification accuracy.
(Islam et al. Citation2020) have presented an online machine-learning aid for detecting papaya disease. Here, images were gathered via a mobile app and transferred into the system for disease detection. (Islam et al. Citation2021) have worked on 4 kinds of diseases and one healthy leaf class of the paddy. In the end, it has been revealed that the suggested method achieves a higher accuracy rate. (Hossen et al. Citation2020) have employed the improved deep structured method to detect and categorize papaya disease. It was reliable with fully connected, where categorization was completed with the help of deeply structured architecture.
Krishnamoorthi and Vijayaganth (Citation2022) have developed a new ensemble learning method with the combination of soft computing and deep structured architectures for the multi-disease classification of plant leaves. In this work, the suggested structure of ensemble learning approaches has been customized for optimizing the constraints of classifiers for attaining accurately categorized outcomes. In the end, the simulation findings have demonstrated that the offered method attains high accuracy with diverse efficiency metrics.
(Tiwari et al. Citation2022) has implemented automated and more efficient plant disease detection approaches for diagnosing early symptoms to avoid economic loss. The categorization and detection of plant diseases from leaf images have been done with the help of a deep-learning-based technique. In the end, the experimental results have revealed the efficient performance of the offered method.
Hyeon et al. (Citation2022) have introduced an enhanced deep learning-based multi-plant disease recognition method that integrates deep features acquired by deep convolutional neural networks and k-nearest neighbors to get the disease images with the help of query images. The fine-tuning approach was utilized to leverage the deep features. The experimentation has been done for achieving a better accuracy rate.
2.2. Problem formulation
The multi-disease classification of plant leaves with the help of traditional methods is time-consuming and needs more resources. Therefore, various approaches for enhanced prediction of plant-leaves disease are reviewed in .
Table 1. Features and challenges of multi-disease classification of plant leaves.
3. Proposed method for multi-disease classification of plant leaves: meta-heuristic improvement
3.1. Designed architecture
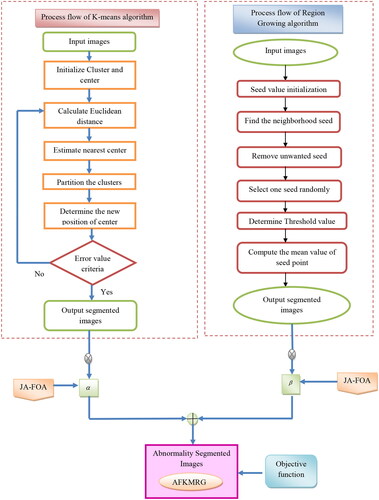
The schematic representation of the recommended scheme is shown in . The proposed multi-disease classification of the plant leaves model consists of three major phases 1. Pre-processing, 2(a). Leaf segmentation, 2(b) Abnormality segmentation, and 3. Classification. The acquired images of plant leaves from the different datasets are fed to the pre-processing phase to suppress the undesired distortions and enhance the relevant features of the image for further processing of classification and segmentation. The pre-processing of images is executed by using scaling and threshold development approaches. The pre-processed images are further subjected to leaf segmentation, thereby providing a simpler analysis with the proper region of interest.
The leaf segmentation process (Shanthakumari et al. Citation2022; Yeong et al. Citation2022) is performed by the binary thresholding method and the abnormality segmentation phase is carried out by a combined method namely AFKMRG, which consists of K-means and the Region growing method. The outputs produced from both methods are multiplied with the fusion constants separately, which are attained by FSJ-FOA. The enhanced AFKMRG-based abnormality segmented images are then forwarded to the classification stage, which is done by CNN-based feature extraction and enhanced LSTM classifier. The feature extraction process using CNN is improved by optimizing the hidden neurons through FSJ-FOA.
Figure 1. Presentation of an offered multi-disease classification method for plant leaves.
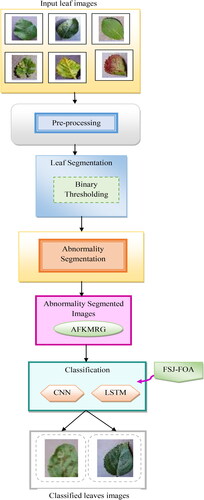
The CNN-based acquired features are taken as input to the LSTM classifier, in which the number of suitably hidden neurons is tuned by FSJ-FOA. The classified outputs from the enhanced LSTM classification are attained from different types of leaf diseases. Here, the enhanced detection (Ramesh et al. Citation2018) is performed by optimizing the hidden neurons of both CNN and LSTM using FSJ-FOA by solving the objective function with maximization of accuracy. Therefore, the process of classification, segmentation, and feature extraction is enhanced by a hybrid optimization algorithm called FSJ-FOA.
3.2. Dataset description
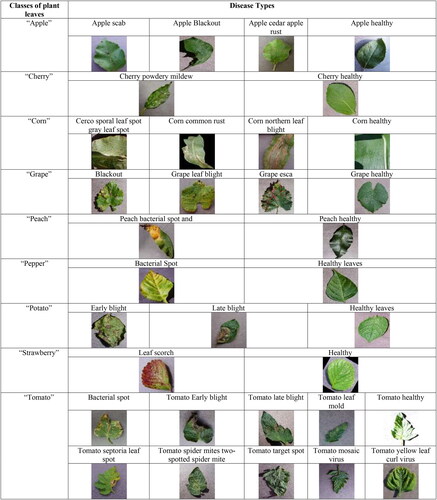
The analysis of multi-disease detection of plant leaves is performed by using various leaf images gathered from two diverse datasets like Mendeley and Kaggle. The Kaggle dataset contains the plant leaves like strawberry, grape, tomato, cherry, potato, peach, pepper, corn, and apple. The Mendeley dataset contains citrus plant leaves.
3.2.1. Dataset 1
It is collected from the link, ‘https://www.kaggle.com/vipoooool/new-plant-diseases-dataset’. The Kaggle dataset contains 38 various classes of disease-affected and unaffected leaves. The average of images comprises 87K RGB. The whole dataset is split into validation and training datasets in the proportion of 20 and 80, respectively. Additionally, the detection process uses a new directory, which contains 33 test images.
The sample images of plant leaves collected from the Kaggle dataset are represented in .
Figure 2. Sample images are taken from dataset 1 with categories of different leaf diseases.
3.2.1. Dataset 2
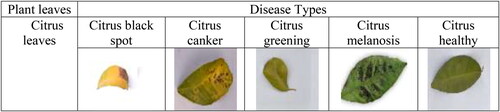
The Mendeley dataset composes a set of images of healthy and unhealthy citrus leaves, which has 609 numbers of total images. To prevent the plants from disease, his dataset may be used for future research.
Finally, citrus (Iqbal et al. Citation2018) consists of classes like citrus black spot, citrus canker, citrus greening, citrus melanosis, and citrus healthy. The sample images of plant leaves gathered from the Mendeley dataset are represented in .
Figure 3. Sample images are taken from dataset 2 for citrus leaves.
The input images of plant leaves are collected from the different datasets presented as where
and
refer to the average count of leaf images. The statistics of the whole dataset are given in .
Table 2. The statistics of the whole dataset for the suggested method.
3.3. Meta-heuristic FSJ-FOA
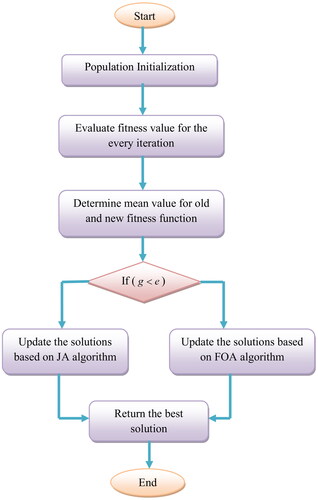
The classification performance of the multi-disease plant leaves detection model is enhanced by developing the hybrid algorithm namely FSJ-FOA, which is a combination of FOA and JA optimization algorithms. The FOA algorithm is generally used to resolve non-linear optimization issues and the JA algorithm solves constrained and unconstrained problems. Therefore, both algorithms are combined and used in the proposed model. Since the FOA algorithm works on the tree-based mechanism, it takes more computational time for network training which degrades the classification efficiency of the offered method. Therefore, the JA algorithm is merged with the FOA algorithm to resolve the existing issues of the FOA algorithm. Hence, the proposed FSJ-FOA algorithm enhances the performance of the offered scheme.
The developed FSJ-FOA algorithm finds the best solution for improving the development of the recommended scheme. This algorithm works according to the fitness values of old and newly updated solutions. Then, the mean value is calculated for the fitness function of the previous solution and the recently updated solution. Consider, is the average of the fitness function of the prior solution (old fitness function) and
the average of the fitness function of the updated solution (new fitness function). It
is attained, then the JA algorithm is considered, or else the FOA algorithm is taken into consideration for upgrading the solutions. Thus, the fitness function of both algorithms is sorted to determine the best solution.
JA algorithm (Ramesh and Vydeki Citation2020): The main objective of this algorithm is finding the best solution and avoiding the worst solution by moving the obtained solutions for the given problem towards the best solution. This process is defined by the following equation.
The fitness function to be decreased or increased is considered as Consider for any iteration
there are
several design variables, were
and
several candidate solutions that are the population size, where
In the whole solution, the best search agent
achieves the accurate value of
that is
and the worst solution
achieves the worst value of
that is
It
is the value of the term
for the
solution during the iteration
then the equation is customized as EquationEquation (1)
(1)
(1) .
(1)
(1)
The term for the best solution is denoted by
the ‘two arbitrary numbers for the
constraint during the
iteration are indicated by
and
’, and the value of the term
for the worst solution is denoted by
The value
is updated as
and which lies in the limit [0,1]. The objective of the solution to move closer to the accurate solution is represented by
and the worst solution to be avoided is indicated by
If it provides a better function value, then
is accepted. The accepted function values of the previous iterations are given as input to the next iteration.
FOA algorithm (Naz et al. Citation2019): The FOA algorithm works mainly based on the concept of the seeding procedure of trees. The population of trees is initialized and the values of the variable are denoted in addition to the age of the tree. At first, the age of a tree is considered as 0. Consider a dimensional problem in which each tree is assumed as a
dimensional vector
where
A parameter value is assigned for choosing the candidate population trees. The trees which are reached the parameters are added to the candidate population for a better process of local search. Once, the initialization process is completed, the new young trees or seeds are generated by the local seeding operator from the trees, which have an age of 0. When new trees are added to the forest and all the ages of trees are raised by ‘1 except the new ones. In the local seeding step, a parameter called Local Seeding Changes (LSC) refers to the new ones, which become the neighbor trees. The local seeding operator value is decreased at the next iterations since the age of the trees is increased by 1 and the non-zero-aged trees are not considered in the local seeding stage. The operation of local seeding is performed by selecting a random variable. A small random value
and this step are repeated for each zero-aged tree for LSC times. The global seeding operation is performed based on the randomly selected variables of each tree. Then, the value of a chosen variable is interchanged with another value of an arbitrarily created variable. Therefore, a global search is performed by this operator in the whole search space. Next, the process of updating the best tree is performed by categorizing the trees corresponding to their fitness value. The best tree is selected based on the better fitness value of the related tree. The age of the better tree age updated to 0 to ignore the aging process in the local seeding stage. Finally, the stop conditions of the algorithm are checked and the best tree is returned.
The pseudo-code of the proposed FSJ-FOA is shown in Algorithm 1.
Algorithm 1:
Designed FSJ-FOA
Population Initialization
Calculate the fitness function for every iteration
Determine and
if
Solution update with JA algorithm using EquationEquation (1)(1)
(1)
else
Solution update with FOA algorithm
Determine Local seeding
Determine Global seeding
end
Return the best solution
End
Therefore, the developed FSJ-FOA optimization algorithm enhances the development of the offered method by updating the best solutions according to the sorted value of old and new fitness functions. The flow diagram of the offered FSJ-FOA algorithm is given in .
Figure 4. Flow chart of the proposed FSJ-FOA algorithm.
4. Processing steps for developed multi-disease classification of plant leaves
4.1. Pre-processing of leaf images
The process of automated detection of plant leaves diseases with the help of a hybridized classifier is initially started with the pre-processing stage. This technique is employed to enlarge the quantity of the image by eliminating the distortions present in the images. The resolution-enhanced images are used further in the efficient process of segmentation and classification. In this paper, image scaling and contrast enhancement approaches are used to perform the pre-processing step.
Image scaling (Roomi and Maragatham Citation2015): This process is also known as image resizing. It is mainly used for adjusting the pixels. The size of an image increases or decreases based on pixel adjustments. In image processing, the modification of digital objects is called scaling. This scaling approach is utilized for making the images look better using geometric variations, without losing the rate of the image. The input image after the scaling process is referred to as
Contrast Enhancement (Roomi and Maragatham Citation2015): This technique is applied for improving the fidelity and contrast of input images by reducing the distortions in them. The two steps included in the contrast enhancement technique are histogram equalization and image intensity adjustment. These phases also offer detailed content regarding the image. That is, the contrasts between the intensity values are increased to make the considered content of the leaves visible.
(2)
(2)
The variable denotes the cumulative frequency of the gray level, the intensity of the present pixel is denoted as
the term
refers to the number of intensities, the minimum value of CDF is represented by
and the product of several pixels in rows and columns is correspondingly indicated by
&
The contrast-enhanced images using the histogram equalization are represented as
4.2. Binary thresholding-based leaf segmentation
After the pre-processing, the pre-processed images are fed to the segmentation stage. Image segmentation is a procedure of segmenting images into several image objects or segments. In this paper, the binary threshold method is applied for segmenting the leaf regions. This threshold method converts the grayscale images into binary images to separate the objects. This method is also used to split the image into foreground and background images. The pixel intensity of the original image has a threshold value, based on which a bitonal image is generated. This process is termed thresholding and it is equated in EquationEquation (3)(3)
(3) .
(3)
(3)
Here, the term indicates the image intensity of the divided image and the term
denotes the threshold value. Therefore the segmented images using the binary thresholding approach are called as
4.3. Proposed AFKMRG-based abnormality segmentation
In the abnormality segmentation phase, an adaptive fusion technique is introduced to segment the defects or abnormalities present in the plant leaves. In this paper, the K-means clustering and Region Growing (RG) algorithm is used for abnormality segmentation. Clustering is based on the concept of partitioning an image or data into a set of objects. The integration of K-means clustering and RG algorithms is utilized for segmenting the abnormalities of the plant leaves. The segmented images are given as input to the abnormality segmentation phase. The outcomes from both K-means clustering and RG models are multiplied by optimal constants produced using the FSJ-FOA algorithm. After optimizing the parameters, the resultant images obtained from both models are fused to attain the abnormality segmented images.
K-means clustering (Isa et al. Citation2009): K-means clustering separates the input image into the k-number of objects. The Euclidean method is utilized to describe the nearest centroid distance. A new centroid is recalculated from each cluster depending on the related centroid after the grouping process. As a result, Euclidean distance is measured in every data center. Additionally, the cluster has assigned some points depending on the lowest Euclidean distance. Assume an input image with the decision of
and then
is the input pixels to the cluster and
denotes the cluster centers, in which the images are partitioned into
several clusters. The K-means algorithm works based on the following steps:
Initialize the count of clusters and centers.
The Euclidean distance
calculation is given in EquationEquation (4)
The Euclidean distance has assigned the pixels to the nearest center.
The new position of the center is calculated in EquationEquation (5)
This process is replicated until the error or tolerance value is attained.
The pixel of a cluster is then reshaped into an image.
This simpler implementation of K-means clustering makes the process an effective one. However, the more count of iterative and clusters of the K-means algorithm makes some difficulties and may attain less segmentation performance. The output produced using the K-means clustering algorithm is termed as
RG (Borges et al. Citation2018): This algorithm uses seed pixels for segmenting the image into salient image regions. The seed pixels are added with new homogeneous pixels in a repeated manner until the segmentation criterion is satisfied. The segmentation process of an entire image area into sub-regions requires the following conditions:
For
For any
Here, the entire image area is denoted by and it is split into
sub-regions. The gray value of the set is denoted by
and
denotes the average of the pixels of an image. When the pixel value contains the following requirements, the seed point is selected initially and a pixel is added in each step of the algorithm. This process is denoted in EquationEquation (6)
(6)
(6)
(6)
(6)
(7)
(7)
Here, the mean of the image is denoted by the value at the correlate axis
is represented by
and the threshold value is indicated by
The threshold value is close to the mean of the image. Therefore, the output produced from the RG algorithm is termed as
The AFKMRG fusion model is adopted for segmenting the abnormalities of the image. This method is an integration of K-means and RG algorithms. The segmented images are further processed through the abnormality segmentation step and the output produced by K-means and RG is termed as
and
An optimal constant is multiplied with each output by the FSJ-FOA algorithm. The resultant image obtained by the AFKMRG fusion model produces
segmented regions. This abnormality segmentation process is formulated in EquationEquation (8)
(8)
(8) .
(8)
(8)
Here, the term
denotes the constants selected optimally by the FSJ-FOA algorithm. After the abnormality segmentation process, the results obtained are represented as
where
and
denoted by the number of segmented images. The abnormality segmentation process by AFKMRG fused model is depicted in .
Figure 5. Abnormality segmentation using the AFKMRG fusion model.
The accurate solution is attained by computing the fitness value for the individual solutions. The best solution is termed according to the solution that has a minimum fitness value. The fitness function of the FSJ-FOA for deriving the abnormality segmentation constants is represented as shown in EquationEquation (9)(9)
(9) .
(9)
(9)
Here, the size of the input image is indicated by and the center of the image segment
is indicated by
and
denotes the
pixel that belongs to the
segment.
Assume the image with the number of pixels from the
segment and each pixel is represented as
The center for the segmented image is computed as given in EquationEquation (10)
(10)
(10) .
(10)
(10)
The use of optical constants by the FSJ-FOA algorithm enhances the process of abnormality segmentation. The enhanced segmented images are used to improve the further classification performance. The solution encoding diagram for optimal constants is depicted in .
Figure 6. Solution encoding for optimal constants in segmentation.
5. Multi-disease classification of plant leaves using optimal deep features with LSTM
5.1. Optimized CNN-aided deep features extraction
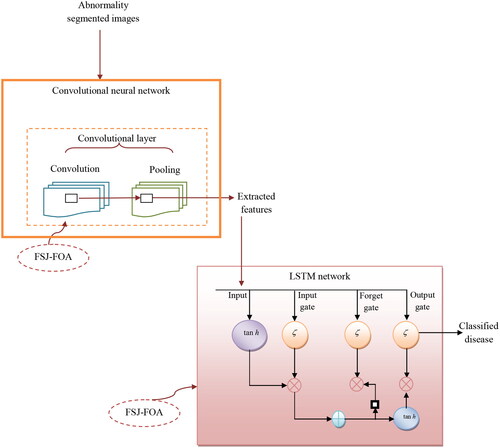
In the offered method, the classification of multi-diseases of plant leaves is done by two methods as CNN and Enhanced LSTM method. The categorization enlargement of the recommended scheme is enhanced by selecting the optimal features from the segmented images using the CNN technique. Here, the segmented images from the abnormality segmentation phase are forwarded to the CNN in the classification stage to attain the optimal features. The number of suitably hidden neurons in CNN is developed by the FSJ-FOA algorithm to enhance the efficiency of the feature extraction process.
CNN (Rawat and Wang Citation2017): Generally, the CNN architecture consists of several layers. In the proposed scheme, the deep features are acquired from convolutional and pooling layers. The description of each layer is represented as follows:
5.1.1. Convolution layer
The input segmented images are subjected to the convolutional layer to acquire the deep features. Each field is associated with the neuron of the previous layer. The extraction process of the feature map is formulated in EquationEquation (11)
(11)
(11) .
(11)
(11)
The variable denotes the output abnormality segmented image, the term
is the
resultant feature map in the convolution layer. The interior attributes of the input image at every position are calculated using the two-dimensional operator and it is denoted by the symbol
and the non-linear activation function is called as
. This function is applied for extracting the non-linear features.
5.1.2. Pooling layer
The higher rate value is transmitted by most pooling layers. The respective value is propagated to the next later inside a receptive field, in which this layer selects the higher element. This process is formulated in EquationEquation (12)(12)
(12) .
(12)
(12)
In the aforementioned equation, the variable denotes the outcome of the pooling process with the
feature map. In the element
the location is denoted by
which is enclosed by the polling area
Thus, the deep features acquired using the pooling layer of the CNN technique are indicated as where
and
indicates the average of extracted deep features. The feature extraction performance of CNN is then improved by tuning the hidden neurons using FSJ-FOA, which lies in the range of 5 to 255. The extracted features are further processed through the classification phase, which is done by enhanced LSTM.
5.2. Enhanced LSTM-based classification
The final phase of the proposed multi-disease classification of plant leaves model is the classification phase (Manne et al. Citation2020). This phase is used to sort out the different diseases of plant leaves. The deep features acquired by the CNN technique are given as input for the LSTM classification. LSTM network is a specific form of RNN network and the past data can be stored in the memory unit using LSTM. LSTM is also used to reduce the exploding and gradient vanishing problems of RNN. In many recent prediction models, LSTM has been showing effective performance in time series data prediction.
LSTM (Akilan et al. Citation2020): A LSTM network generally contains four components cell, an input gate, forget gate, and an output gate. The cell in the LSTM transfers the information at randomly chosen time intervals. The input and output data flow is traced by the gates. The computation of nodal outputs of an LSTM network is shown in the following equations:
(13)
(13)
(14)
(14)
Here, the term denotes the input variable at a time
The weight matrices are indicated by
The input gates are represented by
The symbol
represents the sigmoid activation function and the hidden calculation for state outputs at a time
is denoted by
The biased values of different gates are represented by
5.3. Objective function
The proposed multi-disease plant leaves detection model is performed using optimized CNN and enhanced LSTM by adopting FSJ-FOA. The fitness function is calculated for the improved classification model as shown in EquationEquation (19)(19)
(19) .
(19)
(19)
The CNN feature extraction and LSTM classification model are outlined to deliver high-precision forecasting. The classification efficiency of both models is improved by resolving the fitness function with accuracy. The performance of the CNN-based optimal features with LSTM classification is further improved by tuning the suitably hidden neurons of both CNN and LSTM
networks using the FSJ-FOA algorithm, which is in the range of 5 to 255. This optimization enhances the classification effectiveness of the designed model concerning with maximization of accuracy. The solution encoding for the offered classification method is shown in .
Figure 7. Optimization of constraints in the proposed classification model.
Accuracy: The proportion of the study exactly measured to the entire observations. This is formulated in EquationEquation (20)(20)
(20) .
(20)
(20)
The true positives, false negatives, false positives, true negatives and are called as
and. Thus, the CNN-based optimal features with enhanced LSTM classification provide multi-disease classified plant leaves with high accuracy. The classification method is expressed in .
Figure 8. Proposed CNN-based feature extraction and enhanced LSTM-aided classification method.
6. Calculation of results
6.1. Experimental Evaluation
The offered FSJ-FOA-CNN-LSTM-based multi-disease classification of plant leaves was implemented in Python. Evaluation of the designed system was executed by comparing it to the existing systems with performance metrics. The performance analysis was executed for the proposed FSJ-FOA algorithm by comparing various optimization algorithms such as Grey Wolf Optimization GWO (Sreedharan et al. Citation2018), Deer Hunting Optimization Algorithm (DHOA) (Brammya et al. Citation2019), FOA (Naz et al. Citation2019) and JA (Ramesh and Vydeki Citation2020), and CNN based enhanced LSTM classifier by various machine learning algorithms like CNN (Rawat and Wang Citation2017), Support Vector Machine (SVM) (Martens et al. Citation2009), Neural Networks (NN) (Wu et al. Citation2016), LSTM (Akilan et al. Citation2020) and CNN-LSTM (Nagda and Poovammal Citation2018).
6.2. Efficiency metrics
The performance metrics used for the designed method are elaborated here.
F1 score:
MCC:
FPR:
NPV:
FNR:
FDR:
Precision:
Specificity:
Sensitivity:
6.3. Time complexity
The big oh notation of the existing and proposed algorithms is given here. For GWO DHOA
FOA
and JA
F the proposed model is FSJ-JOA:
Here, iteration
several candidate solutions that are the population size,
channel length, and the transfer rate is termed as
= 15.
6.4. Experimental results
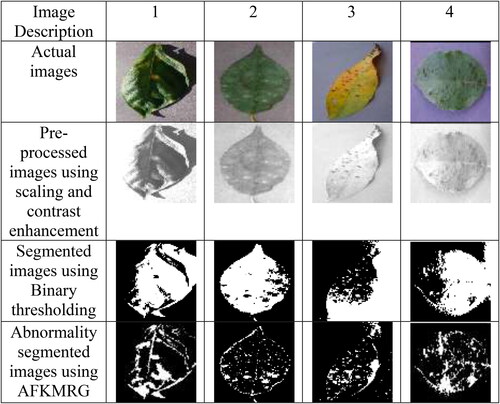
Some of the original, pre-processed, segmented, and abnormality-segmented images are shown in .
Figure 9. Experimental results of proposed FSJ-FOA-CNN-LSTM-based multi-disease classification of plant leave with original, pre-processed, segmented, and abnormality segmented images for diverse types of plant.
6.5. Analysis of accuracy over meta-heuristic algorithms
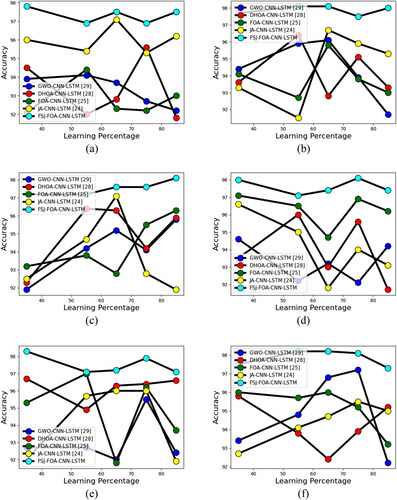
The FSJ-FOA algorithm of the offered multi-leaves disease classification model is compared by varying the learning percentages regarding accuracy as shown in . While considering the accuracy of apple plant leaves for the learning percentage of 55, the FSJ-FOA-CNN-LSTM performed 2.88% better than GWO-CNN-LSTM, 5.01% better than DHOA-CNN-LSTM, 2.12% better than FOA-CNN-LSTM, and 1.58% better than JA-CNN-LSTM. Similarly, for all kinds of plant leaves the proposed FSJ-FOA algorithm provides better accuracy than the other existing optimization algorithms. In certain cases, JA and FOA algorithms are also trying to attain the same performance as the proposed algorithm. For example, during the analysis of peach leaves, the FOA algorithm reaches the same level as the proposed model for the learning percentage 55. Likewise, while analyzing the citrus leaves, the JA reaches an equal level to the proposed model corresponding with a learning percentage of 55. Therefore, the offered model has used the combination of FOA and JOA algorithm namely FSJ-FOA for achieving the superior performance of classification.
Figure 10. Validation of the proposed FSJ-FOA-CNN-LSTM-based multi-disease classification of plants model on ‘metaheuristic algorithms in terms of accuracy’ for diverse types of leaves like ‘(a) apple, (b) cherry, (c) corn, (d) grape, (e) peach, (f)pepper, (g) potato, (h) strawberry, (i) tomato and (j) citrus’.
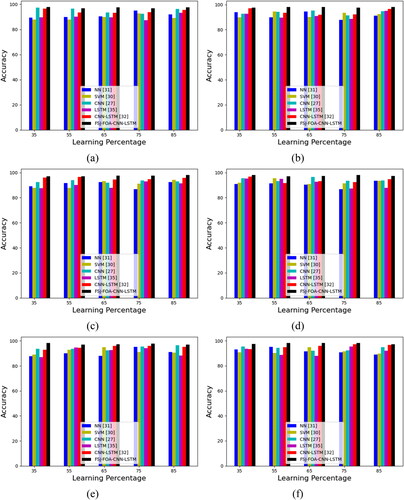
6.6. Accuracy analysis of the proposed classifiers
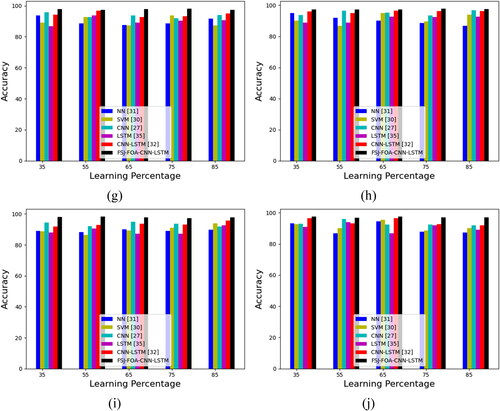
The enhanced CNN-LSTM classification model using the FSJ-FOA algorithm for multi-leaves disease classification is compared with other existing classifiers regarding accuracy and learning percentages as given in . While considering the F1-score of corn plant leaves for the learning percentage of 65, the FSJ-FOA-CNN-LSTM performed 11.76%, 10.46%, 13.09%, 15.85%, and 5.55% more advanced performance than NN, SVM, CNN, LSTM, CNN-LSTM. Likewise, for all kinds of plant leaves the FSJ-FOA-CNN-LSTM classification method gives maximum accuracy. In an overview, the proposed FSJ-FOA-CNN-LSTM attains maximum performance in evaluating all the performance measures for all types of plant leaves with various learning percentages. Therefore, the enhanced CNN-based LSTM classification using FSJ-FOA provides a better classification of multi-diseased plant leaves.
Figure 11. Evaluation of the proposed FSJ-FOA-CNN-LSTM-based multi-disease classification of plant leaves model on existing deep structured architectures regarding accuracy for different types of leaves like ‘(a) apple, (b) cherry, (C) corn, (d) grape, (e) peach, (f)pepper, (g) potato, (h) strawberry, (i) tomato and (j) citrus’.
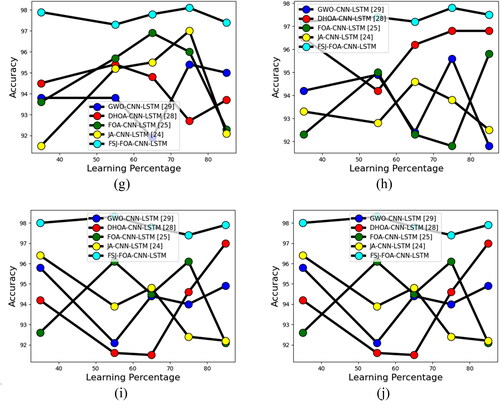
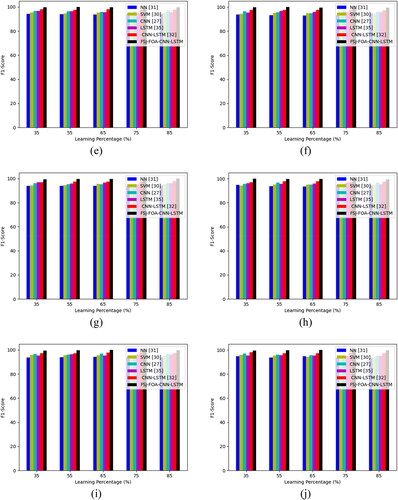
6.7. F1-score evaluation of the offered scheme on optimization algorithms
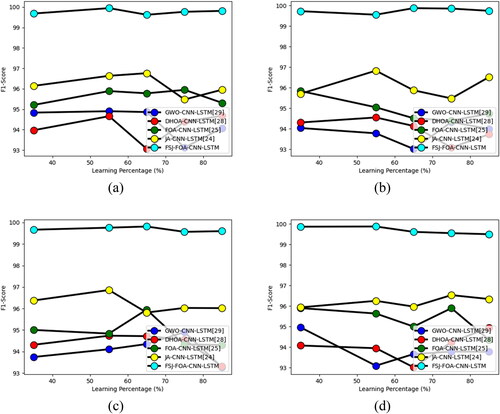
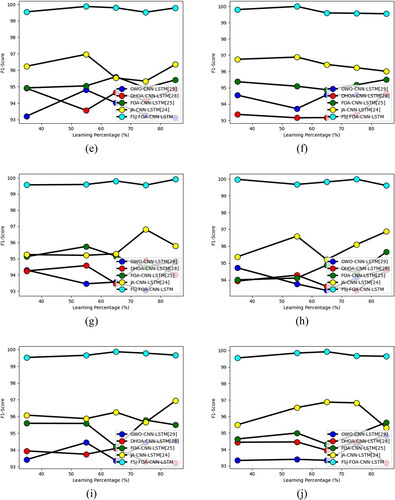
Validation of the F1-score of the offered FSJ-FOA-CNN-LSTM-based multi-disease classification of plant leaves model using the FSJ-FOA algorithm is ‘compared with other meta-heuristic algorithms in terms of F1-score and learning percentages’ as shown in . The F1-score of the offered FSJ-FOA algorithm for cherry plant leaves is 1.02%, 0.71%, 0.50%, and 0.71% enriched performance than GWO-CNN-LSTM, DHOA-CNN-LSTM, FOA-CNN-LSTM, JA-CNN-LSTM while considering 65 as a learning percentage. Similarly, for the plant leaves, the proposed algorithm achieves enhanced performance in F1-score by varying the learning percentages. All the other algorithms are also competing to reach the high value of the F1 score in certain cases. For example, in the analysis of peach leaves for the learning percentage of 75, all the other meta-heuristic algorithms are tried to reach the value of 98. But the proposed FSJ-FOA model reaches the maximum value of the F1-score as 99. Therefore, the proposed classification using the FSJ-FOA algorithm provides superior performance to all the existing meta-heuristic algorithms.
Figure 12. Calculation of the proposed FSJ-FOA-CNN-LSTM-based multi-disease classification of plant leaves on ‘metaheuristic algorithms in terms of’ F1-score for diverse types of leaves like ‘(a) apple, (b) cherry, (C) corn, (d) grape, (e) peach, (f) pepper, (g) potato, (h) strawberry, (i) tomato and (j) citrus’.
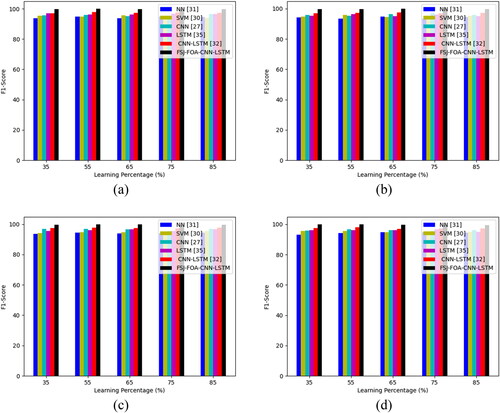
6.8. Estimation of F1-score with classifiers
The suggested FSJ-FOA-CNN-LSTM classification method is validated regarding F1-score by testing with other classifiers as shown in . While taking the analysis of pepper leaves, the F1-score of the offered FSJ-FOA-CNN-LSTM-based classification model is 3.15%, 5.37%, 2.08%, 3.15%, 1.03% more advanced performance than the NN, SVM, CNN, LSTM, CNN-LSTM. Likewise, the proposed FSJ-FOA-CNN-LSTM classification model attains better performance.
Figure 13. Evaluation of the proposed FSJ-FOA-CNN-LSTM-based multi-disease classification of plant leaves models on existing classifiers regarding F1-score for different types of leaves like ‘(a)apple, (b)cherry, (C) corn, (d) grape, (e) peach, (f)pepper, (g) potato, (h) strawberry, (i) tomato and (j)citrus’.
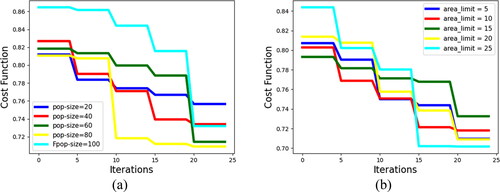
6.9. Parameters of sensitive analysis
The sensitive analysis of parameters considered as population size and area limit for the proposed FSJ-FOA-CNN-LSTM-based multi-disease classification model of plant leaves is shown in . The cost function analysis is performed by differing the number of iterations to reveal the lower cost function attained from the FSJ-FOA-CNN-LSTM model. From , while varying the iterations, when the population size is 100, the cost function of the value starts from 0.92 and gradually decreased to 0.65. Accordingly, From , when the area limit is 25, the cost function of the value starts from 0.88 and is gradually reduced to 0.70.
Figure 14. Sensitive analysis on the parameters considered as (a) Population size and (b) Area-limit of the proposed model.
6.10. Empirical analysis of offered method
The empirical analysis of the proposed FSJ-FOA-CNN-LSTM-based multi-disease classification of plant leaves model on optimization algorithms and classifiers for different types of plant leaves is shown in and . From , the average of the FSJ-FOA-CNN-LSTM model is secured at 4.11%, 4.08%, 4.64%, and 1.35% progressed than the GWO-CNN-LSTM, DHOA-CNN-LSTM, FOA-CNN-LSTM, and JA-CNN-LSTM respectively for apple leaves. Similarly, the standard deviation of the FSJ-FOA-CNN-LSTM model is attained at 85.20%, 87.59%, 58.75%, 98.38%, and 59.75% enhanced than the GWO-CNN-LSTM, DHOA-CNN-LSTM, FOA-CNN-LSTM, and JA-CNN-LSTM respectively for apple leaves. Hence, it is proved that the suggested FSJ-FOA-CNN-LSTM method achieved better results.
Table 3. Calculation of the offered scheme on optimization algorithms for different types of plant leaves.
Table 4. Examination of the proposed multi-disease classification of plant leaves model on classifiers for different types of plant leaves.
6.11. Runtime analysis
The running time analysis of the offered method for various types of plant leaves is given in . From , when considering the peach leaves, holds minimum time when compared with the other different types of leaves. In the same manner, when considering the Tomato leaves it can obtain maximum time. Thus, this analysis shows the runtime taken by each plant.
Table 5. Calculation of running time for the offered scheme for different types of plant leaves.
6.12. Total images of both datasets
The total image of both datasets for the offered scheme is given in .
Table 6. Total image images of both datasets for the designed model.
6.13. Examination of confusion matrix
Evaluation of the confusion matrix for the offered model with the baseline approaches is given in and . The graph result for the confusion matrix on the designed method is shown in .
Figure 15. Graph result for confusion matrix on the suggested plant leaves classification with multiple diseases model.
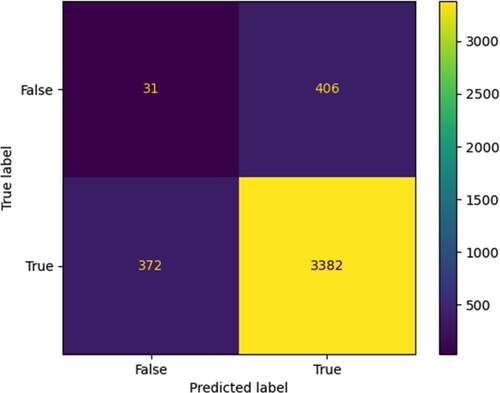
Table 7. Evaluation of confusion matrix with conventional optimization algorithms for the offered method.
Table 8. Estimation of confusion matrix with conventional classifiers for the designed method.
6.14. Estimation of the offered method
Examination of the offered FSJ-FOA-CNN-LSTM-based multi-disease classification model of plant leaves model given in and . In , the specificity of the designed FSJ-FOA-CNN-LSTM for grape leaves is correspondingly secured at 5.87%, 2.33%, 3.22%, and 3.99% more advanced performance than GWO-CNN-LSTM, DHOA-CNN-LSTM, FOA-CNN-LSTM, JA-CNN-LSTM. Accordingly, from the FPR of the developed FSJ-FOA algorithm is correspondingly secured at 45.34%, 23.56%, 31.77%, 38.55%, and 26.41% enriched performance than the NN, SVM, CNN, LSTM, and CNN-LSTM. Hence, the given validation reveals that the suggested FSJ-FOA-CNN-LSTM classification method offers a better classification of plant leaves affected by multiple diseases.
Table 9. Examination of the offered FSJ-FOA-CNN-LSTM-based multi-disease classification method of plant leaves model.
Table 10. Validation of the offered FSJ-FOA-CNN-LSTM-based multi-disease classification method of plant leaves model with classifiers.
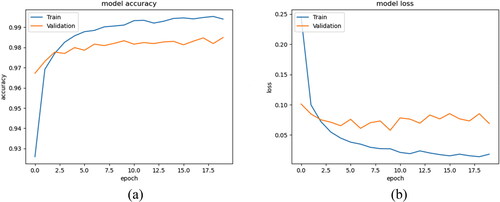
6.15. Training accuracy graph of the offered scheme
The training accuracy graph of the suggested plant leaves classification with multiple disease representation is shown in . In , the accuracy of the offered method is differed according to the number of epochs. Similarly, in , the failure of the offered approach is differing according to the suitable number of epochs. Finally, the given graph analysis shows that the suitable number of epochs improved then the model accuracy also increases. Accordingly, if the number of epochs decreases then the model loss also decreases.
Figure 16. Training accuracy graph of the suggested plant leaves classification with multiple diseases model (a) Model accuracy (b) Model loss.
6.16. Discussion
The existing approaches contain certain demerits like the DATFGAN (Dai et al. Citation2020) enhance the classification accuracy. However, it is harder to train for very larger image datasets. CNN (Sharma et al. Citation2020) attains high accuracy even for large data sets and more types of diseases and also provides remedies for the classified disease. But, it is hard to train the neural network since this model requires large datasets for training and slows down when processing max-pool-like operations. EfficientNet deep learning (Atila et al. Citation2021) gives high accuracy even for lower-resolution images. However, it is not suitable for rapid plant disease identification using smartphones. GoogLeNet and Cifar10 (Zhang et al. Citation2018) have improved recognition and training efficiency. Nevertheless, it has overfitting problems while using a large number of datasets. Leaf GAN (Liu et al. Citation2020) has effectively generated sufficient leaf images with prominent lesions. However, the accuracy rate is downing slightly when it deals with high-resolution images. GMDH-Logistic method (Chen et al. Citation2020) recognizes plant diseases well as well as monitors the growth of plants for future use. However, it causes deviations in the result in the case of slight and moderate disease due to a negligible gap. BRBFNN (Chohan et al. Citation2018) provides great computational efficiency for identification and classification. On the other hand, it is not improved to detect bacterial or viral diseases in plant leaves. ANN (Pham et al. Citation2020) (Giridhar et al. Citation2020) can be implemented in resource-constrained devices like smartphones. Yet it requires more trainable parameters for large-size images. GWO enlarges the fault rates. The proposed FSJ-FOA-CNN-LSTM model achieves a better convergence rate. Hence, it is proved that the offered FSJ-FOA-CNN-LSTM approach is better than the other conventional optimization algorithms and classifiers. The above outcomes suggested that the offered techniques can detect the multi-disease of plant leaves effectively with reasonable accuracy. In addition, improved deep learning techniques may be applied to the offered method with better accuracy in the future.
7. Conclusion
In this task, a novel approach was adopted for better plant leaf classification with multiple diseases. The original images of various kinds of plant leaves were given as input to the contrast enhancement approaches and scaling for pre-processing the images. Then, the binary thresholding technique was utilized for segmenting the leaf region from the pre-processed images. Next, the abnormality segmentation process was made by the developed AFKMRG approach through the FSJ-FOA algorithm. Finally, the classifications of plant leaves were performed by CNN-based optimal features and enhanced the LSTM classification technique, which was improved by the FSJ-FOA algorithm. This enhanced classification model has provided a better classification of plant leaves. The overall analysis of the offered FSJ-FOA-CNN-LSTM model has provided promising results over the conventional models. For example, the accuracy of the proposed FSJ-FOA-CNN-LSTM classification model has attained 10.46% superior performance to NN, 10% superior performance to SVM, 5.08% superior performance to CNN, 5.65% superior performance to LSTM and 4.74% superior performance to CNN-LSTM for citrus plant leaves. Hence, it was concluded that the designed FOA-CNN-LSTM method had achieved more advanced efficiency in the multi-disease classification of plant leaves. Future work will be focused on expanding the dataset of plant leaves by increasing the number of plants with diverse classes. This expansion leads the proposed model to make many accurate predictions even in complex environments. The applications of applied soft computing are given by, automotive systems and manufacturing, handwritten script recognition, image processing, data compression, decision support system, and soft computing-based architecture. The practical implications of plant leaf classification with multiple diseases are listed below, livestock health monitoring, insect and plant disease detection, crop and soil monitoring, and product grading and sorting. The limitations of the proposed work are it does not solve optimization problems and does not consider multiple leaves in a single image. In the future, the work will concentrate on implementing intelligent hybridized algorithms to enlarge the recognition rate of the final classification procedure by considering the above two problems. Moreover, future works can be focused on automatically evaluating the severity of the detected diseases.
Disclosure statement
No potential conflict of interest was reported by the authors.
Data availability statement
The analysis of multi-disease detection of plant leaves is performed by using different leaf images gathered from two diverse datasets such as Kaggle and Mendeley.
References
- Akilan T, Wu QJ, Safaei A, Huo J, Yang Y. 2020. A 3D CNN-LSTM-based image-to-image foreground segmentation. IEEE Trans Intell Transport Syst. 21(3):959–971.
- Atila U, Ucar M, Akyol K, Ucar E. 2021. Plant leaf disease classification using EfficientNet deep learning model. Ecol Inf. 61:101182.
- Borges VRP, Oliveira MCFd, Silva TG, Vieira AAH, Hamann B, et al. 2018. Region growing for segmenting green microalgae images. IEEE/ACM Trans Comput Biol Bioinform. 15(1):257–270.
- Brammya G, Praveena S, Preetha NSN, Ramya R, Rajakumar BR, Binu D. 2019. Deer hunting optimization algorithm: a new nature-inspired meta-heuristic paradigm. The Computer Journal.
- Chouhan SS, Kaul A, Singh UP, Jain S. 2018. Bacterial Foraging Optimization Based Radial Basis Function Neural Network (BRBFNN) for identification and classification of plant leaf diseases: An automatic approach towards plant pathology, Institute of Electrical and Electronics Engineers Access, 6, 8852–8863.
- Chen J, Yin H, Zhang D. 2020. A self-adaptive classification method for plant disease detection using GMDH-Logistic model. Sustain Comput: Inform Syst. 28:100415.
- Dai Q, Cheng X, Qiao Y, Zhang Y. 2020. Crop leaf disease image super-resolution and identification with dual attention and topology fusion generative adversarial network. Digit Object Identifier. 8:55724–55735.
- Darapureddy N, Karatapu N, Battula TK. 2021. Optimal weighted hybrid pattern for content-based medical image retrieval using modified spider monkey optimization. Int J Imaging Syst Technol. 31(2):828–853.
- Giridhar RB, Ofori M, Liu J, Ambati, LS. 2020. Early public outlook on the coronavirus disease (COVID-19): a social media study. Social Media Analysis on Coronavirus (COVID-19).
- Gokulnath BV, Devi GU. 2021. Identifying and classifying plant disease using resilient LF-CNN. Ecol Inf. 63:101283.
- Goodridge W, Bernard M, Jordan R, Rampersad R, et al. 2017. Intelligent diagnosis of diseases in plants using a hybrid multi-criteria decision-making technique. Comput Electron Agric. 133:80–87.
- Hang J, Zhang D, Chen P, Zhang J, Wang B. 2019. Classification of plant leaf diseases based on improved convolutional neural network. Adv Sens Agric. 19:4161.
- Hossen MS, Haque I, Islam MS, Ahmed MT, Nime MJ, Islam MA. 2020. Deep learning based classification of papaya disease recognition. In 2020 3rd International Conference on Intelligent Sustainable Systems (ICISS) ; p. 945–951.
- Hyeon Gu Y, Yin H, Jin D, Zheng R, Joon Yoo S. 2022. Improved multi-plant disease recognition method using deep convolutional neural networks in six diseases of apples and pears. Agriculture. 12(2):300.
- Iqbal Z, Muhammad Attique K, Muhammad S, Jamal Hussain S, Muhammad Habib R, Javed K. 2018. An automated detection and classification of citrus plant diseases using image processing techniques: a review. Comput Electron Agric. 153:12–32.
- Isa NAM, Salamah SA, Ngah UK. 2009. Adaptive fuzzy moving K-means clustering algorithm for image segmentation. IEEE Trans Consumer Electron. 55(4):2145–2153.
- Islam MA, Islam MS, Hossen MS, Emon MU, Keya MS, Habib A. 2020. Machine learning based image classification of papaya disease recognition. In 2020 4th International Conference on Electronics, Communication and Aerospace Technology (ICECA); p. 1353–1360.
- Islam MA, Shuvo NR, Shamsojjaman M, Hasan S, Hossain S, Khatun T. 2021. An automated convolutional neural network based approach for paddy leaf disease detection. Int J Adv Comput Sci Appl. 12 (1):280–288.
- Kaur N, Devendran V. 2020. Novel plant leaf disease detection based on optimize segmentation and law mask feature extraction with SVM classifier. Mater Ecol Inform.
- Kethineni K, Pradeepini G. 2022. Identification of leaf disease using machine learning algorithm for improving the agricultural system. J Univ Shanghai Sci Technol 24(8): 122–129.
- Kondo, et al. 2015. An age estimation method using brain local features for T1-weighted images. In 37th Annual International Conference of the IEEE Engineering in Medicine and Biology Society (EMBC); p. 666–669.
- Krishnamoorthi M, Vijayaganth V. 2022. Soft computing-based ensemble learning model for multi-disease classification of plant leaves. Geocarto International, Elsevier.
- Krishnamoorthy N, Prasad LVN, Kumar CSP, Subedi B, Abraha HB, Sathishkumar VE, et al. 2021. Rice leaf diseases prediction using deep neural networks with transfer learning. Environ Res. 198:111275.
- Liang Q, Xiang S, Hu Y, Coppola G, Zhang D, Sun W. 2019. PD2SE-Net: computer-assisted plant disease diagnosis and severity estimation network. Comput Electron Agric. 157:518–529.
- Liu B, Tan C, Li S, He J, Wang H. 2020. A data augmentation method based on generative adversarial networks for grape leaf disease identification. Instf Electr Electron Eng Access. 8:102188–102198.
- Manne R, Kantheti S, Kantheti S. 2020. Classification of Skin cancer using deep learning, convolutional neural networks - opportunities and vulnerabilities. Int J Mod Trends Sci Technol. 6(11):101–108.
- Martens D, Baesens BB, Gestel TV. 2009. Decompositional rule extraction from support vector machines by active learning. IEEE Trans Knowl Data Eng. 21(2):178–191.
- Min OY, Htun NC. 2018. Plant leaf disease detection and classification using image processing. IJRE. 5(9):516–523.
- Nagda M, Poovammal E. 2018. Image classification using a hybrid LSTM-CNN deep neural network. Soc Netw Anal Min. 8(6):1342–1348.
- Naz M, Zafar K, Khan A. 2019. Ensemble based classification of sentiments using forest optimization algorithm. Multidiscip Digit Publ Inst. 4(2):76.
- Pham TN, Tran LV, Dao SVT. 2020. Early disease classification of mango leaves using feed-forward neural network and hybrid metaheuristic feature selection. Inst Electr Electron Eng Access. 8:189960–189973.
- Prasad S, Peddoju SK, Ghosh D. 2016. Multi-resolution mobile vision system for plant leaf disease diagnosis. SIViP. 10(2):379–388.
- Ramesh D, Jose D, Keerthana R, Krishnaveni V. 2018. Detection of pulmonary nodules using thresholding and fractal analysis. Comput Vis Bio Inspired Comput.:937–946.
- Ramesh S, Vydeki D. 2020. Recognition and classification of paddy leaf diseases using Optimized Deep Neural network with Jaya algorithm. Inform Process Agric. 7(2):249–260.
- Rawat W, Wang Z. 2017. Deep convolutional neural networks for image classification: a comprehensive review. Neural Comput. 29(9):2352–2449.
- Roomi M, Maragatham GG. 2015. A review of image contrast enhancement methods and techniques. RJASET. 9(5):309–326.
- Sachdeva G, Singh P, Kaur P. 2021. Plant leaf disease classification using deep Convolutional neural network with Bayesian learning. Mater Today: Proc. 45(6):5584–5590.
- Shanthakumari R, Nalini C, Vinothkumar S, Roopadevi EM, Govindaraj B. 2022. Multi disease prediction system using random forest algorithm in healthcare system. In 2022 International Mobile and Embedded Technology Conference (MECON); pp. 242–247.
- Sharma, et al. 2020. Classification of plant leaf diseases using machine learning and image pre-processing techniques. In 10th International Conference on Cloud Computing, Data Science & Engineering (Confluence); p. 480–484.
- Sileshi F, Galano T, Biri B. 2016. Plant disease diagnosis practical laboratory manual. Adv Sens Agric.
- Simmi FZ, Dallagnol LJ, Ferreira AS, Pereira DR, Souza GM. 2020. Electrome alterations in a plant-pathogen system: toward early diagnosis. Bioelectrochemistry. 133:107493.
- Singh, et al. 2018. Bacterial foraging optimization based radial basis function neural network (BRBFNN) for identification and classification of plant leaf diseases: an automatic approach towards plant pathology. Inst Electr Electron Eng. Access. 6:8852–8863.
- Singh V, Misra AK. 2017. Detection of plant leaf diseases using image segmentation and soft computing techniques. Inform Process Agric. 4(1):41–49.
- Sreedevi A, Manike C. 2022. A smart solution for tomato leaf disease classification by modified recurrent neural network with severity computation. Cybern Syst. :1–41.
- Sreedharan, et al. 2018. Grey Wolf optimization-based feature selection and classification for facial emotion recognition. IET Biom. 7(5):490–499.
- Taujuddin, et al. 2020. Detection of plant disease on leaves using blobs detection and statistical analysis. Int J Adv Comput Sci Appl. 11(8)
- Tiwari V, Rakesh C, Joshi MKD. 2022. Deep neural network for multi-class classification of medicinal plant leaves. Expert Syst. 39 (8)
- Vellaichamy AS, Swaminathan A, Varun C, Kalaivani S. 2021. Multiple plant leaf disease classification using densenet-121 architecture. Int J Electr Eng Technol. 12(5):38–57
- Wiesner-Hanks T, Nelson R. 2016. Multiple disease resistance in plants. Annu Rev Phytopathol. 54(1):229–252.
- Wu D, Pigou L, Kindermans P-J, Le ND-H, Shao L, Dambre J, Odobez J-M. 2016. Deep dynamic neural networks for multimodal gesture segmentation and recognition. IEEE Trans Pattern Anal Mach Intell. 38(8):1583–1597.
- Yeong HG, Yin H, Jin D, Zheng R, Yoo SJ. 2022. Improved multi-plant disease recognition method using deep convolutional neural networks in six diseases of apples and pears. Agriculture. 12 (2):300.
- Zhang, et al. 2017. Radiomics assessment of bladder cancer grade using texture features from diffusion-weighted imaging. J Magn Reson Imaging. 46(5):1281–1288.
- Zhang, et al. 2018. Identification of maize leaf diseases using improved deep convolutional neural networks. Inst Electr Electron Eng Access. 6:30370–30377.