
 ?Mathematical formulae have been encoded as MathML and are displayed in this HTML version using MathJax in order to improve their display. Uncheck the box to turn MathJax off. This feature requires Javascript. Click on a formula to zoom.
Abstract
This study employed geomorphometric analysis to characterize the four major watersheds (Gilgel Abay, Gumara, Rib, and Megech) of Lake Tana sub-basin, Ethiopia, and prioritize the watersheds for the implementation of SWC practices using GIS and remote sensing techniques. Also, the study analyzed streamflow and sediment data recorded at the outlets of each watershed to associate the geomorphometric prioritization result with recordings of the watersheds. Geomorphometric analysis results indicated that the Rib watershed is the most susceptible watershed for soil erosion and should be prioritized for the implementation of SWC practices. The analysis of streamflow and suspended sediment concentration suggest that the Rib watershed had the second maximum sediment yield (14.3 t ha−1 yr−1) compared to the other three watersheds. This is because of the low streamflow response of the watershed compared with the Gumara watershed which had the highest sediment yield (18.9 t ha−1 yr−1).
1. Introduction
Land degradation in the form of soil erosion is one of the most critical environmental problems worldwide (Prăvălie et al. Citation2021). Water-induced soil erosion has both on-site and off-site effects including the reduction in soil fertility and sedimentation of water infrastructures in built-in downstream areas (Strahler Citation1964; Morgan Citation2009; Bogale et al. Citation2019; Bogale Citation2020). This in turn affects food security and the livelihood of people who depend on natural resources. Soil erosion affects half of the agricultural land and results in an annual soil loss rate of 1.5 to 2 billion tons which is equivalent to 35–42 tons ha−1 year−1 (Hurni Citation1997; Dagnew et al. Citation2015). The main drivers of soil erosion and associated negative consequences include the expansion of agricultural lands, forest degradation and unsustainable agricultural and forestry practices, and climate change (Gebreselassie et al. Citation2016). Rapid population growth, topography, soil types, and climate also highly contributed to increasing the process of soil erosion (Taddese Citation2001).
The Lake Tana basin, the headwater of the Blue Nile basin, is facing severe soil erosion that causes significant loss of soil fertility, crop productivity reduction, and environmental degradation (Goshu and Aynalem Citation2017). In line with this, Setegn et al. (Citation2009) estimated that 12 – 30% of the Lake Tana basin is prone to soil erosion. Downstream reservoirs like Grand Ethiopian Renaissance Dam (GERD) are filling with transported sediment from such erosion-prone areas. This affects water quality and agricultural productivity (Bogale et al. Citation2020). The water quality problem was the cause of the infestation of water hyacinths in Lake Tana. In response to the problem of soil erosion, the Ethiopian government in collaboration with local communities and donors has been implementing diverse SWC measures (Hurni Citation1988; Moges and Holden Citation2008; Tebebu et al. Citation2010; Desta and Hurni Citation2011). Soil and water conservation (SWC) practices are vital to improving project life and the economic benefit of the water infrastructures like GERD. Drainage basins or watersheds are the fundamental units of management and are identified as planning units for administrative purposes to conserve natural resources (Hudson Citation1987; Rahaman et al. Citation2015; Singh et al. Citation2021).
Even though SWC practices are implemented, soil erosion is continuing as a threat in Ethiopia and the Lake Tana basin. This partly is attributed to the implementation of diverse SWC practices without proper understanding and characterization of watersheds. The hydrological response and soil erosion process of a watershed is mostly depending upon various physiographic (e.g. land use, soil), hydrologic (e.g. rainfall, runoff), and geomorphometric (e.g. slope, flow length, roughness) characteristics (Setegn et al. Citation2009; Setegn Citation2010; Mekonnen and Melesse Citation2011; Zegeye et al. Citation2016). Therefore, knowledge of geomorphometric characteristics is important to discretize the hydrological behavior of watersheds in the planning phase of SWC practices. This intern helps in prioritizing watersheds for SWC practices to better soil erosion control and restore degraded landscapes. Prioritizing watersheds is essential to save a significant amount of investment costs and implement SWC practices at the right time in right place.
Geomorphometric analysis was widely used in discretizing watershed characteristics, configuration, and evolution of landforms and properties (Lin et al. Citation2021). In geomorphometric analysis, linear, areal and relief parameters can be extracted using the Geographical Information System (GIS) and remote sensing technique with more ease and better accuracy. It comprises characteristics of the channels within the watershed boundary that significantly affect the characteristics of runoff and other hydrological processes. Different scholars used geomorphometric analysis to prioritize watersheds throughout the world (Chandniha and Kansal Citation2017; Prieto-Amparán et al. Citation2019; Puno and Puno Citation2019; Kumar et al. Citation2021; Singh et al. Citation2021; Shekar and Mathew Citation2022). The studies commonly used linear, relief, and areal aspects of the geomorphic characteristics to prioritize watersheds for SWC practices. In Ethiopia, studies are limited in identifying erosion hotspot areas using geomorphometric analysis (Abdeta et al. Citation2020; Tassew et al. Citation2021). Even the existing studies lack an association of the geomorphometric analysis result with the hydrological and soil erosion recordings.
Therefore, the objective of this study was to assess the geomorphometric characteristics of Lake Tana Basin watersheds to identify watersheds with high priority to implement SWC practices. Despite the Lake Tana basin’s water resource potential, soil erosion and sedimentation are threats to the basin and its lake. This problem introduced the infestation of water hyacinth (Dersseh et al. Citation2019). A number of people living on the islands and around the lake are affected by the weed infestation (Sisheber et al. 2015). This study will contribute to the proper utilization of limited natural resources in the basin where the population is highly increasing and their livelihood is heavily dependent on these resources (Wassie Citation2020).
2. Materials and methods
2.1. Study area description
The Lake Tana basin is found in the northwestern highlands of Ethiopia. The basin forms the upper course of the Blue Nile Basin in Ethiopia. Geographically, The Lake Tana Basin liesbetween 10°56′45″ and 12°45′2″N latitude and 36°44′14″ and 38°14′15″ E longitude with a drainage area of about 15,092 km2 (). Lake Tana covers an area of 3,032 km2 with an elevation of 1,800 m and a maximum depth of 15 m (Setegn et al. Citation2011). The elevation ranges from 1774 to 4,109 m a.s.l (Rientjes et al. Citation2011). The climate of the Lake tana sub-basin is characterized as a tropical sub-humid having a wet season between June and September (Setegn et al. Citation2011). The annual rainfall ranges from 1,200 to 1,600 mm with a mean annual rainfall of 1,280 mm (Setegn et al. Citation2009). The average daily air temperature is about 20 °C (Setegn et al. Citation2011). The Lake Tana basin has four major rivers contributing 93% of the inflow to the Lake (Bogale Citation2020). These are Gilgel Abay from the south, Gumara and Ribb from the east, and Megech from the north (). Gilgel Abay river is the largest contributor (58%) of the Lake inflow where the watershed shares 38% of the total basin area (Song et al. Citation2018).
Figure 1. Location map of the study area: (a) East African countries with elevation background (b) the Lake Tana basin and its four major watersheds.
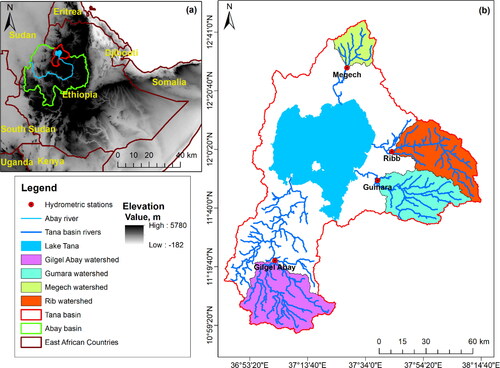
The topography of the Lake Tana basin encompasses both mountainous (upstream) and extensive flat (downstream) areas. The majority of the basin has slopes ranging from gentle to the steep slope (). Since the livelihood of the people in the basin is mainly depends on agriculture, the dominant land use of the basin is cultivated land (74%) (Goshu and Aynalem Citation2017). There are also other land uses in the basin including forestland (3%), grassland (9%), infrastructure (6%), and others. The basin is found at high risk of land degradation due to soil erosion caused by water. Major soils in the basin are Luvisols, Vertisols, Alisols, and Leptosols (). In the Lake Tana basin, there are three stratigraphic units which are Tertiary Tarmaber flood basalts, Quaternary scoriaceous basalts, and Quaternary to recent alluvial lacustrine sediments (Kebede et al. Citation2011). The geomorphology of the Lake Tana Basin is represented by bedrock in higher reaches and alluvial types in their lower and floodplain areas (Poppe et al. Citation2013).
Table 1. Major watershed characteristics of the Lake Tana Basin.
In the Lake Tana basin, a participatory watershed management approach has been taken on board by different organizations in the past decades to counteract land degradation (Abebe and Minale Citation2017). These management approaches are included biological (e.g. exclosures, reforestation) and physical (e.g. bunds, terraces, check dams). In the basin, the management interventions are fragmented and is emphasized on the physical measures (Abebe and Minale Citation2017). These efforts do not protect the basin from degradation and about 75% of the basin from moderate to severe soil erosion status (Abebe and Minale Citation2017; Goshu and Aynalem Citation2017).
2.2. Dataset
A 30 by 30 m resolution Shuttle Radar Topography Mission (SRTM) digital elevation model (DEM) of the study area on the acquisition date of 11th February 2000 was obtained from the United States Geological Survey (USGS). The DEM was used to delineate the watershed and analyze the drainage patterns and slope of the four major watersheds of the study area. Daily streamflow and suspended sediment concentration data (1990–2014) for the four rivers, Gilgel Abay, Gumera, Rib, and Megech, were obtained from the Ministry of Water and Energy (MoWE). The streamflow and sediment data were used to assess the runoff and soil erosion responses of the watersheds and verify the influence of geomorphometric characteristics of the watersheds on runoff and soil erosion. Limited suspended sediment concentration data with less than 50 data points were collected between 1983 to 2014 for each river. The mean annual sediment yield of the rivers was computed using the discharge-sediment rating curve equations developed by MoWE using the four rivers’ sediment concentration data ().
Table 2. Discharge-sediment rating curve constants developed by Ministry of Water and Energy using power equation (S = aQb where S is sediment yield in t ha−1yr−1 and Q is discharge in m3 s−1).
2.3. Data analysis
The ArcGIS 10.1 hydrology tools were used to derive terrain and hydrological parameter that describe the drainage patterns of the basin. A threshold of 200 ha was arbitrarily selected to generate the geomorphometric parameters of the watersheds. The linear, areal, and relief aspects of four major watersheds were used as indicators to characterize the geomorphometry of the watersheds. The behavior of a river and its tributaries from head to mouth is revealed by a linear aspect of a drainage network (Resmi et al. Citation2019). In this study, stream order, number of streams, stream length, mean stream length, bifurcation ratio, and length of overland flow were analyzed and used to characterize the linear aspects of the watershed (). The influence of lithology, geological structure, climatic conditions, and denudation history of the basin are reflected by areal aspects of a drainage basin (Resmi et al. Citation2019). In this study, the areal morphometric parameters such as drainage density, stream frequency, drainage density, compactness coefficient, infiltration number, elongation ratio, form factor, and circulatory ratio were included (). Relief is a three-dimensional aspect that measures the vertical fall from the head of each stream segment to the point where it joins the higher-order stream (Singh et al. Citation2020). It includes the important parameters that help to investigate the various geo-hydrological characteristics (Sreelakshmy et al. Citation2021) like total basin relief, relief ratio, and ruggedness number (). The linear, areal, and aspect geomorphometric parameters support prioritizing the watersheds to implement SWC measures (Puno and Puno Citation2019; Singh et al. Citation2021). summarizes basin geometry, linear areal, relief morphometric parameters, and methods for estimating the variables. In this study, maps of aspect, drainage density, relative relief, and ruggedness index were also used to depict the geomorphometric difference of watersheds.
Table 3. Geomorphometric characteristics of the watershed and methods for assessing the variables.
Geomorphometric parameters such as total stream length, average bifurcation ratio, the average length of overland flow; drainage density, stream frequency, form factor, drainage texture, compactness coefficient, infiltration number, elongation ratio, circularity ratio, relief ratio, and ruggedness number were used in the prioritization of watersheds for SWC practices. Depending upon the magnitude of each geomorphometric parameter, all four major watersheds of Lake Tana Basin were assigned a priority rank ranging from 1 to 4. Higher priorities (numerically small) are given to the watersheds having higher soil erodibility and vice versa. Weights were assigned to each of the parameters depending on their importance concerning soil erosion risk. The weights 30%, 40%, and 30% were assigned to the linear, areal, and relief geomorphometric aspects of the watershed, respectively, to prevent the results from inclining toward the seven areal aspects (Singh et al. Citation2021). Each priority rank is then multiplied by their respective weights, and the sum of all the morphometric parameters for each watershed is the compound rank for that watershed. Finally, based on the magnitude of compound ranks, the watersheds have been ranked and assigned a priority value. The lowest numerical value of compound rank has been given the highest priority of rank 1, indicating the most vulnerable watershed that needs soil and water conservation measures. Whereas, the largest numerical value of compound rank has been given the lowest priority of rank 4 indicating the least vulnerable to soil erosion.
Geomorphometric analysis might not be enough to conclude the difference between watersheds in runoff generation, soil erosion, and identifying erosion hotspot areas. Therefore, associating geomorphometric results with descriptive statistical analysis of observed streamflow and sediment data is important. Descriptive statistics including daily minimum, maximum and average streamflow and sediment concertation were computed to associate the geomorphometric result with streamflow and sediment concentration. In addition, the mean monthly and mean annual streamflow and sediment yield was also computed for result association. In this study, every single parameter was correlated with the corresponding parameter to assess the relationship with geomorphometric parameters. Pearson’s correlation was used for this purpose.
The formula for the Pearson product moment correlation coefficient, r, is:
(1)
(1)
where, xj and yi are the sequential data value, and,
and
are the sample means.
3. Results and discussion
3.1. Basin geometry
All three watersheds are under medium-sized watersheds (Wolfe et al. Citation2019). Gilgel Abay and Megech watershed are nearly fan-shaped watersheds that produce greater flood intensity and the time of concentration is less, whereas Gumara and Rib watersheds have fern (leaf) shapes, suggesting that the time of concentration is more and the discharge is distributed over a long period (). The time of concentration is directly linked to flow path or basin length for Gumara and Rib (). The basin length of Gilgel Abay is approximately two-fold greater than Megech. Therefore, Megech is a watershed that has the smallest time of concentration and peak flow occurs soon among the other three watersheds. This indicates that the shape perimeter has a direct relation with the drainage area, as it defined the horizontal projection of its water divide that delimits the area of the drainage area (Zavoianu Citation1985). Geometrically, Gigel Abay and Gumara watersheds’ stream network is partially parallel but it is originally a dendritic type pattern, whereas, Rib and Megech watersheds have a dendritic pattern but some of the streams indicate a parallel network (). As indicated by Marghany (Citation2022), a parallel drainage pattern indicates the presence of a major fault that cuts across an area of steeply folded bedrock. Major faults may enhance sub-surface flow and increase baseflow yields of the watersheds or the water can transfer to the adjacent basin (Adem et al. Citation2020). The slope orientation of the four watersheds is different based on aspect maps (). North-to-south or south-to-north streams are dominant in Gilgel Abay and Megech watersheds while east-to-west streams are common in Gumara ana Rib watersheds.
Figure 2. Stream orders, drainage lines and shapes of watersehds: (a) Gilgel Abay (b) Gumara (c), Rib, and (d) Megech.
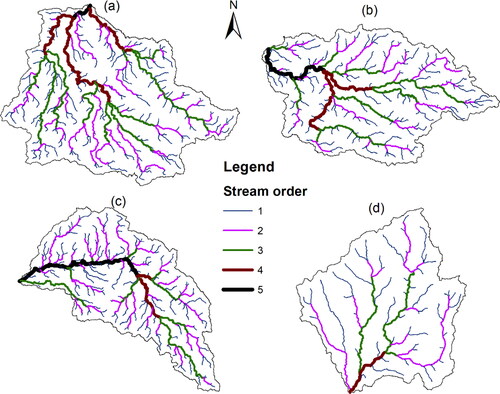
Figure 3. Aspect map of watersheds: (a) Gilgel Abay (b) Gumara (c), Rib, and (d) Megech.
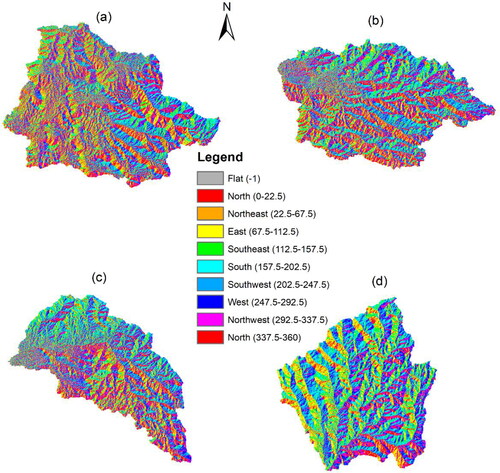
Table 4. Parameters of basin geometry and linear aspect for Gilgel Abay, Gumara, Rib and Megech watersheds.
3.2. Linear morphometry
The linear aspects of the watershed analyzed in this study include stream order, number of streams, stream length, mean stream length, bifurcation ratio, and length of overland flow (). The Megech watershed has 4 stream orders, whereas Gilgel Abay, Gumara, and Rib watersheds have 5 stream orders each. This indicates that the studied watersheds have complex nature of physiographic and structural conditions. In each stream order, Gilgel Abay has the highest number of streams compared to the others. The number of streams in the Rib watersheds is higher than in Gumara and Megech but the stream numbers in the 3rd stream order of the Rib watershed are less than Gumara watershed. In general, lower stream orders have a high number of streams and the number become decreasing when the stream order is increasing ().
There is a variation in stream length between the four watersheds and between stream orders due to differences in slope and topographic conditions. Gilgel Abay watershed displayed the longest stream length compared to others but its 5th-order stream length is much less than Gumara and Rib (). This is because of the high basin length of the Gumara and Rib watersheds. Stream length is one of the watershed characteristics affecting streamflow and sediment yield (Resmi et al. Citation2019). Usually, streams with shorter lengths are associated with a steep slope and are frequent in number, whereas longer streams are associated with gentle and well-drained watersheds (Sethupathi et al. Citation2011; Sreelakshmy et al. Citation2021). This indicates that watersheds with shorter stream lengths like Megech have the potential for infiltration than runoff. The mean stream length was 3.19 km for Rib, 3.26 for Gumara, 3.46 for Gilgel Abay, and 3.72 km for the Megech watershed (). Even if the stream order is lower in the Megech watershed, its mean stream length is higher than the other four watersheds because of its direct proportion to the size and topography of the basin (Resmi et al. Citation2019). This is an indication of the presence of long stream lengths within the small number of streams in the Megech watershed. The low mean stream length in the Rib and Gumara watersheds shows a higher surface flow and erosion (Gopinath et al. Citation2016).
Individual bifurcation ratio of the four watersheds ranged from 2 to 5.88 and the average bifurcation ratio ranged was 3.89, 3.93, 3.94, and 3.99 for Gumara, Gilgel Abay, Megech, and Rib (). In both cases, the Rib watershed has the maximum bifurcation ratio. According to Singh et al. (Citation2020), a watershed with a bifurcation ratio of less than 3 does not exhibit structural influence on drainage pattern, with between 3 and 5, the watershed exhibits little structural influence on drainage pattern and watershed with greater than 5 bifurcation ratio exert both lithological and structural influence on drainage pattern. Thus, geological structures have less influence on the drainage pattern in the studied watersheds except for the bifurcation ratio of stream order two to three.
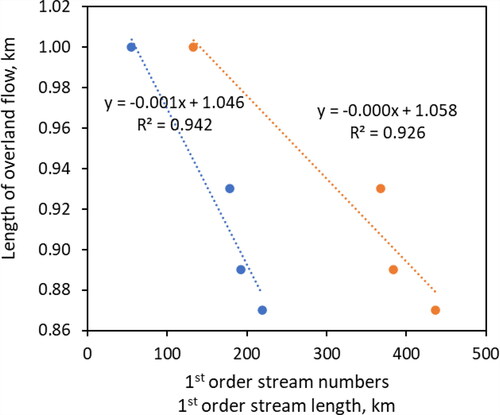
The hydrologic and physiographic development of a drainage basin is highly affected by the length of overland flow (Ansari et al. Citation2012), where water runs across the land after rainfall and before it enters a watercourse. The length of overland flow is maximum for Megech (1 km) and minimum for Gilgel Abay (0.87) watersheds (), suggesting that Gilgel Abay has a low degree of sheet erosion while sheet erosion is the prominent factor for hydrologic and physiographic development in Megech watershed. The length of overland flow has a strong and inverse linear relationship with the 1st order stream number and stream length (). This is because of that the 1st stream orders are channels which directly linked with the overland flow. Since there is a distinct difference between stream number and length, there is a rapid decrease of the length of overland flow with increasing stream number than stream length.
Figure 4. Relationship of the length of overland flow versus 1st order stream number (blue) and stream length (orange).
3.3. Areal morphometry
Results of areal morphometric parameters including drainage density, stream frequency, drainage density, compactness coefficient, infiltration number, elongation ratio, form factor, and circulatory ratio are shown in . The drainage density of the watersheds ranged from 0.5 to 0.58 km km−2, whereas the drainage texture ranged from 0.44 to 0.89 (). Spatially, pixels having maximum values of drainage density are large in number in Gilgel Abay and Rib watersheds (). The low drainage density in Megech indicates that the watershed has coarse drainage texture and consequently less runoff and high percolation (Singh et al. Citation2020). Stream frequencies of Gilgel Abay, Gumara, Rib, and Megech were 0.17, 0.16, 0.18, and 0.13 number km−2, respectively (). According to Horton (Citation1945), higher stream frequency indicates more surface runoff, low infiltration capacity, high relief, and a steep slope. Hence, Gilgel Abay and Gumara have more surface runoff and low infiltration capacity compared to Rib and Megech watersheds. There is a positive correlation between stream density and stream frequency; the density increases with more streams () and the area is more or less affected by rainfall (Singh et al. Citation2020). The compactness coefficient of Gilgel Abay, Gumara, Rib, and Megech were 2.16, 2.24, 2.31, and 1.93, respectively. According to Singh et al. (Citation2021), the compactness coefficient has inverse effects on soil erosion. The infiltration number of the four watersheds ranged from 0.067 to 0.099 which Megech having the lowest and Rib watershed having the highest. The high value of infiltration number denotes impermeable lithology and higher surface runoff in the area. The result indicated that, Gilgel Abay and Rib watersheds have low infiltration and high surface runoff while Megech and Gumara watersheds have relatively high infiltration and low surface runoff.
Figure 5. Drainage density map of watersheds: (a) Gilgel Abay (b) Gumara (c), Rib, and (d) Megech.
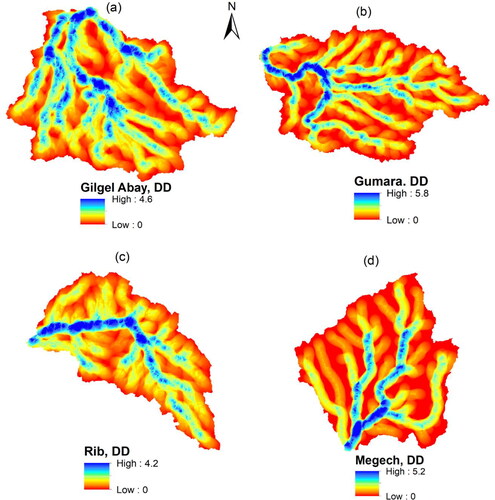
Table 5. Aspect and relief morphometric parameter values of studied watersheds.
The lower elongation ratio is found in the Rib (0.47) and Gumara (0.51) watersheds compared to the other two watersheds (). A higher elongation ratio is an indication for watersheds that have high runoff with low infiltration capacity and a lower elongation ratio indicates low runoff with high infiltration capacity (Gopinath et al. Citation2016). Accordingly, Rib and Gumara watersheds have low runoff and high infiltration capacity. Form factor is an important parameter that indicates the flow intensity of watersheds (Horton Citation1932). The higher form factor in Megech (0.31) watershed () implies maximum flow during a short period (Gopinath et al. Citation2016). On the other hand, lower form factor values in Rib and Gumara watersheds indicate fern-shaped drainage basin (). The circularity ratio of the watersheds ranged from 0.19 to 0.27 with a maximum in Megech and a minimum in Rib watersheds (). Similar to the form factor, a lower circularity ratio indicates the elongated shape of watersheds with high permeability and analogous geologic materials (Miller Citation1953).
3.4. Relief morphometry
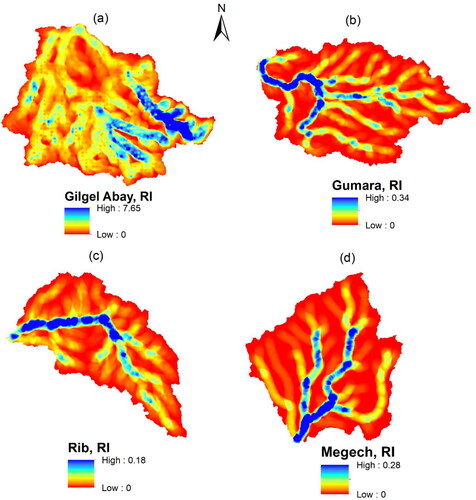
The results of relief geomorphometric parameters such as total basin relief, relief ratio, and ruggedness number are shown in . The results indicated that the lowest basin relief of the watersheds was found in Megech and the highest in Rib (). This indicates that the magnitude of surface runoff, debris movement, and spreading of water is higher in Rib than in Megech watershed (Gopinath et al. Citation2016). The relief ratio of Gilgel Abay, Gumara, Rib, and Megech watersheds are 0.022, 0.024, 0.025, and 0.027, respectively (). The relief ratio indicates the steepness of a watershed (Phani Citation2014). The relative relief map of the watersheds also showed that the areal coverage of maximum values is large in the Rib and Gumara watersheds (). The result of this study indicated that Megech and Rib have more severe erosion process than Gilgel Abay and Gumara watersheds. The relief ratio has an inverse relation with drainage area (). The other relief aspect parameter that is used to indicate the structural complexity of the terrain in association with the relief and drainage density is the ruggedness number (Altaf et al. Citation2013). The minimum and maximum ruggedness number imply the least and most susceptible to erosion (Rashid et al. Citation2011; Zaz and Romshoo Citation2012). In this study, the ruggedness number is minimum in Megech (0.56) and maximum in Rib (1.31) watersheds (). Although the ruggedness number is maximum in the Rib watershed, the highest ruggedness index is observed in the upstream areas of Gilgel Abay watershed ()
Figure 6. Relative relief map of watersheds: (a) Gilgel Abay (b) Gumara (c), Rib, and (d) Megech.
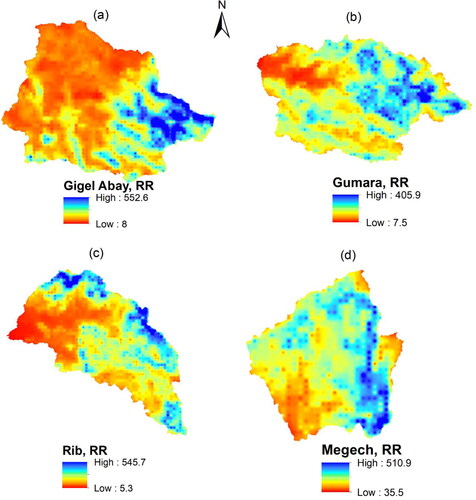
Figure 7. Ruggedness index map of watersheds: (a) Gilgel Abay (b) Gumara (c), Rib, and (d) Megech.
The correlation matrix among all parameters of the four major watersheds of the Lake Tana basin is shown in . Strong positive (correlation coefficient (r) ≥0.9 and red color numbers in ) and negative correlation (r ≤ −0.9 and light blue numbers in ) was observed between 20% and 14% of the crosses of parameters, respectively. In crosses of geomorphometric parameters, 26% (13% each) have good positive (0.75 ≤ r < 0.9 and green color numbers in ) and negative (-0.9 > r ≥ −0.75 and orange color numbers in ) correlations, respectively. There is also a moderate positive and negative correlation between the parameters (purple and dark blue color numbers in ). In general, except for 29% of the -cross-correlations, most of the geomorphometric parameters have positive or negative correlations with each other. This indicated that each geomorphometric parameters have positive or negative relationships since one parameter exists as independent from the other dependent parameters ().
Table 6. Correlation matrix for geomorphometric parameters of the four major watersheds of Lake Tana basin.
Table 7. Prioritization of the four watersheds using geomorphometric parameters.
3.5. Prioritizing watersheds
According to Puno and Puno (Citation2019) and Singh et al. (Citation2021), morphometric parameters such as total stream length, bifurcation ratio, drainage texture, drainage density, stream frequency, length of overland flow, relief ratio, and ruggedness number have a direct relationship with soil erodibility while other parameters such as form factor, compactness coefficient, circulatory ratio, elongation ratio, and relief ratio have an inverse relationship with soil erodibility () . Watersheds were prioritized based on the assigned rank taking into account the geomorphometric parameters with direct and inverse effects on erosion rates. The Rib has gained the first priority area for conservation having the least compound value attributed to its inherent geomorphometric characteristics while Megech was observed to be the last priority (). Gilgel Abay and Megech watersheds are the second and third priority watershed for soil and water conservation (SWC) practices.
Table 8. Daily minimum, maximum, and mean streamflow and suspended sediment concentration as well as mean annual streamflow and sediment yield of the studied rivers.
3.6. The association of prioritization with recorded data
The descriptive statistics of streamflow, suspended sediment concentration, and yield between 1990-2014 on a daily and annual basis from the gauging outlets are shown in . The daily minimum streamflow of the four rivers was 0 to 0.51 m3 s−1. The higher values for Gilgel Abay and Gumara watersheds were because of the baseflow yield throughout the years. In some dry years, the baseflow of the Megech and Rib rivers decreased to zero. This can be attributed to the excessive abstraction of water for irrigation and the deep percolation of the sub-surface water. On the other hand, the daily maximum streamflow of Megech river is the highest (530 m3 s−1) and Gilgel Abay has a higher daily maximum streamflow next to Megech (). The two elongated watersheds, Gumara and Rib, have relatively lower daily maximum streamflow, suggesting that the streamflow picks are maximum for the fan-shaped Megech and Gilgel Abay watersheds.
Daily mean streamflows of the four watersheds were 10.3, 15.6, 37.7, and 55 m3 s−1 for Megech, Rib, Gumara, and Gilgel Abay (). The daily mean streamflow is directly proportional to the annual mean flow volume. According to the mean annual volume of the rivers, Gilgel Abay is contributing about 46% of the total inflow of Lake Tana at the gauging outlet compared to the other three rivers. Gumara river is the second contributor of streamflow with 32%. The contribution of both Rib and Megech is less than Gumara river. Even if the drainage area of the Rib watersheds is high, its streamflow contribution is small as compared to the Gumara watershed, with a similar agroclimatic zone. This could be due to the sub-surface movement of water to the adjacent basin (Adem et al. Citation2020).
Daily minimum suspended sediment concentration of Gilgel Abay, Gumara, Rib, and Megech is 0.03, 0.16, 0.05, and 0.13 g l−1, respectively (). Megech and Gumara rivers had higher values than Gilgel Abay and Rib. The maximum daily suspended sediment concentration of the rivers ranged from 3.48 to 63.05 g l−1 which has an inverse relation to the mean daily and mean annual streamflow of the rivers. Hence, the Megech river has the least streamflow but it carries a high concentration of suspended sediment. This makes the watershed producing the least sediment yield (4.1 t ha−1 yr−1) and the last priority for implementing SWC practices that confirms the geomorphometric prioritization of the Megech watershed. Gilgel Abay, the watershed having the smallest daily maximum sediment concentration, becomes the third watershed that exports 11.9 t ha−1 yr−1 sediment yield (). However, the watershed is the second priority watershed for conservation using geomorphometric analysis. This can be attributed to the high deposition of sediment from the river channels during sediment transport.
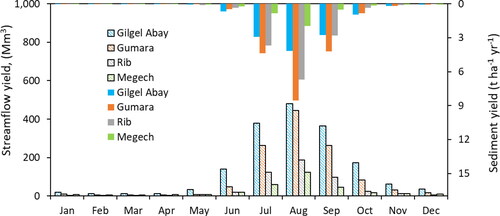
Rib watershed is in second place having a mean annual sediment yield of 14.3 t ha−1 yr−1 but it is in the first priority watershed for conservation using the geomorphometric analysis (). This is because of the reduced streamflow delivered from the gauging outlet because the subsurface transfer of water to the adjacent basin (Adem et al. Citation2020). As reported by Adem et al. (Citation2020), the effect of geology on hydrological responses should be considered in prioritizing watersheds for SWC practices. Gumara watershed has the highest mean annual sediment yield with 18.9 t ha−1 yr−1 which contributed 34% of the total sediment yield coming from the four major gauged watersheds. In all the watersheds, the pick streamflow and sediment yield were recorded in August (). In the four gauged watersheds, between 89 and 97% of the streamflow yield was recorded in the four wet months (June, July, August and September), whereas, from 77 to 87% of the sediment yield was recorded in these wet months (). In the four wet months, the highest streamflow yield (97%) was recorded in Megech watershed while sediment yield is the lowest in this watershed (77%). Gilgel Abay watershed has 89% of the streamflow yield in the four wet months but the sediment yield is maximum from the Gumara watershed.
Figure 8. Mean annual streamflow and sediment yield of the studied watersheds.
4. Conclusion
The study employed GIS and remote sensing techniques to characterize the four major watersheds in the Lake Tana sub-basin and suggest a priority watershed for implementing soil and water conservation (SWC) measures. In this study, the runoff process of the watersheds was explained with the analysis of geomorphometric characteristics. The analyses result suggest that the watersheds are different in geomorphometric characteristics and severity of runoff and soil erosion. Rib watershed is the first priority area for conservation having the least compound value attributed to its inherent geomorphometric characteristics while Gilgel Abay, Gumara, and Megech were observed to be the second, third, and last priority for SWC. Thus, the investment in the planning and implementation of SWC measures should focus on the Rib watershed, then continue the implementation of SWC measures in the other three watersheds. Prioritizing the watersheds for planning and implementation of SWC measures support maximizing the benefits of the interventions and reducing the threats in a short period. The runoff process intern explains the erosion process, more specifically sheet and rill erosion types of the watersheds. However, gullies are the main source of soil erosion transport and deposition. Therefore, future studies need to account for gully morphological parameters and the effect of geological structures (lineaments and faults) in prioritizing watersheds for conservation practices. In addition, this study used a limited observed dataset between 1990 and 2014. In doing similar studies from the same watersheds, future studies should account for recent streamflow and sediment concentration recordings.
Acknowledgments
Ethiopia Ministry of Water and Energy (MoWE) provided streamflow and sediment concentration data support for this research.
Disclosure statement
No potential conflict of interest was reported by the authors.
Data availability statement
The raw data required to reproduce the above findings are available to the corresponding author Dr. Anwar A. Adem ([email protected]) on reasonable request.
References
- Abdeta GC, Tesemma AB, Tura AL, Atlabachew GH. 2020. Morphometric analysis for prioritizing sub-watersheds and management planning and practices in Gidabo Basin, Southern Rift Valley of Ethiopia. Appl Water Sci. 10(7):158.
- Abebe WB, Minale AS. 2017. Land use and watershed management practices in Lake Tana Basin. In: Stave K, Goshu G, Aynalem S, editors. Social and ecological system dynamics: characteristics, trends, and integration in the Lake Tana Basin, Ethiopia. Cham: Springer International Publishing; p. 479–521.
- Adem AA, Addis GG, Aynalem DW, Tilahun SA, Mekuria W, Azeze M, Steenhuis TS. 2020. Hydrogeology of volcanic highlands affects prioritization of land management practices. Water. 12(10):2702.
- Altaf F, Meraj G, Romshoo SA. 2013. Morphometric analysis to infer hydrological behaviour of Lidder watershed, Western Himalaya, India. Geogr Jo. 2013:1–14.
- Ansari ZR, Rao LAK, Yusuf A. 2012. GIS based morphometric analysis of Yamuna drainage network in parts of Fatehabad area of Agra district, Uttar Pradesh. J Geol Soc India. 79(5):505–514.
- Bogale A. 2020. Review, impact of land use/cover change on soil erosion in the Lake Tana Basin, Upper Blue Nile, Ethiopia. Appl Water Sci. 10(12):235.
- Bogale A, Aynalem D, Adem A, Mekuria W, Tilahun S. 2020. Spatial and temporal variability of soil loss in gully erosion in upper Blue Nile basin, Ethiopia. Appl Water Sci. 10(5):106.
- Bogale AG, Aynalem DW, Adem AA, Mekuria W, Tilahun SA. 2019. Evaluating the role of runoff and soil erosion on nutrient loss in the Chenetale Watershed, Upper Blue Nile Basin, Ethiopia. In: Zimale FA, Enku Nigussie T, Fanta SW, editors. Advances of science and technology. Cham: Springer International Publishing; p. 274–287.
- Chandniha SK, Kansal ML. 2017. Prioritization of sub-watersheds based on morphometric analysis using geospatial technique in Piperiya watershed. Appl Water Sci. 7(1):329–338.
- Dagnew DC, Guzman CD, Zegeye AD, Tibebu TY, Getaneh M, Abate S, Zemale FA, Ayana EK, Tilahun SA, Steenhuis TS. 2015. Impact of conservation practices on runoff and soil loss in the sub-humid Ethiopian Highlands: the Debre Mawi watershed. J Hydrol Hydromech. 63(3):210–219.
- Dersseh MG, Melesse AM, Tilahun SA, Abate M, Dagnew DC. 2019. Chapter 19 – Water hyacinth: review of its impacts on hydrology and ecosystem services—Lessons for management of Lake Tana. In: Melesse AM, Abtew W, Senay G, editors. Extreme hydrology and climate variability. Elsevier; p. 237–251. Amsterdam, Netherlands.
- Desta, G., & Hurni, H. 2011. Farmers’ participatory soil erosion assessment and soil conservation improvement: application of local erosion indicators. ESAPP-CDE,. Amhara Region Agricultural Research Institute (ARARI), Ethiopia, and Centre for Development and Environment (CDE), Bern, Switzerland.
- Gebreselassie S, Kirui OK, Mirzabaev A. 2016. Economics of land degradation and improvement in Ethiopia. Economics of land degradation and improvement–a global assessment for sustainable development. Cham: Springer; p. 401–430.
- Gopinath G, Nair AG, Ambili GK, Swetha TV. 2016. Watershed prioritization based on morphometric analysis coupled with multi criteria decision making. Arab J Geosci. 9(2):129.
- Goshu G, Aynalem S. 2017. Problem overview of the Lake Tana Basin. In: Stave K, Goshu G, Aynalem S, editors. Social and ecological system dynamics: characteristics, trends, and integration in the Lake Tana Basin, Ethiopia. Cham: Springer International Publishing; p. 9–23.
- Horton RE. 1932. Drainage-basin characteristics. Transactions, American Geophysical Union. 13(1):350–361.
- Horton RE. 1945. Erosional development of streams and their drainage basins; hydrophysical approach to quantitative morphology. Geol Soc America Bull. 56(3):275–370.
- Hudson N. 1987. Soil and water conservation in semi-arid areas. Food Agric Org. 57. 151–164.
- Hurni H. 1988. Degradation and conservation of the resources in the Ethiopian highlands. Mt Res Dev. 8(2/3):123–130.
- Hurni H. 1997. Concepts of sustainable land management. ITC J. 3:210–215.
- Kebede S, Admasu G, Travi Y. 2011. Estimating ungauged catchment flows from Lake Tana floodplains, Ethiopia: an isotope hydrological approach. Isot Environ Health Stud. 47(1):71–86.
- Kumar V, Sen S, Chauhan P. 2021. Geo-morphometric prioritization of Aglar micro watershed in Lesser Himalaya using GIS approach. Model Earth Syst Environ. 7(2):1269–1279.
- Lin S, Chen N, He Z. 2021. Automatic landform recognition from the perspective of watershed spatial structure based on digital elevation models. Remote Sens. 13(19):3926.
- Marghany M. 2022. Chapter 11 – Quantum cellular automata algorithm for automatic detection of hydrocarbon exploration zones. In: Marghany M, editor Advanced algorithms for mineral and hydrocarbon exploration using synthetic aperture radar. Elsevier; p. 301–323, Oxfordshire, United Kingdom.
- Mekonnen M, Melesse AM. 2011. Soil erosion mapping and hotspot area identification using GIS and remote sensing in Northwest Ethiopian Highlands, Near Lake Tana. In: Melesse AM, editor. Nile river basin: hydrology, climate and water use. Dordrecht, Netherlands: Springer; p. 207–224.
- Miller V. 1953. A quantitative geomorphic study of drainage basin characteristics in the Clinch Mountain area, Virginia and Tennessee. Office of Naval Research, Geography Branch. Geography Branch, Project. (389-042):1–30.
- Moges A, Holden NM. 2008. Estimating the rate and consequences of gully development, a case study of Umbulo catchment in Southern Ethiopia. Land Degrad Dev. 19(5):574–586.
- Morgan RPC. 2009. Edition T, editor. Soil erosion and conservation. John Wiley & Sons. Hoboken, New Jersey (United States).
- Phani R. 2014. Morphometry and its implications to stream sediment sampling: a study on WajrakarurKimberlite field, penna river basin, anantapur district, Andhra Pradesh, India. Int J Geomatics and Geosci. 5(1):74–90.
- Poppe L, Frankl A, Poesen J, Admasu T, Dessie M, Adgo E, Deckers J, Nyssen J. 2013. Geomorphology of the Lake Tana basin, Ethiopia. J Maps. 9(3):431–437.
- Prăvălie R, Patriche C, Borrelli P, Panagos P, Roșca B, Dumitraşcu M, Nita I-A, Săvulescu I, Birsan M-V, Bandoc G. 2021. Arable lands under the pressure of multiple land degradation processes. A global perspective. Environ Res. 194:110697.
- Prieto-Amparán JA, Pinedo-Alvarez A, Vázquez-Quintero G, Valles-Aragón MC, Rascón-Ramos AE, Martinez-Salvador M, Villarreal-Guerrero F. 2019. A multivariate geomorphometric approach to prioritize erosion-prone watersheds. Sustainability. 11(18):5140.
- Puno G, Puno R. 2019. Watershed conservation prioritization using geomorphometric and land use-land cover parameters. Global J Environ Sci Manage. 5(3):279–294.
- Rahaman SA, Ajeez SA, Aruchamy S, Jegankumar R. 2015. Prioritization of sub watershed based on morphometric characteristics using fuzzy analytical hierarchy process and geographical information system – A study of Kallar Watershed, Tamil Nadu. Aquat Procedia. 4:1322–1330.
- Rashid M, Lone MA, Romshoo SA. 2011. Geospatial tools for assessing land degradation in Budgam district, Kashmir Himalaya, India. J Earth Syst Sci. 120(3):423–433.
- Resmi M, Babeesh C, Achyuthan H. 2019. Quantitative analysis of the drainage and morphometric characteristics of the Palar River basin, Southern Peninsular India; using bAd calculator (bearing azimuth and drainage) and GIS. Geol Ecol Landscapes. 3(4):295–307.
- Rientjes THM, Haile AT, Kebede E, Mannaerts CMM, Habib E, Steenhuis TS. 2011. Changes in land cover, rainfall and stream flow in Upper Gilgel Abbay catchment, Blue Nile basin – Ethiopia. Hydrol Earth Syst Sci. 15(6):1979–1989.
- Schumn S. 1956. Evolution of drainage basins and slopes in bund land of Peth Amboy, New Jersey. Bull Geol Soc Am. 67:597–646.
- Setegn SG. 2010. Modelling Hydrological and Hydrodynamic Processes in Lake Tana Basin, Ethiopia [Doctoral thesis, comprehensive summary]. Stockholm: KTH.
- Setegn SG, Rayner D, Melesse AM, Dargahi B, Srinivasan R. 2011. Impact of climate change on the hydroclimatology of Lake Tana Basin, Ethiopia. Water Resour Res. 47(4): W04511
- Setegn SG, Srinivasan R, Dargahi B, Melesse AM. 2009. Spatial delineation of soil erosion vulnerability in the Lake Tana Basin, Ethiopia. Hydrol Processes. 23(26):3738–3750.
- Sethupathi A, Narasimhan CL, Vasanthamohan V, Mohan S. 2011. Prioritization of miniwatersheds based on Morphometric Analysis using Remote Sensing and GIS techniques in a draught prone Bargur–Mathur subwatersheds, Ponnaiyar River basin, India. Int J Geomat Geosci. 2(2):403–414.
- Singh AP, Arya AK, Singh DS. 2020. Morphometric analysis of Ghaghara River Basin, India, using SRTM data and GIS. J Geol Soc India. 95(2):169–178.
- Singh WR, Barman S, Tirkey G. 2021. Morphometric analysis and watershed prioritization in relation to soil erosion in Dudhnai Watershed. Appl Water Sci. 11(9):151.
- Sisheber, B., Fente, D., Adgo, E., & Nyssen, J. 2015. Regional Geography of Dek Island, Lake Tana, Ethiopia. TropiLakes. Tropical lakes in a changing environment: water, land, biology, climate and humans: excursion guide mid-conference excursion; 2015; Bahir Dar. Bahir Dar University.
- Shekar PR, Mathew A. 2022. Morphometric analysis for prioritizing sub-watersheds of Murredu River basin, Telangana State, India, using a geographical information system. J Eng Appl Sci. 69(1):44.
- Song C, Nigatu L, Beneye Y, Abdulahi A, Zhang L, Wu D. 2018. Mapping the vegetation of the Lake Tana basin, Ethiopia, using Google Earth images. Earth Syst Sci Data. 10(4):2033–2041.
- Sreelakshmy M, Dhanusree M, Thangamani V. 2021. Application of GIS techniques to understand the geomorphometric characteristics of a tropical watershed in South India. Geol Ecold Landscapes. 1–13.
- Strahler AN. 1964. Part II. Quantitative geomorphology of drainage basins and channel networks. In: Handbook of applied hydrology. New York: Mcgraw-Hill. p. 4–39.
- Taddese G. 2001. Land degradation: a challenge to Ethiopia. Environ Manage. 27(6):815–824.
- Tassew BG, Belete MA, Miegel K. 2021. Assessment and analysis of morphometric characteristics of Lake Tana sub-basin, Upper Blue Nile Basin, Ethiopia. Int J River Basin Manage. 1–15.
- Tebebu TY, Abiy AZ, Zegeye AD, Dahlke HE, Easton ZM, Tilahun SA, Collick AS, Kidnau S, Moges S, Dadgari F, et al. 2010. Surface and subsurface flow effect on permanent gully formation and upland erosion near Lake Tana in the northern highlands of Ethiopia. Hydrol Earth Syst Sci. 14(11):2207–2217.
- Wassie SB. 2020. Natural resource degradation tendencies in Ethiopia: a review. Environ Syst Res. 9(1):33.
- Wolfe JD, Shook KR, Spence C, Whitfield CJ. 2019. A watershed classification approach that looks beyond hydrology: application to a semi-arid, agricultural region in Canada. Hydrol Earth Syst Sci. 23(9):3945–3967.
- Zavoianu I. 1985. Chapter V Perimeter of Drainage Basins. In: Zävoianu I, editor. Developments in water science. Elsevier; p. 88–102. Amsterdam, Netherlands.
- Zaz SN, Romshoo SA. 2012. Assessing the geoindicators of land degradation in the Kashmir Himalayan region. Nat Hazards. 64(2):1219–1245.
- Zegeye AD, Langendoen EJ, Stoof CR, Tilahun SA, Dagnew DC, Zimale FA, Guzman CD, Yitaferu B, Steenhuis TS. 2016. Morphological dynamics of gully systems in the subhumid Ethiopian Highlands: the Debre Mawi watershed. SOIL. 2(3):443–458.