
Abstract
Using the object-based image analysis (OBIA) technique, this study examined structural characteristics, quantified carbon stocks, and identified tree species in the tropical forests of southwestern Nigeria. The Structure from Motion (SfM) technique was used to produce orthomosaics with a ground sampling distance of 10 m from orthophotos recorded during a survey and optimized for forest assessment with the near-infrared band. In addition to tree species variables, GPS coordinates, tree diameter, and tree crown were all employed to estimate carbon stock in the study area. Carbon stock estimates of 450 tons per hectare were estimated , with a tree-specific range of 65 kg per tree to 8,488 kg per tree. There was a correlation between tree canopies and diameters, but no conclusive relationships between tree species distribution and position in their natural formations. OBIA significantly enhanced the current carbon inventory and provided a spatial characterization of species distribution in the research area.
1. Introduction
Tropical forests are incredibly important to the health and well-being of our planet. In addition to their role in the global carbon cycle and their ability to store carbon, tropical forests are also home to a tremendous amount of biodiversity, including many endangered and threatened species (Price et al. Citation2020).Tropical forests provide a variety of ecosystem services that are critical to human well-being, such as regulating the climate, protecting watersheds, and providing habitat for pollinators and other wildlife (Buragohain et al. Citation2023). They also provide resources such as timber, non-timber forest products, and medicinal plants that are important for human use. Unfortunately, tropical forests around the world are under threat due to a variety of factors, including deforestation, agricultural expansion, mining, and climate change (Abbasi et al. Citation2022). Conservation efforts are crucial to protecting these important ecosystems and preserving their benefits for future generations. ((Baccini et al. Citation2012; Pan et al. Citation2011; Xu et al. Citation2020)). For assessing forest structure, understanding differences in species richness, ecosystem services, and the influence of deforestation and forest degradation on current and future climate, a variety of methodologies are available (Chave et al. Citation2005; Chave et al. Citation2009; Chave et al. 2006; Chave et al. Citation2014). The Intergovernmental Panel on Climate Change (IPCC) divided these approaches into three categories depending on their reliability: Tier 1 relies on unreliable generalized models and defaults, but Tiers 2 and 3 combine country-specific datasets acquired from fieldwork with remote sensing and are considered more dependable (Paustian et al. Citation2006). Legacy inventories and field surveys have been utilized extensively to measure carbon stocks in forests using allometric models (Chave et al. Citation2005; Chave et al. Citation2009; Chave et al. Citation2006; Chave et al. Citation2014). Furthermore, remote sensing provided an unparalleled technique for gaining a deeper understanding of general forest dynamics and quantitatively and qualitatively estimating crucial forest components (Ciesielski and Sterenczak Citation2019; Hussin and Bijker Citation2000). Advances in technology have improved flying platforms and onboard sensors even further (Ciesielski and Sterenczak Citation2019; Sothe et al. Citation2019). Unmanned Aerial Vehicles (UAVs) are less expensive to operate than traditional aerial platforms, and active and passive sensors such as Lidar systems, multispectral cameras, and optical cameras are now available for UAVs. They deliver consistent data gathering and long-term usability ((Dawson et al. Citation2017; Franklin et al. Citation2017; Iglhaut et al. Citation2019; Leberl et al. Citation2010; Pande-Chhetri et al. Citation2017; Sothe et al. Citation2019; Xu et al. Citation2020)). Surprisingly, while Lidar systems remain the most accurate for estimating biophysical and carbon stock in forests, their high collection costs make widespread application difficult (Fritz et al. Citation2013; Gonzalez et al. Citation2010; Kuželka et al. Citation2020; Lefsky et al. Citation2002; Ye et al. Citation2019). Furthermore, machine learning methods have enhanced the quality of Structure from Motion (SfM) outputs dramatically (Fritz et al. Citation2013; Kuželka et al. Citation2020; Ye et al. Citation2019).
For remotely sensed data with very high spatial resolution, the Object-Oriented Classification approach is a good fit. In forest structural assessment, the capacity to properly identify and define the reflectance of various characteristics stored in a pixel is invaluable. Foliage colour, textures, and crown shapes are key factors that differentiate forest tree species, and these differences are caused by variations in reflectance, branching characteristics, and crown growth geometry. Aerial photography and digital line-scanner sensors have been used for the interpretation of tree species through the analysis of these factors, and trained photo interpreters can visually identify many individual tree species with high accuracy (Onishi and Ise Citation2021; Wu and Zhang Citation2020). Tree crowns in closed tropical forests may be defined with this technique, and carbon stock estimations for individual trees can be calculated ((Laliberte and Rango Citation2009; Pande-Chhetri et al. Citation2017)). Previous research employed a completely different method to estimate the carbon stock in the study area ((Fernandes et al. Citation2020; Moe et al. Citation2020; Tahar et al. Citation2021).For example, Adekunle (Citation2006) used only allometric models from forest inventory data to arrive at an average carbon stock estimate of 101 tonnes per hectare. Using a Normalized Differential Fractional Index (NDFI) approach, Adepoju and Salami (Citation2017) calculated a carbon stock estimate range of 1 to 200 tonnes per acre. REDD + Monitoring, Reporting, and Verification (MRV) programs in Nigeria face a problem due to a lack of understanding of the biophysical structure of the country’s tropical forests. Previous remote sensing discoveries in the study area relied on low-to medium-resolution optical remotely sensed data, which had various levels of success (Adepoju and Salami Citation2017; Orimoogunje Citation2014; Oyinloye and Oloukoi Citation2012). Cloud cover may have influenced the results of such investigations (Adepoju and Salami Citation2017). The paper compares two different methods for analyzing multispectral remote sensing data from UAVs in order to estimate carbon stocks and characterize tree species composition in the evergreen lowland rainforest of Southwestern Nigeria. The first method was pixel-based classification, which involved analyzing individual pixels within the images to identify and classify different types of vegetation. The second methodwas object-based classification, which involved analyzing entire objects within the images (e.g. individual trees) to identify and classify different types of vegetation. The goal of the study was to determine which method was more effective for estimating carbon stocks and characterizing tree species composition in this particular region. The findings of the study will be important for forest resources management and monitoring, reporting, and verification (MRV) projects. The study focused specifically on the use of UAV-based multispectral remote sensing data, which allowed for high-resolution imaging of forested areas. This technology has the potential to provide more accurate and detailed information than traditional methods of forest inventory and monitoring.
2. Materials and methods
2.1. Study area
The Omo Forest Reserve is situated in Nigeria and located between latitudes 4° 12'31.41" and 4° 42'55.82" east and latitudes 7° 1'7.67" and 6° 44'58.52" north. The Queen Elizabeth Forest and the Biosphere Reserve, two contiguous forest reserves in Ogun State, make up the forest reserve, which was created in 1925. (Onyekwelu, Mosandl, & Stimm, Citation2008). The Forest Reserve, along with Oluwa, Shasha, Ife, and Ago-Owu Forest Reserves, was a united unit prior to the foundation of Nigeria’s state administration (Isichei Citation1995; Oates et al. Citation2003)). 640 hectares (1,600 acres) in the reserve’s center have been declared as a rigorous nature reserve; as a result, this area has been designated as a UNESCO Biosphere Reserve (https://en.wikipedia.org/wiki/Omo Forest Reserve#cite note-Ojo-1).
Temperatures in the Omo woodland reserves ranged from 25 °C to 31 °C, while rainfall varied from 10.30 mm to 1,029.70 mm. The ecosystem is categorized as tropical since the soil is a blend of ferrallic and ferruginous soil. Omo Forest Reserve has a mixed moist semi-deciduous rainforest type of vegetation. This can be divided into a wet evergreen forest in the south and a dry evergreen mixed deciduous forest in the north.
The topography varies greatly, ranging from virtually flat to hilly. The main river that runs through the sites, the River Omo, is well-drained into its watershed by about 80% of the sites. Numerous small hills dot the landscape, which is uneven and traversed by tributaries of the Omo, Shasha, and Oluwa Rivers. Geological events in the past have been blamed for this unevenness. Previously, the region was made up of sedimentary rocks of variable coarseness, most likely sandstone. Araceae, Compositae, Ebenaceae, Lilliaceae, Papilionoideae, Poaceae, Rubiaceae, and Violaceae are the plant families having the greatest number of individuals. Diospyros spp., Drypetes spp., Strombosia pustulata, Rinorea dentata, and Voacanga africana are some of the most common tree species (Lo Citation2006).
2.2. Sampling method
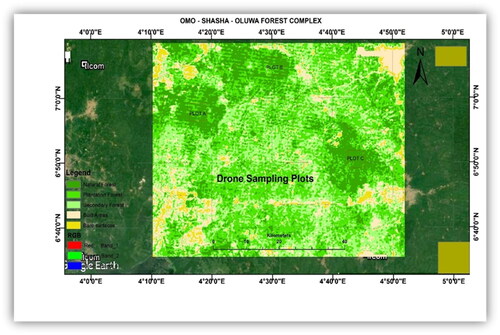
The sampling plots were chosen using a stratified random sampling technique. Using the Iso Cluster Unsupervised algorithm, a sampling grid with 0.5 km by 0.5 km dimensions was superimposed on a land-use thematic map layer of World View 1 data from GoogleEarth, and a representative plot with the highest ‘NDVI’ in the forest reserve was delineated (). During fieldwork, tree inventory was carried out where tree diameter at breast height and tree crown diameter were performed. Statistical analysis was carried out on the environmental variables to estimate the Crown per Unit Area(CPA) and carbon stock.
Figure 1. Map of the study area.
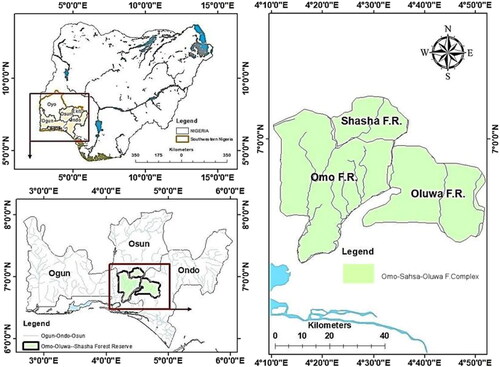
Figure 2. Drone sampling plots derived from Unsupervised Classification of Worldview 1 imagery.
2.3. Photogrammetric data
Geometrically corrected digital aerial photographs with high spatial resolution were captured above the canopy along the flight path with an altitude of 500 m above take-off point using Canon Power Shot S110 (Red, Gren, NIR) (f = 4.3 – 86 mm), 18.2 (MP) mounted on Sense fly E-Bee, Unmanned Aerial Vehicle (UAV). Using emotion 2 for flight planning monitoring and control in the field (), overlapping aerial photographs were captured for all sorties at 10 am to reduce errors due to shadow on the photographs. A total of six ground control points were established to improve accuracy and validation using the Real -Time Kinematic (RTK) methods. The RTK technology works by comparing the GPS signals received by the RTK device with the signals received by the base station, which is precisely located and has a known position. The RTK device then uses this information to calculate its own position, taking into account any errors in the GPS signals.
2.4. Aerial photographs processing
The collected overlapping aerial photographs were processed using Pix4D Mapper geoprocessing software. Based on the Structure from Motion (SfM) algorithm, Pix4D was able to merge the aerial photographs to produce a digital surface model, orthomosaics, and point clouds. A total of 63 out of 82 images were calibrated which is accounts for 76% of all the images with a median of 2127.55 matches per calibrated image. For absolute camera position and orientation uncertainties, kappa indices of 0.035 were observed. The processing report was presented in with minimal root mean square errors. Orthomosaics in false color composites () and point clouds were the final products of the SfM method.
Table 1. Flight characteristics, and image quality parameters derived from Structure for Motion (SfM).
2.5. Object-based image analysis (OBIA)
Within the sampled plots, OBIA's rule-based methodology recognized individual tree crowns, carbon stocks held per tree, and species diversity. Image processing and enhancement; image partitioning into more or less homogeneous objects representing individual tree canopies; and carbon modeling and application of the model to the tree canopy are all processes in the process of calculating carbon stocks. For picture segmentation, the Multi-Resolution Segmentation approach () was applied (Chen and Hay Citation2011) using Ecognition Developer 9. The trees were divided into parts based on their crowns, which were the only homogenous feature. Following segmentation, shadows from genuine trees were masked out using threshold brightness identification, which discriminated real trees with higher brightness values from unwanted segments, which were removed. The Watershed Transformation methods were employed to refine the segmented trees (Chen and Hay Citation2011)). The morphological technique was utilized to smooth down the edges of the tree crown boundary lines. The unrealistically segmented crowns less than 2 meters in diameter were removed, as they are unlikely to be actual trees due to low reflectivity and carbon stock levels (Chen and Hay Citation2011)). To reclassify segmented pictures, the Nearest Neighbour Classification was utilized ((Kumar et al. Citation2015)). The Nearest Neighbour classifier identified image objects by comparing their feature properties to the given examples, using samples of image objects from each class’s training samples. The topological and geometrical correlations were used to validate the image segmentation result.
2.6. Calculation of carbon stocks per tree
The biophysical parameters collected during the fieldwork, such as dbh, height, and species information were imported into ArcMap using the geographic coordinates. These datasets were overlaid on the result of the OBIA. Using each biophysical parameter each image object (segmented as tree crowns) was converted to Crown Per-unit Area (CPA) by calculating the geometry of the segmented trees, represented as polygons in ArcMap. The attribute table of the layer was populated using the raster calculator in ArcMap 10.7 to derive the carbon stock estimates (Chave et al. Citation2014).
3. Results and discussion
3.1. Tree CPA, diameter, carbon-stock estimates, and species distribution
A total of 61 tree species belonging to 21 families were enumerated in the sampled plot. Tree species CPA and diameter ranged from 810 m2, 1.73 m2 (Milicia excelsa) in (Moraceae family) to 133 m2, 0.35 m2 (Sterculia rhinopetala in Sterculiaceae family) . Generally, the families with very large CPA and tree diameter are Moraceae, Malvaceae, and Rubiaceae ().
The species map also highlighted the distribution of tree species within the sampled plot. Carbon stock estimations within the plot () ranged from 65 kg/tree to 8,488 kg/tree, with a total estimate of 450 tonnes per hectare in the sampled plot. The species distribution on the map correlated with the statistical analysis’ distribution result (). The tree diameter and CPA had a positive correlation, according to Pearson’s correlation matrix ().
Table 2. Pearson Correlation matrix showing the strength of association between the biophysical variables and location.
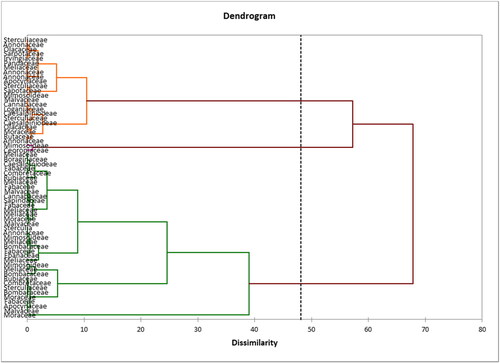
A projection of tree diameter, tree crowns, and positions in the sampled space was shown in the correlation circle (). It also revealed a positive relationship between tree crowns and tree diameters. This, on the other hand, has no relationship with the tree species’ distribution pattern. In conjunction with segmented crowns and tree species mapping (), the data revealed substantial variability and species variety. Furthermore, the findings revealed a positive relationship between tree diameter and CPA. 's horizontal and vertical axes revealed that 44 percent and 26 percent of the 61 tree species were represented in the correlation distribution, respectively. The location of the species, on the other hand, has no relationship on tree diameter or CPA ( and ). shows tree species with huge crown sizes and diameters distributed across a two-dimensional region. While tree species are not frequently connected with location and topography, a few tree species exhibit a relationship between their locations and biophysical features, according to the biplot (). Tree canopies and stem diameter were smaller in the species below the axis. The dendrogram showed species variability better (). It revealed three separate tree family groups. The first groupings began with the Sterculaceae and Rutaceae families, and the second began with the Annonaceae and Ceoropiaceae families. The Meliaceae family was the first to be grouped, followed by the Moraceae family. In the sampled plot, this last group had the most tree species. Furthermore, the first two groups are more homogeneous and closely related in the sampled space than the last groupings, according to the findings.
Figure 3. Flight planning of the study area in e-Motion software for the Sensefly Ebee Unmanned Aerial Vehicle (UAV).
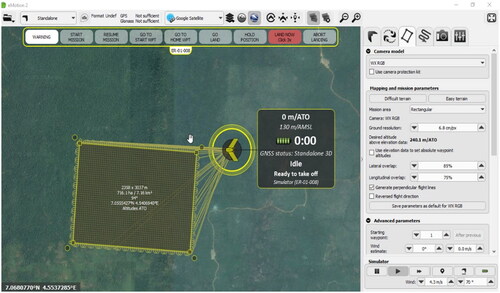
Figure 4. Orthomosaics in False Color Composite and different stages of segmentation to obtain the final tree canopies.
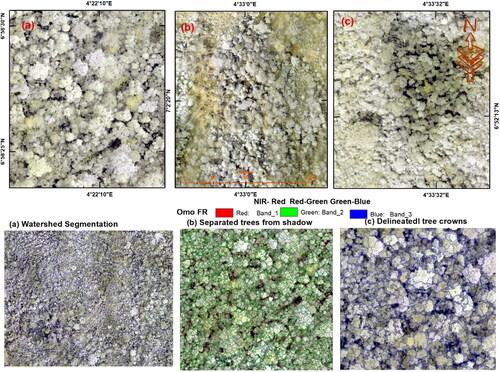
Figure 5. The distribution and tree crown characteristics in the sampled plot.
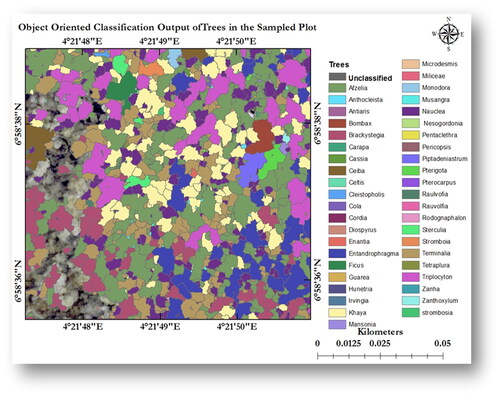
Figure 6. Carbon stock estimates of individual trees in kilograms in the sampled plot.
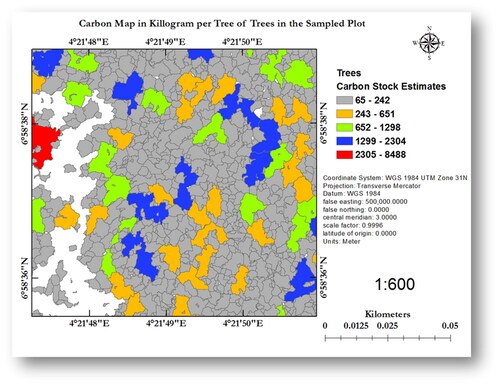
Figure 7. Relationships between the variables within the Principal Component Sampled Space.
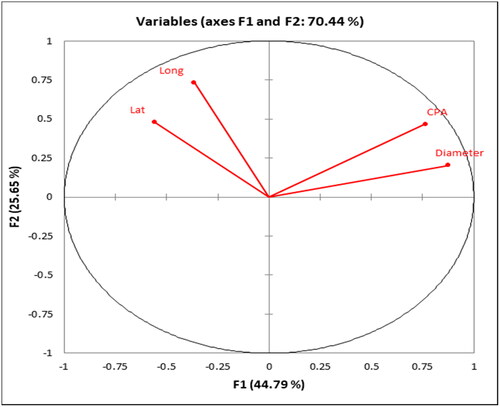
Figure 8. Observed variables in 2-dimensional sampled space of Principal Component Analysis.
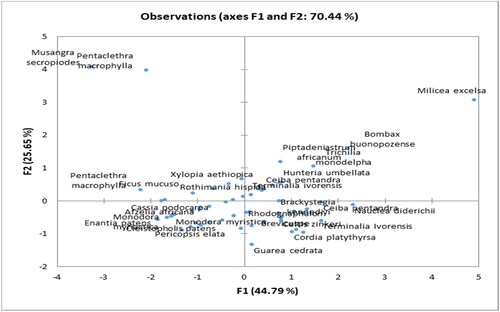
Figure 9. Biplot relationship and directions of biophysical variables to location and topography.
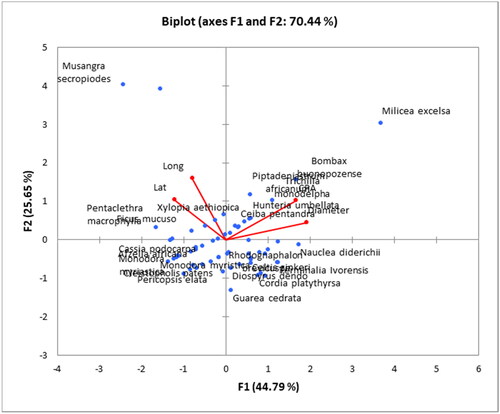
Figure 10. Distribution between tree crown and stem diameter.
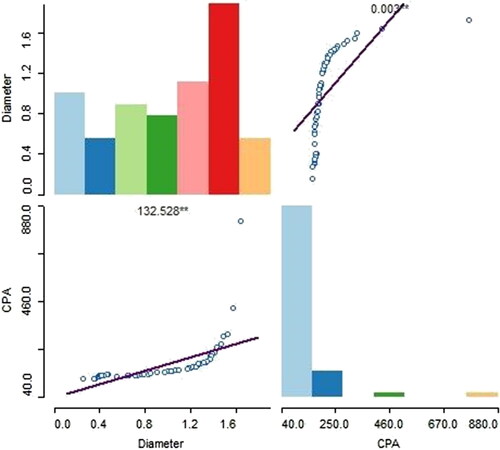
Figure 11. Groupings and variations of tree families within the sampled plot.
Individual tree classification was used to capture the structural aspects of the forest. The light interactions among the different strata of the forest were explained by the compact tree crowns generating vast contiguous zones of the forest estate. According to (Théry Citation2001), the most significant variable component in the forest is light sifting through the crown holes of the trees that make up the emergent layer because it impacts photosynthesis, plant morphology, visual communication, and the effectiveness of plant-animal interactions. Biodiversity is influenced by vegetation geometry, which includes physiological, morphological, and genetic elements that create forest structure. Through the absorption of radiation and cooling via evapotranspiration, the forest affects the micro-ecological conditions that plants and animals rely on (Brockerhoff et al. Citation2017)). Some tree species have larger crowns than others, and tree diameter has a strong association with crown size. The tree within the sampled space, on the other hand, has no association with stem diameter or tree crown. In general, geography and species distribution may be insufficient to predict morphological correlations between tree crown size and stem diameter (Pretzsch et al. Citation2015)).
One of the key services provided by tropical forests is biomass and carbon sequestration ((Adekunle et al. Citation2013; Yusuf et al. Citation2019). With a classification accuracy of 98.65, the object-oriented classification correctly identified 92.5 percent of the two-hectare sampled area. Because of the high resolution of the images (10 cm per pixel) and the homogeneity of the land class, which was predominantly cored forest regions, the high percentage of correctness was expected (Jayathunga et al. Citation2020; Pande-Chhetri et al. Citation2017; Sothe et al. Citation2019). The object-oriented categorization approach estimated a carbon store of 450 tonnes per hectare. This value was higher than previous carbon stock estimates in the study site based on literature, the advantage of the high-resolution point cloud in combination with the SFM technique for image matching and creation could have resulted in higher carbon stock estimates. The Estimation of Scale Parameter (ESP) using the ESP tool significantly reduced user-produced errors during segmentation that occur in the process of selection of reliable scale parameters which ultimately affect the accurate delineation of tree crowns. Tree species distribution patterns revealed a strong ecological network and species biodiversity. The species variations at the landscape level of the different families existing together showed a distinct relationship that characterizes the forest structure. The species occurrence within the sampled space indicated that topography has no impact on tree growth. The GPS coordinates of the sampled species showed a weak correlation with growth parameters. This is in line with some regional findings in the tropics (de Souza etal.,2014; Zeng etal,2017)
4. Conclusion
In summary, high-resolution orthomosaic data and object-oriented classification techniques add dimension to a better understanding of the structure and species diversity of tropical forests. The study found that this approach allowed them to accurately estimate carbon stocks while also providing detailed information on the complex interactions between tree crowns and light availability, which are important drivers of forest ecology.
The Object-oriented classification method of image analysis involves grouping pixels into objects based on their spatial and spectral characteristics. This approach can be particularly useful for analyzing high-resolution imagery of complex environments, such as forests because it allows for the differentiation of individual trees and other forest features. By using object-oriented classification to analyze orthomosaic data, the study was able to characterize the structure and species diversity of the forest in greater detail than would have been possible with traditional field-based methods.
Overall, the study suggests that high-resolution orthomosaic data and object-oriented classification techniques can be powerful tools for assessing forest structure and species diversity, as well as for estimating carbon stocks in tropical forests. These findings could have important implications for forest management and conservation efforts, as well as for our understanding of the complex ecological interactions that underpin forest ecosystems
When used for field validation in closed forests with large canopies, this method can supplement field measurements. Furthermore, the OBIA methodology can be used to validate other methodologies that leverage remotely sensed datasets for wall-to-wall mapping and large-scale monitoring and reporting projects.
Acknowledgement
We are grateful to the Government of Ogun State, Nigeria for granting us the opportunity to use Omo forest for this study.
Disclosure statement
No potential conflict of interest was reported by the authors.
References
- Abbasi UA, Mattsson E, Nissanka SP, Ali A. 2022. Biological, structural and functional responses of tropical forests to environmental factors. Biol Conserv. 276:109792.
- Adekunle VAJ. 2006. Conservation of tree species diversity in tropical rainforest ecosystem of South-West Nigeria. J Trop for Sci. 18:91–101.
- Adekunle VAJ, Olagoke A, Akindele S. 2013. Tree species diversity and structure of a Nigerian strict nature reserve. Trop Ecol. 54:275–288.
- Adepoju K, Salami A. 2017. Geospatial assessment of forest fragmentation and its implications for ecological processes in tropical forests. J Landsc Ecol. 10:19–34.
- Baccini A, Goetz SJ, Walker WA, Laporte N, Sun M, Sulla-Menashe D, Hackler JL, Beck P, Dubayah R, Friedl M, Samanta S, Houghton RA. 2012. Estimated carbon dioxide emissions from tropical deforestation improved by carbon-density maps. Nat Clim Change. 2(3):182–185.
- Brockerhoff EG, Barbaro L, Castagneyrol B, Forrester DI, Gardiner B, González-Olabarria JR, Lyver PO, Meurisse N, Oxbrough A, Taki H, Thompson IM, Van Der Plas F, Jactel H. 2017. Forest biodiversity, ecosystem functioning and the provision of ecosystem services. Biodiv Conserv. 26(13):3005–3035.
- Buragohain MK, Dar AA, Babu KN, Parthasarathy N. 2023. Tree community structure, carbon stocks and regeneration status of disturbed lowland tropical rain forests of Assam, India. Trees For People. 11:100371.
- Chave J, Andalo C, Brown S, Cairns MA, Chambers JQ, Eamus D, Fölster H, Fromard F, Higuchi N, Kira T, et al. 2005. Tree allometry and improved estimation of carbon stocks and balance in tropical forests. Oecologia. 145(1):87–99.
- Chave J, Coomes DA, Jansen S, Lewis SL, Swenson NG, Zanne AE. 2009. Towards a worldwide wood economics spectrum. Ecol Lett. 12(4):351–366.
- Chave J, Muller-Landau HC, Baker TR, Easdale TA, Steege H, Webb CO. 2006. Regional and phylogenetic variation of wood density across 2456 neotropical trees species. Ecol Appl. 16:2356–2367.2.0.co;2] [17205910]
- Chave J, Réjou-Méchain M, Búrquez A, Chidumayo E, Colgan MS, Delitti WBC, Duque A, Eid T, Fearnside PM, Goodman RC, et al. 2014. Improved allometric models to estimate the aboveground biomass of tropical trees. Glob Chang Biol. 20(10):3177–3190.
- Chen G, Hay G. 2011. An airborne lidar sampling strategy to model forest canopy height from Quickbird imagery and GEOBIA. Remote Sens Environ. 115:1532–1542.
- Ciesielski M, Sterenczak K. 2019. Accuracy of determining specific parameters of the urban forest using remote sensing. iForest – Biogeoscid For. 12(6):498–510.
- Dawson SM, Bowman MHE, Leunissen E, Sirguey P. 2017. Inexpensive aerial photogrammetry for studies of whales and large marine animals. Front Mar Sci. 4:466.
- Fernandes MR, Aguiar FC, Martins MJ, Rico N, Ferreira MT, Correia AC. 2020. Carbon stock estimations in a Mediterranean Riparian forest: a case study combining field data and UAV imagery. Forests. 11(4):376.
- Franklin SE, Ahmed OS, Williams G. 2017. Northern conifer forest species classification using multispectral data acquired from an unmanned aerial vehicle. Photogramm Eng Remote Sens. 83(7):501–507.
- Fritz A, Kattenborn T, Koch B. 2013. UAV-based photogrammetric point clouds – tree STEM mapping in open stands in comparison to terrestrial laser scanner point clouds. ISPRS - Int Arch Photogramm Remote Sens Spat Inf Sci. XL1:141.
- Gonzalez P, Asner GP, Battles JJ, Lefsky MA, Waring KM, Palace M. 2010. Forest carbon densities and uncertainties from Lidar, QuickBird, and field measurements in California. Remote Sens Environ. 114(7):1561–1575.
- Hussin Y, Bijker W. 2000. Inventory of remote sensing applications in forestry for sustainable management. Paper presented at: IISPRS 2000 congress. Geoinformation for all : Amsterdam, the Netherlands, 16–23 July, 2000. part B7 pp. 575-587, Amsterdam, The Netherlands.
- Iglhaut J, Cabo C, Puliti S, Piermattei L, O’Connor J, Rosette J. 2019. Structure from motion photogrammetry in forestry: a review. Curr For Rep. 5(3):155–168.
- Isichei OA. 1995. Omo biosphere reserve, current status, utilisation of biological resources and sustainable management.
- Jayathunga S, Owari T, Tsuyuki S, Hirata Y. 2020. Potential of UAV photogrammetry for characterization of forest canopy structure in uneven-aged mixed conifer–broadleaf forests. Int J Remote Sens. 41(1):53–73.
- Kumar L, Sinha P, Taylor S, Alqurashi A. 2015. Review of the use of remote sensing for biomass estimation to support renewable energy generation. J Appl Remote Sens. 9(1):097696.
- Kuželka K, Slavík M, Surový P. 2020. Very high density point clouds from UAV laser scanning for automatic tree stem detection and direct diameter measurement. Remote Sens. 12:1236.
- Laliberte A, Rango A. 2009. Texture and scale in object-based analysis of subdecimeter resolution unmanned aerial vehicle (UAV) imagery. IEEE Trans Geosci Remote Sens. 47:761–770.
- Leberl F, Irschara A, Pock T, Meixner P, Gruber M, Scholz S, Wiechert A. 2010. Point clouds. Photogramm Eng Remote Sens. 76(10):1123–1134.
- Lefsky MA, Cohen WB, Harding DJ, Parker GG, Acker SA, Gower ST. 2002. Lidar remote sensing of above-ground biomass in three biomes. Global Ecol Biogeogr. 11(5):393–399.
- Lo O. 2006. The fate of a tropical rainforest in Nigeria: Abeku sector of Omo forest reserve.
- Moe KT, Owari T, Furuya N, Hiroshima T, Morimoto J. 2020. Application of UAV photogrammetry with LiDAR data to facilitate the estimation of tree locations and DBH values for high-value timber species in northern Japanese mixed-wood forests. Remote Sens. 12(17):2865.
- Oates JF, Dunn A, Greengrass E, Morgan BJ. 2003. Pan troglodytes sp. Ellioti. (Version 2.2). Retrieved 2012, from IUCN
- Onishi M, Ise T. 2021. Explainable identification and mapping of trees using UAV RGB image and deep learning. Sci Rep. 11(1):903.
- Onyekwelu JC, Mosandl R, Stimm B. 2008. Tree species diversity and soil status of primary and degraded tropical rainforest ecosystems in southwestern Nigeria. J Trop Forest Sci. 20:193–204.
- Orimoogunje O. 2014. Forest cover changes and land use dynamics in Oluwa forest reserve, southwestern Nigeria. J Landsc Ecol. 7:25–44.
- Oyinloye RO, Oloukoi J. 2012. Spatio temporal assessment and mapping of the landuse landcover dynamics in the central forest belt of southwestern Nigeria. Res J Environ Earth Sci. 4(7):720–730.
- Pan Y, Birdsey RA, Fang J, Houghton RA, Kauppi PE, Kurz WA, Phillips OL, Shvidenko A, Lewis SJ, Peñuelas J, Ciais P, Jackson RB, Pacala SW, McGuire AD, Piao S, Rautiainen A, Sitch S, Hayes DF. 2011. A large and persistent carbon sink in the world’s forests. Science. 333(6045):988–993.
- Pande-Chhetri R, Abd-Elrahman A, Liu T, Morton J, Wilhelm VL. 2017. Object-based classification of wetland vegetation using very high-resolution unmanned air system imagery. Eur J Remote Sens. 50(1):564–576.
- Paustian K, Ravindranath NH, van Amstel AR. 2006. 2006 IPCC Guidelines for National Greenhouse Gas Inventories. (Volume 4: Agriculture, forestry and other land use; No. Part 2).
- Pretzsch H, Biber P, Uhl E, Dahlhausen J, Rötzer T, Caldentey J, Koike T, Van Con T, Chavanne A, Seifert T, Du Toit B, Farnden C, Pauleit S. 2015. Crown size and growing space requirement of common tree species in urban centres, parks, and forests. Urban Forest Urban Green. 14(3):466–479.
- Price B, Waser LT, Wang Z, Marty M, Ginzler C, Zellweger F. 2020. Predicting biomass dynamics at the national extent from digital aerial photogrammetry. Int J Appl Earth Obs Geoinf. 90:102116.
- Sothe C, Dalponte M, De Almeida CM, Schimalski MB, Lima C, Liesenberg V, Miyoshi GT, Tommaselli AMG. 2019. Tree species classification in a highly diverse subtropical forest integrating UAV-based photogrammetric point cloud and hyperspectral data. Remote Sens. 11(11):1338.
- Tahar KN, Asmadin MA, Sulaiman SAH, Khalid N, Idris AN, Razali MH. 2021. Individual tree crown detection using UAV Orthomosaic. Eng Technol Appl Sci Res. 11(2):7047–7053.
- Tahar KN, Asmadin MA, Sulaiman SAH, Khalid N, Idris AN, Razali MH. 2021. Individual tree crown detection using UAV orthomosaic. Eng Technol Appl Sci Res. 11(2):7047–7053.
- Théry M. 2001. Forest light and its influence on habitat selection. Plant Ecol. 153(1):251–261.
- Wu Y, Zhang X. 2020. Object-based tree species classification using airborne hyperspectral images and LiDAR data. Forests. 11(1):32.
- Xu Z, Shen X, Cao L, Coops NC, Goodbody TR, Zhong T, Zhao W, Sun Q, Ba S, Zhang Z, Wu X. 2020. Tree species classification using UAS-based digital aerial photogrammetry point clouds and multispectral imageries in subtropical natural forests. Int J Appl Earth Observ Geoinform. 92:102173. 10.1016/j.jag.2020.102173
- Ye N, van Leeuwen L, Nyktas P. 2019. Analysing the potential of UAV point cloud as input in quantitative structure modelling for assessment of woody biomass of single trees. Int J Appl Earth Obs Geoinf. 81:47.
- Yusuf H, Oludipe J, Adeoye O, Olorunfemi I. 2019. Carbon stocks in aboveground and belowground biomass of sub-humid tropical forest in Southwestern Nigeria. Open Access Library J. 6:1–12.