
 ?Mathematical formulae have been encoded as MathML and are displayed in this HTML version using MathJax in order to improve their display. Uncheck the box to turn MathJax off. This feature requires Javascript. Click on a formula to zoom.
Abstract
Understanding the dynamics of flooding events is crucial to mitigate flood risks, particularly in developing nations like Sudan. This study combines multi-sensor approaches with Rainfall-Runoff-Inundation (RRI) modeling to predict flood inundation extent over the Nile River Basin (NRB). Building upon the RRI model, we firstly simulated the streamflow over the Blue Nile basin and the White Nile basin. Our results show a good agreement between the observed and the simulated streamflow at both daily and monthly scales, e.g. NSE = 0.72 and R2 = 0.85 for daily simulations at Khartoum station. Further, we compared the inundation extents from the RRI model with derived inundation maps from different satellite images (Sentinel-1, Sentinel-2, Landsat-8, and MODIS). The results indicate the potential to overcome the limitation of data scarcity in developing regions and hence provide a supportive assessment tool for flood risk maps in the NRB.
Graphical Abstract

Keywords:
1. Introduction
Flood is one of the most harmful natural hazards worldwide that has a detrimental effect on human life and socio-economic. Recently, extreme flood events have occurred more frequently, resulting in colossal damage in several regions of the world (Chau Citation2017; Gelete et al. Citation2020). According to the Centre for Research on the Epidemiology of Disasters (CRED), flood events in 2019 were accountable for around 49% of global natural catastrophes, leading to the death of 43% of people among the total casualties of this year and hurting 33% people of the total number of affected people (CRED Citation2020). However, in 2020, the annual average of flood events increased from 163 to 201 by up to 23% with an increase of up to 18% of the yearly average of deaths which is 5,233 deaths, see Figure S1(a). For the same year 2020, floods in Africa harmed 7 million people and killed more than 1200 people, the highest number of deaths since 2006 (CRED and UNDRR Citation2021). Sudan is considered a flood-prone country inside the African continent, as displayed in Figure S1(b) (Li et al. Citation2016). In 2020, Sudan saw heavy and continuous rainfall, causing a catastrophic flood event.
Figure 1. (a) the location of the two subbasins (the BNB and the White Nile basin) of the NRB and the streamflow stations (b) the location of Sudan and the damage and losses of their states caused by the flood event of 2020 (modified from (UNOCHA (United Nations Office for the Coordination of Humanitarian Affairs) Citation2020)).
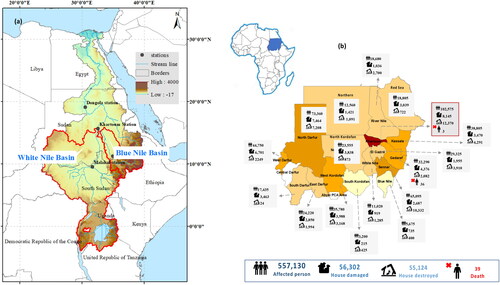
Consequently, thousands of people in 17 states (out of 18 states in Sudan) were affected during the rainy season from July to September 2020. Khartoum state, the capital of Sudan, is the joint of the main tributaries of the Nile River: The Blue Nile River and the White Nile River, which has been one of the most affected by the 2020 flooding event. Therefore, understanding the flooding phenomena and their consequences is necessary to mitigate and reduce the damages caused by devastating flood events, particularly in developing nations like Sudan. Besides, the early flood prediction will help the decision-maker evacuate inhabitants from regions where harm is imminent. However, data availability is a significant challenge that researchers in developing countries typically face.
Remote sensing data have become an alternative tool for hydrological modeling, and flood inundation mapping, particularly in either limited-gauged or ungauged regions. A consensus among space agencies to increase flood monitoring from space has emerged over the past two decades as a result of growing knowledge of the potential for remote sensing techniques to monitor floods and so alleviate some of the field data restrictions (Grimaldi et al. Citation2016). These remote sensing data will bridge the gap of the shortage of data availability in flood inundation mapping. In addition, this increasing availability of data has prompted growing efforts to better understand how remote sensing might improve flood modeling (Mason et al. Citation2010). To date, remote sensing data provides good information on flooding areal extents with comprehensive coverage and multi-temporal resolution (Khan et al. Citation2011). However, the frequency of such sensors falls to assess the flood and cover the spatio-temporal for a specific region (Rosser et al. Citation2017). For instance, the Moderate Resolution Imaging Spectroradiometer (MODIS) of the National Aeronautics and Space Administration (NASA) offers reliable data to monitor floods in areas where no other means of flood monitoring are available (Khan et al. Citation2011).
On the contrary, Landsat 8 provides multispectral data with a spatial resolution of 30 meters. Yet, urban and semi-urban areas might have some characteristics that affect floodwater movement and presence within this cell-size (Rosser et al. Citation2017). This implies that remote sensing data are subjected to such uncertainty issues and substantial biases. Hence, multi-sensors are employed in this study, including Sentinel-1, Sentinel-2, Landsat-8, and MODIS for flood inundation mapping. One of the challenges is monitoring floods during the rainy season, especially in a tropical zone like Sudan (Tam et al. Citation2019). However, flood models provide the optimum solution by assessing the current flood inundation situation based on the spatially distributed, multi-temporal rainfall data. Therefore, Climate Hazards Group InfraRed Precipitation with Station data (CHIRPS) (Funk et al. Citation2015) was used as an alternative input of precipitation due to the shortage of observed rain gauges that relies on essential information to derive the rainfall-runoff model.
Some methods have been widely employed to simulate flood inundation and streamflow discharge, including statistical methods, empirical techniques, and rainfall-runoff models (Try et al. Citation2018). Additionally, numerous efforts have used hydrodynamic models, e.g. (Bellos and Tsakiris Citation2016; Bellos et al. Citation2020; David and Schmalz Citation2020; Ming et al. Citation2020; Costabile et al. Citation2021; Costabile and Costanzo Citation2021). Such models can aid in understanding the flood dynamics by providing a reasonable prediction of flood risk, including the areal extent of flood and floodwater depth. However, hydrodynamic models are limited by several constraints that can hinder their applicability. For instance, data availability limitation is predominately challenging applications in data-scarce regions as in the African countries, and the Middle East, and North Africa (MENA) region. In addition, according to (Afshari et al. Citation2018), the majority of hydraulic/hydrodynamic models require significant geographic features, such as cross-sections of the channel and the floodplain, or the ideal parameter values, which are usually difficult to obtain. Further, many studies highlighted the computational constraint of hydrodynamic models that limits the application of hydrodynamic models in large-scale watersheds, e.g. (Teng et al. Citation2017; Bellos et al. Citation2020; Ming et al. Citation2020). (Teng et al. Citation2017) reported that the 2D and 3D hydrodynamic models are often unfeasible for study areas larger than 1000 km2 and thus can’t be used for real-time inundation forecasting due to expensive computational cost (Bhola et al. Citation2018).
On the other hand, the open-source Rainfall Runoff-Inundation (RRI) model has been successfully applied in various regions across the world to predict streamflow and associated flood inundation, particularly in large-scale watersheds with limited data availability, e.g. (Bhagabati and Kawasaki Citation2017; Abdrabo et al. Citation2020; San et al. Citation2020; Saber et al. Citation2022). The RRI model provides a monitoring tool to the flooding events in terms of simulated discharge, water depths, and flood inundation maps. Therefore, we here present a framework that integrates freely available remote sensing observations (e.g. Landsat and Sentinel) with open-source flood inundation models (e.g. the RRI model in our study) to overcome the aforementioned constraints of hydrodynamic models.
Numerous studies have been conducted based on the RRI model across various regions, i.e. (Bhagabati and Kawasaki Citation2017; Nastiti et al. Citation2018; Try et al. Citation2018; Tam et al. Citation2019; Try et al. Citation2020). For instance, (Try et al. Citation2018) applied the RRI model using remote sensing precipitation data to predict flood inundation events of 2000 in the Mekong River basin. In addition, the model has revealed a good performance in the prediction of the inundation areas of large-scale basins like the upper Citarum River watershed in Indonesia (Nastiti et al. Citation2018). On the other hand, such different models were used to map the flood inundation in several regions such as MIKE FLOOD, HEC-HMS, and CREST (Patro et al. Citation2009; Khan et al. Citation2011; Bhattacharya et al. Citation2019). Meanwhile, few previous studies have highlighted the flooding hazards in Sudan. For example, (Khairy Citation2020)’s study assessed flood hazard and risk and identified flood-prone areas over the state of Khartoum, Sudan, by analyzing Landsat satellite images for a period of thirty years from 1988 to 2018. However, there are few studies that evaluate the hazards of the 2020 extreme flooding event in Sudan. In addition, we here assess the performance of different satellite observations to delineate flood extent over the studied area.
Significant uncertainty in the hydrological modeling of the White Nile River basin was reported in previous studies; however, the hydrological modeling reveals reasonable performance over the Blue Nile basin (BNB). The White Nile Basin is considered to be one of the most complicated and diverse hydrologic settings on earth according to (Block and Rajagopalan Citation2009). Therefore, the model complexity is due to its significant spatial variations, the rareness of data availability, dysconnectivity, and considerable losses in the swamps regions. As a result, there are limited comprehensive hydrological studies over the White Nile River basin. On the contrary, numerous hydrological modeling studies have been successfully conducted over the BNB, (e.g. (Abd-El Moneim et al. Citation2019; Eldardiry and Hossain Citation2019; Abdelmoneim et al. Citation2020; Eldardiry and Hossain Citation2021; Abdelmoneim et al. Citation2022)). To address this issue, the RRI model is chosen for the hydrologic simulation because it is a 2D distributed model distinguished by simulating the discharge and the flood inundation, which might be the central issue of simulation compared with the other hydrologic model.
The main goal of this study is to combine a multi-sensor approach and rainfall-runoff-inundation modeling to map flood inundation extent over the Nile River basin (NRB) in Sudan. Additionally, we estimate and assess the damages caused in Sudan due to the 2020 extreme flood event. The paper is organized into five sections based on the RRI model, which is applied over the BNB and White Nile basin to achieve this goal. Then, we introduced the study area in section 2. Data sources and methods are summarized in section 3. Section 4 presents the results of the RRI model simulation and MSS approach. Eventually, section 5 displays the conclusions of this research.
2. Study area: Sudan
Sudan is one of the downstream countries of the NRB, which is located in the northeastern part of Africa. Its capital is named Khartoum state, located in the heart of Sudan and covered around 21000 km2 (approximately 0.01% of the entire area of Sudan), see . Despite its smallest size, Khartoum is considered the most popular state among the remaining Sudanese states, with a total population ranging from 6 to 7 million people. The Blue Nile River and the White Nile River meet together in Khartoum, forming the main Nile River. Such location is one of the main reasons that makes Khartoum state vulnerable to fluvial of recurrent flooding (Basheer Citation2021).
Additionally, its flat topography plays a vital role in the damage caused and adds to its humble infrastructure. In recent decades, it has been facing several extreme flooding events that consequently had a detrimental effect on its buildings and lands and its population lives. For example, many losses caused by the flood event of 2013, which reached 499980 people were affected, happened in Khartoum state (UNOCHA (United Nations Office for the Coordination of Humanitarian Affairs) Citation2013). Moreover, it witnessed a significant impact due to the flood event of 2019, affecting around 32060 people. Eventually, the recent devastating flood event of 2020 happened in Sudan, which had acute damage to the constructions, infrastructures, and people’s lives, particularly in Khartoum state. illustrates the losses resulting from the recent flood event of 2020. The RRI model was employed over the two main subbasins of the NRB to assess the damages caused by the extreme flood event over the Khartoum and other severely affected states. Hence, the BNB and the White basin are two main subbasins in the NRB, as shown in .
3. Data and methods
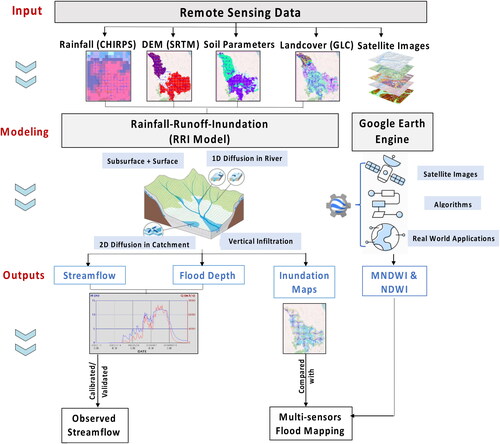
represents the flow chart of the methodological approach that encompasses three steps. First, flood inundation maps are produced using satellite observations; the second one is for the description and the process of the RRI model, and then the simulated results of the RRI model were calibrated and validated with the observed streamflow. Therefore, the last section represents several statistical indices that were used in this study for the evaluation of the model performance. On the other hand, the simulated flood inundation maps of the RRI model were also compared with the estimated maps from the satellite images, as displayed in . These previous steps are described in detail in the following subsections.
Figure 2. flow chart represents the Methodology steps.
3.1. Flood inundation mapping based on satellite images
In the current study, multi-satellite images are used to predict the extreme flood inundation event of 2020. Moreover, these sensors include Sentinel-1, Sentinel-2, MODIS, and Landsat-8, as displayed in . The satellite observations are retrieved and processed through the Google Earth Engine (GEE) platform (https://earthengine.google.org/), as shown in . The GEE is a cloud computing platform, which provides a free geospatial dataset from several agencies with a high-performance computing capability (Patel et al. Citation2015; Gorelick et al. Citation2017; Zurqani et al. Citation2018; Zhou et al. Citation2019). The flood inundation extents are estimated by classifying satellite images using the normalized difference water index (NDWI), as displayed in . Such classification of satellite images was driven based on the normalized difference water index (NDWI) through the difference between the green and near-infrared wavelength values. However, such satellite images used the modified normalized difference water index (MNDWI), which outperforms the results of NDWI in detection water. (Xu Citation2006) also emphasizes that the MNDWI advantage of suppressing the response of both vegetation and built-up areas leads to enhanced water detection for these areas. The NDWI and MNDWI were calculated using the following equations (McFEETERS Citation1996; Xu Citation2006):
(1)
(1)
(2)
(2)
Table 1. Summary of satellite images and reanalysis data used in this study.
3.2. RRI model
The RRI model, which the International Centre developed for Water Hazard and Risk Management (ICHARM), Japan, is a 2D distributed hydrologic model that can simulate the rainfall-runoff and flood inundation simultaneously (Sayama et al. Citation2012). The RRI model’s source codes were developed based on the Fortran 90 computer language. One of its advantages is that the model has been successfully employed to simulate flood inundation in numerous large-scale basins in different regions all over the world (e.g. (Shrestha et al. Citation2016; Perera et al. Citation2017; Tam et al. Citation2019; Try et al. Citation2020)). Such remote sensing data are firstly collected, including, digital elevation model (DEM), precipitation data (CHIRPS), and landcover data (GLCC) to run the model, as shown in . A DEM and the stream network are used as input into the RRI model. The DEM cells serve as a floodplain.
Meanwhile, the stream network is employed to construct the river channel. The model assumes that the river channel is located in the same grid cell as the slope at the stream network cell. The stream is discretized as a single line along its centerline of the overlying slope grid cell. The 2D diffusive wave model is used to calculate the flow across the slope grid cells, while the 1D diffusive wave model is used to compute the flow in the river channel. The RRI model additionally simulates lateral subsurface flow, vertical infiltration flow, and surface flow, which better represents the rainfall-runoff-inundation processes. The lateral subsurface flow, typically more important in mountainous regions, is treated in terms of the discharge-hydraulic gradient relationship, which considers both saturated subsurface and surface flows. Otherwise, the Green-Ampt model is used to estimate the vertical infiltration flow. The flow interaction between the river channel and slope is estimated based on different overflowing formulae, depending on water level and levee-height conditions. The RRI model provides the output of river discharge, river water level, inundation area, and depth simultaneously, see (Try et al. Citation2020).
3.3. Evaluation of the performance
Three continuous statistic metrics are commonly used [e.g. (Yoshimoto and Amarnath Citation2017; Nastiti et al. Citation2018; Try et al. Citation2020)] to evaluate the performance of the RRI model, including a Nash-Sutcliffe efficiency (NSE), coefficient of determination (R2), and percent bias (BIAS). The Nash Sutcliffe efficiency (NSE) was first used to assess the statistical goodness of fit of simulated flows (Abdelmoneim et al. Citation2022). The NSE scale runs from -∞ to 1, with higher numbers suggesting greater agreement (Legates and McCabe, Citation1999). If NSE is less than zero, the model has no ability in predicting the measured (Lakew et al. Citation2017). The coefficient of determination (R2) and percent bias (BIAS) are also used to determine the agreement of simulation outputs versus the measured. Moreover, BIAS is used to investigate the tendency of under- or overestimation of simulated flow (Gilewski and Nawalany Citation2018). These indicators are calculated as follows:
(4)
(4)
(5)
(5)
(6)
(6)
Where Qobs and Qsim are the observed data and simulated results, respectively. Qobs’ and Qsim’ represent their average over the simulation period. The best performance of the four metrics is attained when R2 = 1, BIAS = 0%, and NSE = 1. Also, it is worth to mention the value of BIAS is deemed unsatisfactory if it is larger than 20 percent (Gilewski Citation2021).
Additionally, three categorical statistics metrics are frequently used based on the 2 × 2 contingency table to assess the accuracy of sensors in the detection of flood inundation extent compared with the outputs of RRI model rain. These metrics are included; probability of detection (POD), false-alarm rate (FAR), and critical success index (CSI). POD is used to determine whether flood inundation occurrences are detected correctly. FAR displays that sensors detections were wrongly recorded. In addition, CSI is a grasp indicator that measures the sensors prediction potentiality.
(7)
(7)
(8)
(8)
(9)
(9)
Where H: is the measured in-situ data properly detected (hits), M: is the measured in-situ data failed to detect (misses) as well as F: is the PESPs detected rain even though not observed. The optimum POD, FAR, and CSI values are 1, 0, and 1, respectively.
4. Results and discussion
4.1. The RRI model simulation
The hydrological model (RRI) is individually applied over the BNB and the White Nile basin to assess the model’s performance. CHIRPS product is used as alternative rainfall input to cope with the lack of observed rainfall according to its good performance in the Eastern Nile basin (ENB) is highlighted in (Abdelmoneim et al. Citation2020) 's study. The simulated streamflow forced CHIRPS product was calibrated and validated at the Khartoum station (outlet of the basin) in the BNB daily and monthly timescales. However, the Malakal station in the White basin was only simulated at a monthly time step according to the data available. Therefore, this hydrologic simulation was performed using 1998–2002 and 2003–2006 for the calibration and validation periods, respectively.
shows the comparison between the simulated results and the observed discharge data at the Khartoum station from 1998 to 2006. summarizes the statistical indices of the evaluation performance of the model for both calibration and validation periods at the Khartoum and Malakal stations. As for the Khartoum station, the simulated results reveal a good agreement against the observed discharge data for both timescales. The simulated daily result forced by CHIRPs is reasonable against the monitored discharge at both calibration and validation periods, as displayed in the NSE value of 0.72 and R2 value of 0.85 (see ). The significant improvement in the model performance in the monthly timescales is also noteworthy, as reflected in NSE and R2 values of 0.84, 0.80, and 0.92, 0.91, respectively, for calibration and validation periods.
Figure 3. The hydrograph of simulated results and the observed discharge (a) Khartoum station (daily time scale) (b) Khartoum station (monthly time scale) (c) Malakal station (monthly time scale).
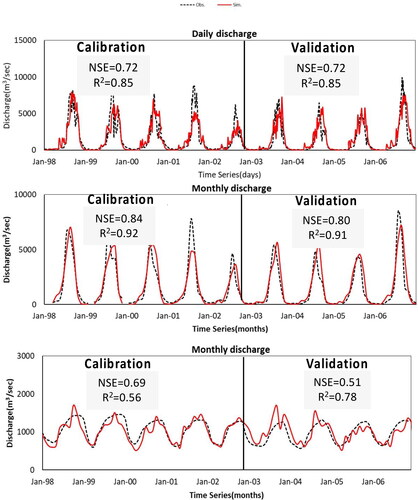
Table 2. Statistical indices for the evaluation of the RRI model’s performance.
As for the White Nile river basin, the RRI model fails to capture the hydrograph well by showing a significant underestimation against the measured discharge (Figure not shown in the study). However, it can capture well the pattern of the hydrograph. This explanation of this limitation might be to these reasons. Firstly, the disconnected extensive area of swamps that represent three regions (Bahr el Jebel, Bahr el Ghazal, and Sobat) plays a vital role in the massive amount of river flow, reaching up to 50% of the river flow. Consequently, the hydrological models couldn’t consider this immense loss, resulting in the significant uncertainty of simulated results. Secondly, the limitation of data is a challenge either due to its accessibility or availability via riparian countries. Hence, the simulated results were adjusted based on the observed data to improve and overcome the remaining restrictions. shows the simulated results compared with the observed discharge. The results reveal a relatively good agreement in both calibration and validation periods, as reflected in NSE and R2 values greater than 0.5 (see ). According to (Moriasi et al. Citation2007), results are still satisfactory that appear NSE value greater than 0.5 referring to the guidelines of watershed modeling evaluation.
4.2. Flood inundation extent
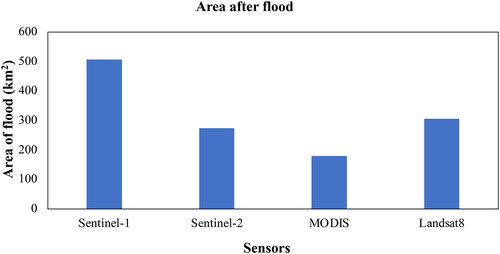
Four sensors were employed over this region to assess the acute damage that happened in Khartoum, including MODIS, Landsat 8, Sentinel-1, and Sentinel-2. The images of the satellite were estimated before and after the flood occurrence. The difference between both results shows the flood extent. illustrates the mapping of the flood inundation extent for each sensor over the Khartoum state, particularly over the junction of the BNB and the White Nile river. Graphically, the four sensors appear similar performance with a slight difference. However, each sensor’s estimated flood inundation areas vary from 200 km2 to 500 km2, as shown in . This variation might be due to the uncertainties of sensors. It is also worth mentioning the flood inundation extent at the White Nile river is greater than at the BNB. (Gelete et al. Citation2020) highlighted that flooding processes are influenced by climatic factors and non-climatic factors, including soil type, slope, and antecedent soil moisture. This implies that the damage at Khartoum state might be due to the soil type and moisture added to its humble infrastructure.
Figure 4. The flood inundation extends maps using four sensors over Khartoum state (a) MODIS (b) Sentinel-1 c) Sentinel-2 d) Landsat 8.
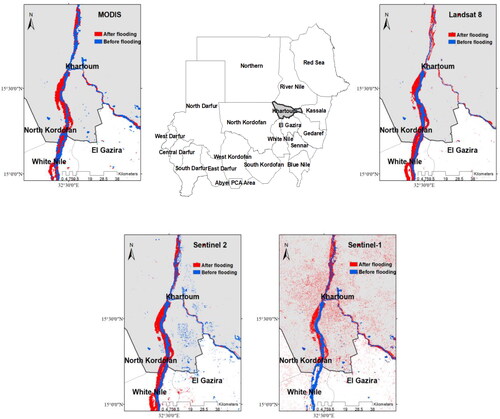
Figure 5. Estimated flood extent by each sensor.
illustrates the mapping of flood inundation extent of two sensors compared with the RRI outputs during the three months of the flood event (July to September) over the most affected states. Four states, including Sennar, White Nile, Gedaref, and Elgezira, are affected after Khartoum. The spatial distribution of flood inundation increases gradually from July until the maximum in September. Three categorical statistical indices (POD, FAR, and CSI) that are frequently applied to assess the performance of each sensor are displayed in . Despite the reasonable values of POD (ranging from 0.5 to 0.82) shown for Sentinel-2; however, it appears high values of FAR and humble values of CSI. Also, a significant overestimation is denoted for months by comparing the results of Sentienl-2 and the RRI outputs. The implication of these uncertainties might be due to the huge areas of wetland in the White Nile River which affect the prediction of the satellite. Overall, it is noticed that the results of Sentinel-2 outperform the results of MODIS, as shown in and . Additionally, the flood inundation extent is estimated at the two maximum events, as displayed in . Overall, the estimated flood inundation extents based on MODIS and Sentinel-2 furnishes a good agreement compared with the RRI outputs over all states, as reflected in . However, both sensors reveal such discrepancies at different states. As for illustration, the estimated flood inundation area based on Sentinel-2 shows less performance with a significant underestimation at Gedaref state similarly to MODIS estimated at White Nile state. On the contrary, the Sentinel-2 estimate shows a considerable overestimation at White River state which might be due to the uncertainties of the sensor.
Figure 6. Mapping of flood inundation extent over the most affected states for two sensors (MODIS, Sentinel-2) and RRI results.
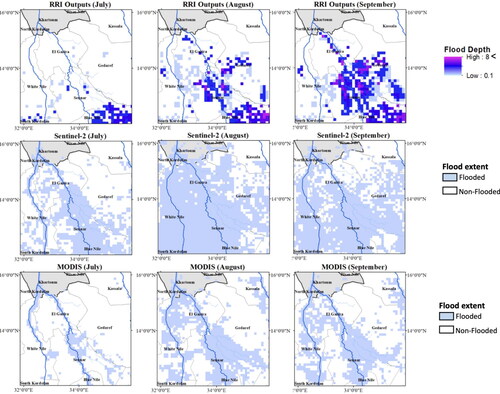
Figure 7. Categorical Statistical indicators used to evaluate the performance of sensors in detection flood inundation.
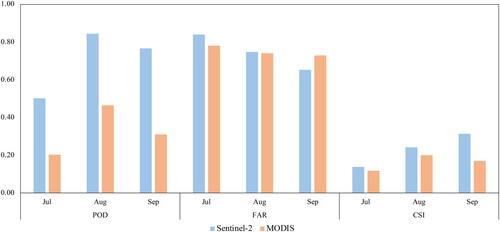
Figure 8. Flood inundation area of the two extreme flood events as estimated by two sensors and the RRI model over different states.
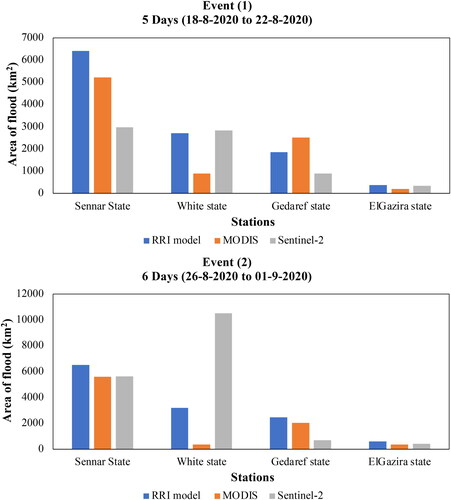
Both sensors reproduce well compared with the RRI outputs with insignificant differences over Elgazira and white states. It also noticed that the Sennar state has the most extensive flood inundation area compared with others implying it also suffered severe damage (see and ). These findings correspond with the information of the report of (FAO Citation2020).
5. Conclusions
In this study, the characteristics of a major flood event in 2020 in Sudan were investigated by applying the rainfall runoff-inundation (RRI) model. The RRI model simulates the streamflow and flood inundation based on remote sensing data over the BNB and the White Nile basin. Also, mapping of flood inundation was estimated over the most affected states based on the multi-sensors approach to understanding the dynamics of flooding events in Sudan and, in particular, Khartoum State. The main findings can be summarized as follows:
The RRI model shows a good performance in the simulation of the streamflow over the BNB. However, it resulted in lower performance over the White Nile basin.
Based on the flood inundation maps estimated from multi-sensors, the main reason for damage in Khartoum state is the riverine flood of both the BNB and the White Nile.
The MODIS and Sentinel-2 satellite observations have relatively good performance compared with the RRI’s inundation maps in major states. However, they appear a significant discrepancy in such states.
The lack of data is a common issue that is typically facing researchers in the transboundary basins, particularly in developed nations. These findings disclose that the rainfall-runoff modeling and multi-sensors approach applied in this study can overcome the challenges of accessing observed data. However, further validation for the flood inundation extent based on measured data is also required in future research to obtain more precise results. This adds to preventing the uncertainties of satellite images and the RRI outputs resulting from the remote sensing data used, such as precipitation, land use, soil type, and evapotranspiration. Moreover, further research should be conducted to predict and assess future extreme floods considering the impact of climate change. Additionally, the consideration of the proposed and existing reservoirs construction and development projects in upper NRB countries is the key driver to altering the amount and variability of the Nile River flow, particularly the GERD. Although the GERD will reduce the riverine flood hazards, according to (Basheer Citation2021)’ study; however, it will definitely affect negatively the water share of the downstream countries (Egypt and Sudan). Also, it is worth to mention the livelihoods of thousands of farmers in Sudan will be affected due to the loss of recession agriculture caused by the regular flow resulting from the construction of the GERD (Basheer Citation2021). Undoubtedly, floods, despite the damage and destruction that predominantly cause, provide environmental and economic benefits (Basheer Citation2021).
Overall, the presented framework that integrates freely available remote sensing observations with open-source flood inundation models can be a feasible tool and a valuable guide for decision-makers by indicating early flood warnings, especially in scarce data regions, which are either limited gauged or ungauged regions, like Sudan.
Supplemental Material
Download MS Word (428.7 KB)Acknowledgement
This study was supported by the JSPS Core-to-Core Program (Grant number: JPJSCCB20220004).
Disclosure statement
No potential conflict of interest was reported by the authors.
Data availability statement
The data that support the findings of this study are available from the corresponding author, [Hadir Abdelmoneim], upon reasonable request.
References
- Abd-El Moneim H, Soliman MR, Moghazy HM. 2019. Hydrologic evaluation of TRMM multi-satellite precipitation analysis products over blue nile basin. In: 2nd Int Conf Chem Energy Environ Eng. p. 33–44.
- Abdelmoneim H, Soliman MR, Moghazy HM. 2020. Evaluation of TRMM 3B42V7 and CHIRPS satellite precipitation products as an input for hydrological model over Eastern Nile basin. Earth Syst Environ. 4(4):685–698.
- Abdelmoneim H, Soliman MR, Moghazy HM. 2022. Hydrologic assessment of the uncertainty of six remote sensing precipitation estimates driven by a distributed hydrologic model in the blue nile basin. In: Sumi T, Kantoush SA, Saber M, editors. Wadi Flash Floods. Natural Disaster Science and Mitigation Engineering: DPRI reports. Singapore: Springer.
- Abdrabo KI, Kantoush SA, Saber M, Sumi T, Habiba OM, Elleithy D, Elboshy B. 2020. Integrated methodology for urban flood risk mapping at the microscale in ungauged regions : a case study of Hurghada, Egypt. Remote Sens. 12(21):3548.
- Afshari S, Tavakoly AA, Rajib MA, Zheng X, Follum ML, Omranian E, Fekete BM. 2018. Comparison of new generation low-complexity flood inundation mapping tools with a hydrodynamic model. J Hydrol. 556:539–556. https://www.sciencedirect.com/science/article/pii/S0022169417308016.
- Attema E, Cafforio C, Gottwald M, Guccione P, Guarnieri AM, Rocca F, Snoeij P. 2010. Flexible dynamic block adaptive quantization for Sentinel-1 SAR missions. IEEE Geosci Remote Sens Lett. 7(4):766–770.
- Basheer M. 2021. Cooperative operation of the Grand Ethiopian Renaissance Dam reduces Nile riverine floods. River Res Appl. 37:805–814.
- Bellos V, Papageorgaki I, Kourtis I, Vangelis H, Kalogiros I, Tsakiris G. 2020. Reconstruction of a flash flood event using a 2D hydrodynamic model under spatial and temporal variability of storm. Nat Hazards. 101(3):711–726.
- Bellos V, Tsakiris G. 2016. A hybrid method for flood simulation in small catchments combining hydrodynamic and hydrological techniques. J Hydrol. 540:331–339.
- Bhagabati SS, Kawasaki A. 2017. Consideration of the rainfall-runoff-inundation (RRI) model for flood mapping in a deltaic area of myanmar. Hydrol Res Lett. 11(3):155–160.
- Bhattacharya B, Mazzoleni M, Ugay R. 2019. Flood inundation mapping of the sparsely gauged large-scale Brahmaputra basin using remote sensing products. Remote Sens. 11(5):501.
- Bhola PK, Leandro J, Disse M. 2018. Framework for offline flood inundation forecasts for two-dimensional hydrodynamic models. Geosciences. 8(9):346. https://www.mdpi.com/2076-3263/8/9/346.
- Block P, Rajagopalan B. 2009. Statistical–dynamical approach for streamflow modeling at Malakal, Sudan, on the White Nile River. J Hydrol Eng. 14(2):185–196.
- Chander G, Markham BL, Helder DL. 2009. Summary of current radiometric calibration coefficients for Landsat MSS, TM, ETM+, and EO-1 ALI sensors. Remote Sens. Environ. 113:893–903.
- Chau K. 2017. Use of meta-heuristic techniques in rainfall-runoff modelling. Water. 9(3):186. https://www.mdpi.com/2073-4441/9/3/186.
- Costabile P, Costanzo C. 2021. A 2D-SWEs framework for efficient catchment-scale simulations: hydrodynamic scaling properties of river networks and implications for non-uniform grids generation. J Hydrol. 599(February):126306.
- Costabile P, Costanzo C, Ferraro D, Barca P. 2021. Is HEC-RAS 2D accurate enough for storm-event hazard assessment? Lessons learnt from a benchmarking study based on rain-on-grid modelling. J Hydrol. 603(PB):126962.
- CRED. 2020. Disaster year in review 2019. CRED Crunch . (58):1–2. https://www.emdat.be/publications?field_publication_type_tid=All.
- CRED & UNDRR 2021. 2020 The non-COVID year in Disasters. Brussels: CRED.
- David A, Schmalz B. 2020. Flood hazard analysis in small catchments: comparison of hydrological and hydrodynamic approaches by the use of direct rainfall. J Flood Risk Manag. 13(4):1–26.
- Eldardiry H, Hossain F. 2019. Understanding reservoir operating rules in the transboundary Nile River Basin using macroscale hydrologic modeling with satellite measurements. J Hydrometeorol. 20(11):2253–2269.
- Eldardiry H, Hossain F. 2021. A blueprint for adapting high Aswan dam operation in Egypt to challenges of filling and operation of the Grand Ethiopian Renaissance dam. J Hydrol. 598:125708.
- FAO 2020. The Sudan flood response plan 2020–2021. Food and Agriculture Organization of the United Nations Rome. p. 2.
- Funk C, Peterson P, Landsfeld M, Pedreros D, Verdin J, Shukla S, Husak G, Rowland J, Harrison L, Hoell A, et al. 2015. The climate hazards infrared precipitation with stations—a new environmental record for monitoring extremes. Sci Data. 2(1):150066.
- Gelete G, Gokcekus H, Gichamo T. 2020. Impact of climate change on the hydrology of Blue Nile basin, Ethiopia: a review. J Water Clim Chang. 11(4):1539–1550.
- Gilewski P. 2021. Impact of the grid resolution and deterministic interpolation of precipitation on rainfall-runoff modeling in a sparsely gauged mountainous catchment. Water (Switzerland). 13(2):230.
- Gilewski P, Nawalany M. 2018. Inter-comparison of Rain-Gauge, Radar, and Satellite (IMERG GPM) precipitation estimates performance for rainfall-runoff modeling in a mountainous catchment in Poland. Water (Switzerland). 10(11):1–23.
- Gorelick N, Hancher M, Dixon M, Ilyushchenko S, Thau D, Moore R. 2017. Google Earth Engine: planetary-scale geospatial analysis for everyone. Remote Sens Environ. 202:18–27.
- Grimaldi S, Li Y, Pauwels VRN, Walker JP. 2016. Remote sensing-derived water extent and level to constrain hydraulic flood forecasting models: opportunities and challenges. Surv Geophys. 37(5):977–1034.
- Khairy AAA. 2020. Spatiotemporal flood hazard and flood risk assessment using remote sensing techniques. Case study: khartoum State, Sudan.
- Khan SI, Hong Y, Wang J, Yilmaz KK, Gourley JJ, Adler RF, Brakenridge GR, Policelli F, Habib S, Irwin D. 2011. Satellite remote sensing and hydrologic modeling for flood inundation mapping in lake Victoria basin: implications for hydrologic prediction in ungauged basins. IEEE Trans Geosci Remote Sensing. 49(1):85–95.
- Lakew HB, Moges SA, Asfaw DH. 2017. Hydrological evaluation of satellite and reanalysis precipitation products in the upper Blue Nile Basin: a case study of Gilgel Abbay. Hydrology. 4(3):39. http://www.mdpi.com/2306-5338/4/3/39.
- Legates DR, McCabe GJ. Jr. 1999. Evaluating the use of “goodness of fit” measures in hydrologic and hydroclimatic model validation. Water Resour Res. 35(1):233–241. http://wwwbrr.cr.usgs.gov/projects/SW_precip_runoff/McCabe/pap.
- Li C j, Chai Y q, Yang L s, Li H r. 2016. Spatio-temporal distribution of flood disasters and analysis of influencing factors in Africa. Nat Hazards. 82(1):721–731.
- Mason DC, Schumann GJ-P, Bates PD. 2010. Data utilization in flood inundation modelling. In: Flood Risk Science and Management. Wiley-Blackwell; p. 209–233.
- McFEETERS SK. 1996. The use of the normalized difference water index (NDWI) in the delineation of open water features. Int J Remote Sens. 17(7):1425–1432.
- Ming X, Liang Q, Xia X, Li D, Fowler HJ. 2020. Real-time flood forecasting based on a high-performance 2-D hydrodynamic model and numerical weather predictions. Water Resour Res. 56(7):e2019WR025583.
- Moriasi DN, Arnold JG, Liew MW, Bingner V, Harmel RL, Veith TL. 2007. Model evaluation guidelines for systematic quantification of accuracy in watershed simulations. Trans ASABE. 50:885–900.
- Muñoz Sabater J, 2019. ERA5-Land monthly averaged data from 1981 to present. Copernicus Clim. Chang. Serv. Clim. Data Store (CDS). https://doi.org/10.24381/cds.68d2bb30
- Nastiti KD, An H, Kim Y, Jung K. 2018. Large-scale rainfall–runoff–inundation modeling for upper Citarum River watershed, Indonesia. Environ Earth Sci. 77(18):1–12.
- Patel NN, Angiuli E, Gamba P, Gaughan A, Lisini G, Stevens FR, Tatem AJ, Trianni G. 2015. Multitemporal settlement and population mapping from Landsat using Google Earth Engine. Int J Appl Earth Obs Geoinf. 35:199–208.
- Patro S, Chatterjee C, Mohanty S, Singh R, Raghuwanshi NS. 2009. Flood inundation modeling using MIKE FLOOD and remote sensing data. J Indian Soc Remote Sens. 37(1):107–118.
- Perera EDP, Sayama T, Magome J, Hasegawa A, Iwami Y. 2017. RCP8.5-based future flood hazard analysis for the lower Mekong river basin. Hydrology. 4(4):55.
- Rosser JF, Leibovici DG, Jackson MJ. 2017. Rapid flood inundation mapping using social media, remote sensing and topographic data. Nat Hazards. 87(1):103–120.
- Saber M, Kantoush SA, Abdel-Fattah M. Sumi T, Moya JA, Abdrabo K. 2022. Flash flood modeling and mitigation in arid and semiarid basins: case studies from Oman and Brazil. In: Sumi T, Kantoush SA, Saber M, editors. Wadi Flash Floods. Natural Disaster Science and Mitigation Engineering: DPRI reports. Singapore: Springer.
- San ZMLT, Zin WW, Kawasaki A, Acierto RA, Oo TZ. 2020. Developing flood inundation map using RRI and SOBEK models: a case study of the Bago River Basin, Myanmar. JDR. 15(3):277–287.
- Sayama T, Ozawa G, Kawakami T, Nabesaka S, Fukami K. 2012. Rainfall–runoff–inundation analysis of the 2010 Pakistan flood in the Kabul River basin. Hydrol Sci J. 57(2):298–312.
- Shrestha BB, Okazumi T, Miyamoto M, Sawano H. 2016. Flood damage assessment in the Pampanga river basin of the Philippines. J Flood Risk Manage. 9(4):355–369.
- Tam TH, Abd Rahman MZ, Harun S, Hanapi MN, Kaoje IU. 2019. Application of satellite rainfall products for flood inundation modelling in Kelantan River Basin, Malaysia. Hydrology. 6(4):95.
- Teng J, Jakeman AJ, Vaze J, Croke BFW, Dutta D, Kim S. 2017. Flood inundation modelling: A review of methods, recent advances and uncertainty analysis. Environ Model Softw. 90:201–216.
- Try S, Lee G, Yu W, Oeurng C, Jang C. 2018. Large-scale flood-inundation modeling in the Mekong river basin. J Hydrol Eng. 23(7):05018011.
- Try S, Tanaka S, Tanaka K, Sayama T, Oeurng C, Uk S, Takara K, Hu M, Han D. 2020. Comparison of gridded precipitation datasets for rainfall-runoff and inundation modeling in the Mekong River Basin. PLoS ONE. 15(1):e0226814.
- UNOCHA (United Nations Office for the Coordination of Humanitarian Affairs). 2013. Sudan: flash update. UNOCHA (United Nations Off Coord Humanit Aff (issue no. 9.). https://reliefweb.int/report/sudan/sudan-flash-update-september-15-2013-issue-9.
- UNOCHA (United Nations Office for the Coordination of Humanitarian Affairs) 2020. Sudan: floods map (as of 06/09/2020).
- Xu H. 2006. Modification of normalised difference water index (NDWI) to enhance open water features in remotely sensed imagery. Int J Remote Sens [Internet]. 27(14):3025–3033.
- Yoshimoto S, Amarnath G. 2017. Applications of satellite-based rainfall estimates in flood inundation modeling–a case study in Mundeni Aru River Basin, Sri Lanka. Remote Sens. 9(10):998.
- Zhou Y, Dong J, Xiao X, Liu R, Zou Z, Zhao G, Ge Q. 2019. Science of the total environment continuous monitoring of lake dynamics on the Mongolian Plateau using all available Landsat imagery and Google Earth Engine. Sci Total Environ. 689:366–380.
- Zurqani HA, Post CJ, Mikhailova EA, Schlautman MA, Sharp JL. 2018. Geospatial analysis of land use change in the Savannah River Basin using Google Earth Engine. Int J Appl Earth Obs Geoinf. 69:175–185.