
Abstract
Landslides in high-order position areas pose a serious threat to residents located below such areas. Therefore, research on the evolution process and underlying dynamic mechanisms is crucial. The majority of relevant studies are based on landslides that have already occurred; however, the investigation of potential landslides is of higher value. In this study, a progressive potential landslide identification method is proposed with the application of SBAS-InSAR (Small Baseline Subset Interferometric Synthetic Aperture Radar) and subsequently combined with Google Earth, GF-1 (Gaofen-1), GF-2 (Gaofen-2), ZY-3 (Ziyuan-3) and UAV (Unmanned Aerial Vehicle) imagery, and DEM (Digital Elevation Model) for further validation. The proposed method is employed to determine the potential landslide in Tuanjiecun by integrating the multi-period data to simultaneously analyze the evolution and mechanism of the potential landslide. The long short-term memory method is then adopted to predict the evolution trend based on accumulative deformation from SBAS-InSAR. The results suggest that the deformation of Tuanjiecun potential landslide will increase to −238.57 mm. This article provides a new approach for disaster prevention and mitigation by determining a potential landslide using composite remote sensing and predicting the development of the potential landslide on indirect contact monitoring.
1. Introduction
Landslides are considered to be one of the most harmful geological disasters in the world, inducing an enormous loss of property and life each year (Liao et al. Citation2021). Landslides in high-order position areas typically pose huge dangers with their kinetic and gravitational potential energy, yet they can be difficult to recognize on time, particularly if they are concealed (Li et al. Citation2020). Landslides are always accompanied by devastating disasters and can even bury entire villages. For example, the Xinmo landslide in 2017 buried the whole village with over 100 inhabitants in just a few seconds (Cui et al. Citation2022). Numerous landslides occur each year in the mountainous area of Southwest China, particularly in Sichuan province, threatening the ecology, life and infrastructure (Gao et al. Citation2022). Therefore, the early identification, monitoring and immediate hedging of huge landslides are crucial.
The method of early landslide identification is generally based on remote sensing. Initial research from the late 1970s focused on recognizing the characteristics of landslides via Landsat images (Sauchyn and Trench Citation1978) as well as the analysis and observation of landslide occurrence characteristics by integrating approaches for forecasting (Rib and Liang Citation1978). Since the 1990s, the geologic evaluation of landslide stability in engineering was typically performed to ascertain the shear surface, failure plane, internal slider movement and hydrogeological regime of the landslide. However, such geophysical surveys are usually high in costs (McCann and Forster Citation1990). Thus, GPS, phototopography and InSAR have played important roles in timely monitoring the activities of existing landslides (Mantovani et al. Citation1996). In the years following 2000, studies were able to determine the landslide type and quantify changes via high resolution remote sensing images (Saba et al. Citation2010; Cao et al. Citation2021). However, as optical images are limited by the influence of clouds, the atmosphere etc., the combination of optical images and SAR for the detection and monitoring of landslides has been of great significance in recent years (Mondini et al. Citation2021; Cao et al. Citation2022). This technique is not only limited to the monitoring of landslide changes, but can also predict the evolution based on mathematical models (Wang et al. Citation2022; Zhang et al. Citation2022). In addition, numerous advanced machine learning methods had been used for landslide deformation prediction (Azarafza et al. Citation2021). The evolution and development of huge landslides generally exhibit the creep sliding phenomenon at the early stage and rupture at crucial moments. Thus, the development of landslides can be successfully predicted based on early creep sliding research (Long et al. Citation2022).
Recent studies on landslide identification generally integrate various methods, including the combination of optical and microwave remote sensing (Bouali et al. Citation2019), as well as the combination of micro and macro approaches, allowing for the more precise early identification of landslides (Wang et al. Citation2020; Zhuang et al. Citation2021). Landslide susceptibility analysis can also effectively predict landslides, making early recognition of landslides more specific (Nanehkaran et al. Citation2021; Nikoobakht et al. Citation2022). However, landslide susceptibility analysis mainly focuses on predicting regional potential landslides (Azarafza et al. Citation2018), while remote sensing interpretation and analysis can achieve the early identification of individual landslides over a large area (Lauknes et al. Citation2007; Scaioni Citation2013). Some organizations require the monitoring and prediction of multiple landslides, which has induced the development of early warning systems (Pecoraro et al. Citation2018). However, considering the complexity of engineering geological conditions of an individual landslide, it is difficult to replace individual monitoring with generalized systems. Therefore, in the current study, we focus on monitoring and predicting a single landslide. Early recognition of landslide deformations is often complicated and cannot be recognized through a single approach (Mengistu et al. Citation2019). Previous research has combined InSAR and optical image interpretation to identify potential landslides (Zhao et al. Citation2012; Lucieer et al. Citation2014). The integration of microwave remote sensing, optical remote sensing and unmanned aerial technology enables the full-dimensional exploration of surface deformations, overcoming the shortcomings of traditional artificial monitoring directly from points (Lucieer et al. Citation2014; Turner et al. Citation2015). The significance of potential landslide recognition lies in the effective monitoring after the early recognition of the landslide, the timely evacuation of people and the protection of property, in order to minimize the consequences of the landslide (Frattini et al. Citation2018). Therefore, predicting the deformation rate and evolution trend of potential landslides is the focus of landslide disaster prevention and control. Since the twenty-first century, the research focus has gradually shifted towards monitoring individual landslides, and many methods and theories have been proposed to predict the displacement and evolution trend of potential landslides (Lauknes et al. Citation2007). These can mainly be divided into two categories: physical methods and mathematical methods (Huang et al. Citation2016). Physical methods are usually based on creep theory, often involve a lot of computational work and have certain limitations. In comparison, mathematical methods can be more effective in predicting potential landslide displacement, with key data models including regression models (Jibson Citation2007), fractal theory (Sezer Citation2010), neural networks (Nourani et al. Citation2009), etc. Due to their powerful data computing capability, machine learning methods can be widely used for predictions by learning from the historical monitoring data of potential landslide displacement (Lian et al. Citation2016). Among these, ANN (Artificial Neural Network), SVM (Support Vector Machine) and RNN (Recurrent Neural Network) are commonly used models for landslide displacement prediction (Liu et al. Citation2014; Lian et al. Citation2015; Zhang et al. Citation2019). Du et al. developed a reverse neural network to complete the prediction of cumulative displacement through periodic and trend terms (Du et al. Citation2013). Lian et al. also put forward an extreme learning algorithm to overcome the defects of extreme convergence and local minimization (maximization) (Lian et al. Citation2016).
The existing literature generally focuses on existing landslides, such as the Xinmo landslide (Sichuan, China) in 2017 (Fan et al. Citation2017) and the Baige landslide (Yunnan, China) in 2018 (Cai et al. Citation2022). These landslides have already occurred, and thus the significance of such research is lower than that of potential landslides that have not yet occurred. The current article is aimed at the effective identification of potential landslides that have not occurred. In particular, we determine potential landslides through InSAR and optical image interpretation, replacing the previous method of determining potential landslides mainly through field investigations. In addition, the landslides had not been predicted for their future deformation in previous studies as landslide had occurred, making the research work on potential landslide insufficient. Therefore, this article analyzes the deformation mechanism of the potential landslide after it is identified, combining a field investigation, with a machine learning model to learn historical deformation data and subsequently conduct a detailed analysis of the potential landslide evolution trend in the next five years (Chung et al. Citation2022) after the potential landslide is ascertained. This approach replaces in situ monitoring, saves costs and provides important guidance to reduce losses of landslides in a timely manner.
Landslides are the most common geological hazards in Southwest China, particularly high-order position and large-scale landslides. Disaster investigation and early identification are time-consuming, laborious and unsafe in such place. Diexi in southwest China, with frequent earthquakes and a complex geo-structure, is selected as the study area of this work. This article aims to identify the potential landslides in the area with a method that improves security and saves costs, and analyzes the evolution trend of the potential landslides. The specific research steps are as follows. The suspected potential landslide areas are first identified by SBAS-InSAR data, followed by the recognition of these suspected potential landslides by multiple-source remote sensing images to further identify the suspected potential landslides. Finally, the Tuanjiecun suspected potential landslide is selected as the key survey target and field investigations are subsequently conducted. Three key steps are performed after the selection of the Tuanjiecun potential landslide: (a) the analysis of over 50 months of SBAS-InSAR data; (b) high-resolution image comparisons over a 10-year period and (c) differential DEM analysis at various periods. Following this, the deformation velocity of the first 48 periods from SBAS-InSAR data are used to predict the future deformation velocity by machine learning and verified by the subsequent 10 periods. The proposed prediction model can be applied to future deformation predictions and is of great significance to in-depth landslide studies.
2. Study area and geological settings
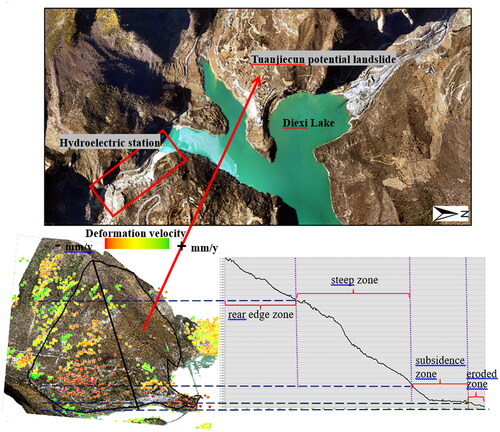
The Tuanjiecun potential landslide is located in Diexi, the Sichuan province of China, where geological hazards frequently occur due to the strong compression from the Qinghai Tibet Plateau and Sichuan Basin. As shown in , the observed potential landslide lies on the crushed steep strips of a typical meizoseismal area. Dozens of earthquakes have occurred around Tuanjiecun in the past 100 years. The Tianlonghu hydropower station, located by Diexi Lake close to Tuanjiecun, has been in operation since 2003 and has had an impact on the Tuanjiecun potential landslide. The storage–discharge–storage of water over time affects the distribution of stress and influences ground sinking. Field surveys have revealed different degrees of cracks on the walls of almost all houses and pavements in Tuanjiecun, as well as the soil ground on the roadside ().
Figure 1. Study area and surrounding environment.
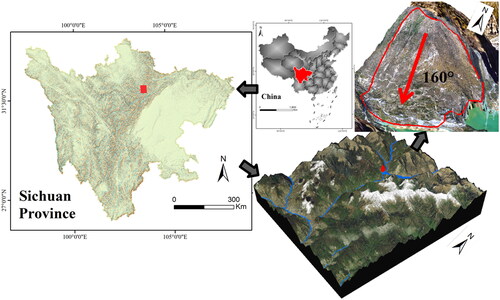
Figure 2. Field survey of Tuanjiecun: cracks in houses and roads: (a) UAV image of cracks in road. (b) Photograph of crack in house taken during site investigation. (c) Photograph of crack M and crack N in road taken during site investigation. (d, e) Photograph of crack M in road taken during site investigation.
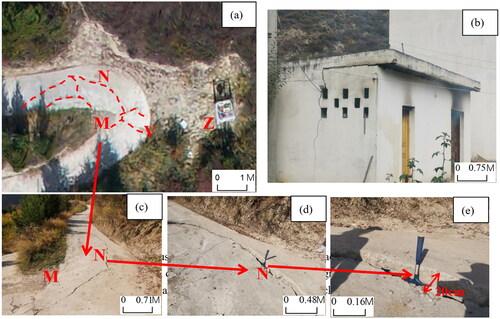
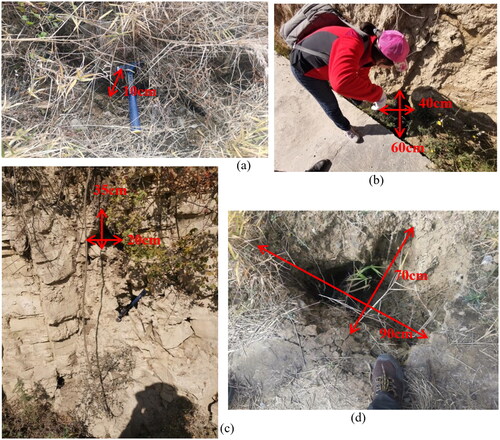
Additional in depth surveys have determined, the presence of not only cracks in every corner, but extensive roadbed cavities under the cement pavement with depths exceeding 90 cm in Tuanjiecun. The depth of these cavities is smaller in the north compared to the south, and all cracks are located at the corners or on steep pavements. This demonstrates that the slope is inclining to the south, with a major slip direction at 160° after measurements. Is also proved by the 5–20 cm gaps between the pavement and north mountain, which are currently expanding. Numerous underground cavities are located in the mountain, particularly in the central and lower parts, (). Underground excavation to determine the deformation characteristics did not identify an obvious collapsing or accumulation of bodies on the ground, yet the hydrostatic sedimentary layer was observed everywhere (). It is not possible to ascertain the exact time of the initial creeping; however, we can observe that the slope is moving at least 1 cm each year.
Figure 3. Hydrostatic sedimentary layer and underground cavities: (a, d) Underground cavities. (b, c) Hydrostatic sedimentary layer with cavities.
The front edge coordinates of the landslide were determined as 32°2′31.32″N, 103°39′54.74″E, 2153 m and the rear edge coordinates as 32°2′53.29″N, 103°39′43.92″E, 2534 m. The height difference between the front and rear edges of the potential landslide is approximately 400 m, with a longitudinal length close to 800 m and a transverse width of 700 m. The main sliding direction is approximately 160°, and the landslide slope is 36°. The stratigraphic structure is relatively complex. The front region is the quaternary accumulation layer and super floodplain terrace alluvium, and is mainly composed of loess. The bottom region is gravel with breccia, with a thickness of 128–225 m. The central area is the Bocigou formation of the Xikang Group of the Lower Triassic system. The upper component of the lithology is gray, gray-green or purple-red and silty slate, intercalated with a small amount of gray thin-layer sandstone or gray thin-layer limestone, while the bottom is the ferromanganese layer. The lower part is a gray and gray-white thin layer of thin plate limestone mixed with calcareous slate or phyllite, and locally produces a thin layer of iron and manganese, with a thickness of 16–101 m. The posterior part is the Zagunao formation of the Xikang Group of the Middle Triassic system. The rock stratum strike is determined as 10°, with an occurrence of 100°∠45°.
3. Data and methods
Research on potential landslides proves to be more complicated compared to landslides that have already occurred. In order to overcome this, we used composite data and approaches, including potential landslide searching, the corresponding geological environment, deformation history, deformation prediction and verification, deformation mechanisms, kinematic characteristics and disaster assessments. and summarize the data and methodology applied in this study. The entire process includes three operations, namely general investigation, further investigation and verifiable investigation. General investigation mainly analyzes long-term surface deformation through SBAS-InSAR to ascertain the deformation area and preliminarily determine critical identification objects. Further investigation is performed with the composite and high-resolution remote sensing images after critical identification objects have been determine. A verifiable evaluation is then conducted by UVA and field investigations on the results of the previous step to prove the potential landslide. Finally, the evolution trend of the potential is predicted landslide by machine learning. The key steps of the methodological approach are described in the following.
Figure 4. Data and methodology applied in this study.
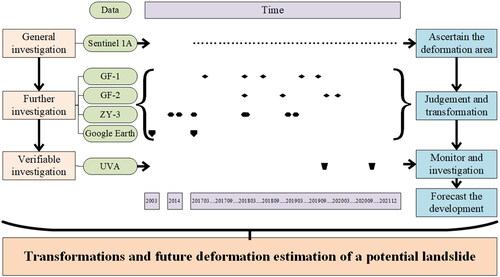
Table 1. Summary of data types, methods and functions.
3.1. Deformation identification with InSAR
SBAS-InSAR is frequently implemented for the large-area, long-term subsidence monitoring of land, and in particular, for landslide detection in recent years (Eker and Aydın Citation2021). The influence of spatiotemporal decorrelation is reduced by selecting a short spatiotemporal baseline image. During the processing of SBAS-InSAR, multiple main images will be selected for interference processing through a short space-time baseline combination to reduce the interference of temporal and spatial incoherence to the deformation results. This technique is highly precise, has a wide area coverage, and can be used to determine the comprehensive information of surface deformation (Wasowski and Bovenga Citation2014). InSAR technology can also approximate the time at which landslides began. (Fobert et al. Citation2021). In particular, it can detect surface changes at the millimeter scale (Dong et al. Citation2018), and therefore, compute surface deformation prior to landslides according to previous records. In this article, we employed 157 single-look complex (SLC) datasets spanning from March 2017 to December 2021 (5 years) and a DEM with a 12.5 m spatial resolution. The datasets were analyzed using the SBAS-InSAR approach by the GAMMA2020 platform to determine the potential landslide. The post processing was divided into the following two components; (i) a model was constructed with deformation data from the previous four years of potential landslides using a machine learning method in MATLAB (2019b, Math Works). The scheme was set up to second-guess the future deformation based on existing data. (ii) The deformation predictions of the last year were then checked, with a greater consistency indicating a greater accuracy of the model. The deformation was then forecasted over a period of time via this model.
3.2. Composite optical images for visual interpretation
Optical remote sensing imagery is required to define potential landslides when InSAR detects surface deformations. In order to determine the grade of potential landslides, the deformation is taken as relative not absolute. This can be complicated for InSAR data. Optical images can be employed to overcome this limitation (Fan et al. Citation2017) and estimate the topography, landforms, geological environment, location, vegetation, slope, size, etc. of landslides (Kalantar et al. Citation2020). The optical imagery used in this study include Google Earth online maps, Tianditu online maps, Gaofen-2 (GF-2) satellite imagery with a 1 m resolution and Ziyuan-3 (ZY-3) satellite imagery with a 2 m resolution.
Areas that may be potential landslides were identified by combining optical images with InSAR deformation data. An initial screening excluded the impact from glaciers and urban land subsidence. Following this, each potential site was evaluated separately based on the visual interpretation of high resolution images. Large potential landslides often occur on ancient landslides, therefore, special attention should be paid to the deformation of ancient landslides. Finally, a field verification was performed using high-resolution UAV optical images and orthophoto maps with a 0.5 m resolution, identifying gullies, cracks, collapses, etc. The final verification required a more detailed engineering geological survey.
3.3. Comparison of DEMs from several time periods
The InSAR data identified deformation around Tuanjiecun village in 2017–2019, and thus a 0.2-m resolution DEM was derived using the UAV data for comparisons. The topography and slope information were obtained from the same time period. It lasts deformation around Tuanjiecun village monitoring by InSAR from 2019 to 2020, and thus a finer resolution DEM (0.056 m) was obtained by the UAV in 2020. Superposition calculations were performed in ArcGIS 10.8 (ESRI) between these two DEMs to analyze topography changes. In addition, in-depth analysis of the deformation mechanism and possible trailing edges was conducted using the higher resolution DEM. The changes between the two DEMs were employed to verify the InSAR deformation results.
3.4. Long short-term memory (LSTM) method
The prediction method adopts LSTM, improving on RNN in machine learning (Gao et al. Citation2022). This method is mainly applied to neural network prediction based on sequence data and has achieved good results in many studies. There are initially three inputs: cell state Ct−1, hidden layer state Kt−1 and Xt. The output has two namely Ct and Kt. Kt is the output at time t. The output layer is predicted according to the input layer, that is, information is transmitted downward over time. The complex structure transmission process of the hidden layer state avoids the dependence of long-term conduction, hence LSTM is better than RNN. In this study, the identified tangible deformation of the potential landslide is learned to predict future variables.
4. Ascertainment process and deformation analysis
4.1. Ascertainment of Tuanjiecun potential landslide
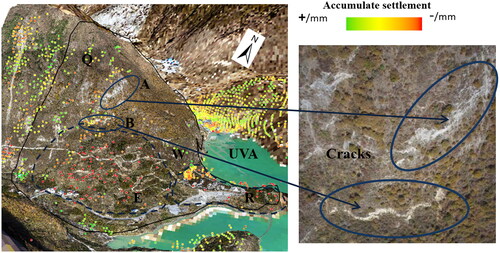
The composite optical images were integrated with the SBAS-InSAR method. First, we obtained the subsidence accumulation area of the surface through large-scale analysis via SBAS-InSAR technology and selected several critical points. The composite optical images of these critical points were then evaluated based on the following factors: high-order, threatened the inhabitants, large scale, prominent round-back armchair terrain and keep exacerbating. This was then used to ascertain the Tuanjiecun potential landslide. Following this, the landslide was divided into four regions by deformation points within the 3D model, namely, Q, W, E and R. E and R are subsided points while Q and W are uplifting points (). The subside of zone R is much stronger than that of zone E, and zone R (located at the bottom of the potential landslide) is the main human activity area of the study site. There are two cracks in zone Q both of which are almost undetectable unless viewed from the 3D model. The variables of deformation, high-order position, perniciousness to residents in foot of the hill, and the crack distribution in the trailing edge indicated this site to be a potential landslide.
Figure 5. Distribution of deformation and cracks at back edge.
4.2. Deformation history of Tuanjiecun potential landslide
The deformation history of the landslide was investigated based on three methods, namely, SBAS-InSAR data, changes in the DEM and the composite optical images.
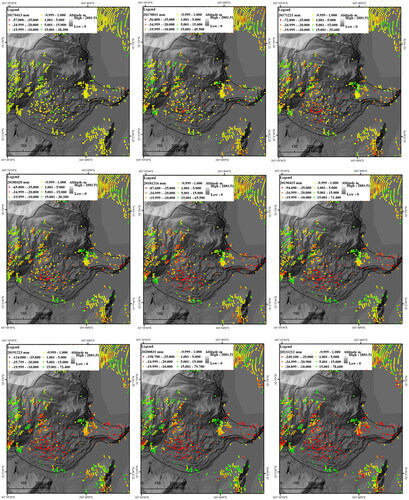
Analysis was performed on the SBAS-InSAR image sequences from March 2017 to December 2021 in order to define the period of deformation (). The deformation began in the low altitude eastern zone, corresponding to the residential corner and lower region of this potential landslide in early 2017, yet deformation levels remained low. The deformation of the low altitude eastern zone and lower region increased in 2017. In 2018, the range was enhanced but did not connect the two zones. The deformation reached the center of the potential landslide, and the maximum cumulative variable changed from −57 to −94 mm. The deformation subsequently increased in 2020, whereby the maximum cumulative variable reached −158 mm, yet there was no significant deformation observed in the zone between the center and eastern low altitude area. In 2021, the zone between the center and eastern low altitude area began to exhibit signs of deformation, with the maximum cumulative variable over −200 mm.
Figure 6. Deformation of Tuanjiecun potential landslide from 2017 to 2021 based on SBAS-InSAR data.
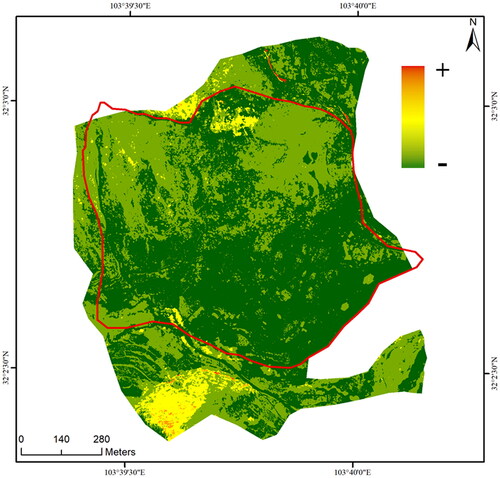
High-resolution UAV data from 2019 was used to obtain a DEM in real time in order to obtain more detailed observations. The same was done for 2020 and the two DEMs were compared (). The D-value of the two DEMs generally exhibited negative values, and only a few areas presented no obvious changes. In addition, several positive values were observed, representing the surface change of the Tuanjiecun potential landslide. For areas with negative D-values, the darker the green color, the greater the difference. The changes in the south exceed those in the north of Tuanjiecun village, indicating that the lower part of this mountain (where residents, roads and arable land are located) has a larger deformation compared to the higher zone. The deformation trend is consistent with that of SBAS-InSAR data. The higher-resolution UVA images can be used to determine much finer details compared to the satellite images.
Figure 7. D-values of the DEMs of the Tuanjiecun village (DEM of 2020 minus DEM of 2019).
Two cracks were observed in the trailing of the potential landslide from the composite optical images in 2003, 2014, 2017, 2018, 2019 and 2020 (). reports the state of these cracks for each year. The cracks seem to have formed prior to 2003. From 2003 to 2014, Crack A experienced significant deformation, with an increase in length from 45.97 to 112.60 m and in width from 1.63 to 3.83 m. Crack B exhibited relatively less changes, with a change in length from 124.22 to 147.38 m and width from 5.05 to 10.07 m. The changes in the following years were relatively small, with lengths of 130.7, 131.09, 131.94 and 132.22 m, and widths of 7.38, 8.10, 9.05 and 9.36 m for Crack A; and lengths of 149.90, 150.03, 151.35 and 151.64 m, and widths of 10.45, 10.45, 10.59 and 10.66 m for Crack B in 2017, 2018, 2019 and 2020, respectively.
Figure 8. Changes in cracks to the rear of the Tuanjiecun potential landslide from multi-source optical images.
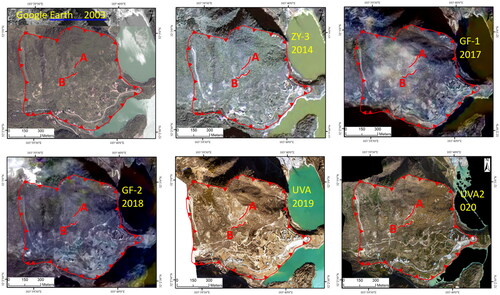
Table 2. Crack parameters at the rear of the Tuanjiecun potential landslide.
In summary, both cracks formed before 2003 and are still evolving. Due to the lack of the high-resolution images prior to 2003, we are unable to determine the exact time of their formation. Crack A grew rapidly over the study period, while Crack B exhibited a more gradual growth rate. Note that the growth occurred in microscopic increments on an annual basis.
4.3. Future deformation estimation of the Tuanjiecun potential landslide
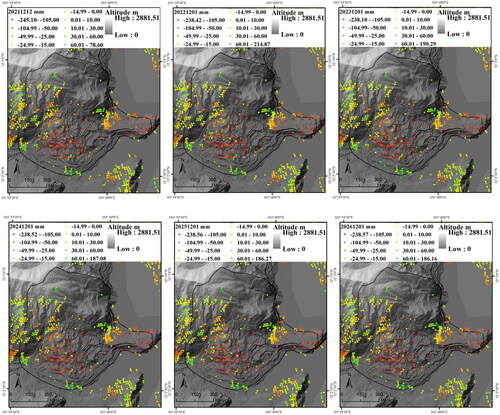
Based on of deformation history, a machine learning method was employed to forecast the future deformation. Machine learning approaches build models by learning from existing data. In this study, the LSTMmethod, with its proven performance (Xie et al. Citation2019; Zhang et al. Citation2021) was chosen to identify the trend of deformation and the corresponding values by learning from the deformation history. First, learning was performed from March 2017 to March 2021 to forecast the deformation of April 2021 to December 2021. Following this, the forecast data was compared with the results of SBAS-InSAR from April 2021 to December 2021 (), confirming the accuracy of the former. Finally, a forecast of the future deformation was performed for the period subsequent to December 2021 using data from March 2017 to December 2021. depicts the results, revealing the continuous deformation of the landslide.
Figure 9. Comparison of actual and predictive values from April 2021 to December 2021.
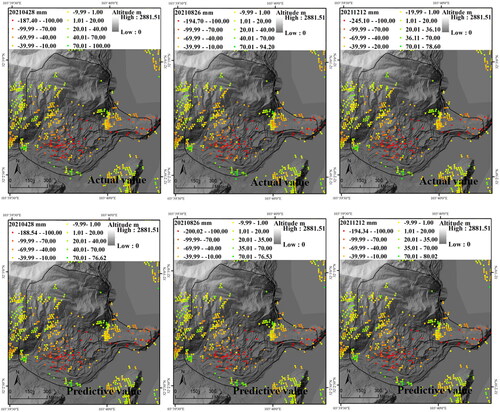
Figure 10. Changes in the deformation accumulation from 2022 to 2026 in the Tuanjiecun potential landslide.
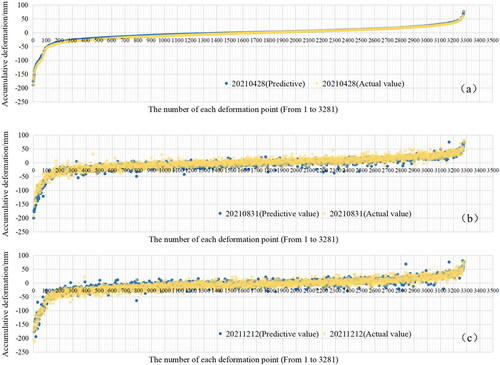
The predicted results are highly consistent with the actual deformation results from the macro analysis. In order to further verify the accuracy, the distribution values of the actual and predicted cumulative variables of the Tuanjiecun potential landslide are depicted in , representing a micro comparative analysis and confirming the relative accuracy of the results. are not sorted from large to small like in order to correspond to each point number in , comparing the similarity of two sets of numbers while also comparing the fluctuation of each point. Therefore, the fluctuations and curves of the points in are irregular and not smooth. This is a variable analysis of each month in the longitudinal direction, while for the latitudinal direction the Pearson correlation analysis of the deformation trends between the actual and predictive values during the nine months was used. A positive correlation denotes a consistent deformation trend between the actual and predicted values during the nine months at a given point, and negative correlation is used otherwise. The positive correlations account for 71.09% of the total correlations, demonstrating the high accuracy of the trend predictions.
Figure 11. Distribution of the actual accumulative deformation variables and predicted cumulative variables at the Tuanjiecun potential landslide. Each point on the x-axis in (a), (b), and (c) corresponds to the same point and the y-axis coordinate represents its accumulative deformation in the three periods, respectively.
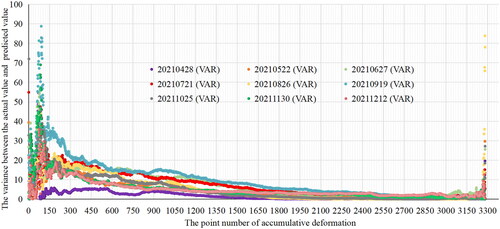
The Pearson correlation is an overall qualitative evaluation of the predicted results and actual results. Additionally, it also quantitatively evaluates each predicted result individually by calculating the variance of the accumulative deformation for each predicted and actual point over the nine months (from April 2021 to December 2021). The smaller the variance value, the closer the predicted value is to the actual value, as shown in . Among them, there are individual larger variance values in August, September and November, perhaps caused by local collapse. Variance values within 40, 20 and 10 account for 99.64, 97.26 and 79.79%, respectively. The above data further confirms the accuracy of the predicted results.
Figure 12. Variance between the actual and predicted values of each point in 9 months (from April 2021 to December 2021).
In general, the comparison and verification of the actual cumulative deformation variables and predicted cumulative variables of the Tuanjiecun potential landslide from April 2021 to December 2021 indicate the high accuracy of the LSTM method. Thus, it is used for the subsequent prediction analysis. However, the accuracy of the initial model cannot sufficiently confirm the stability of subsequent data used for the model. To further verify the accuracy of predictions for the next few years, the second-order center distance between predicted and actual deformation sequence data is compared. The second-order center distance analyzes the fluctuation size of random variables near their mean and mainly reflects the fluctuation trend of sequence data. The LSTM method predicts future deformation values based on actual deformation values. Comparing the differences between predicted (from January 2022 to Decemeber 2026) and actual (from March 2017 to December 2021) deformation fluctuations can further verify the reliability of the model. The larger the difference of the second-order center distance between the two, the greater the difference between the predicted trend and actual value, and the smaller the more stable of the predicted result. The difference between the two is shown in . The difference value is greater than 2 only for 2.62% of the total, indicating that the fluctuation trend of the predicted data is highly similar to the actual data.
Figure 13. Difference between actual and predictive values of second-order center distance.
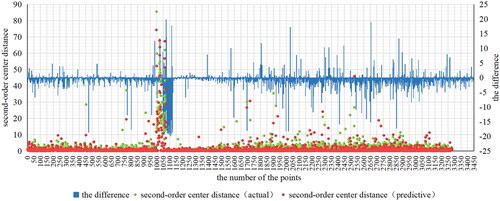
The comprehensive verification reveals the prediction model and results for the next five years to be within a stable range. The prediction results indicate that the accumulative deformation increases consistently, however, the scope of deformation does not change significantly.
5. Discussion
Long term monitoring based on SBAS-InSAR data was integrated with composite optical image analysis and situ investigations to identify and verify the deformation of a potential landslide and subsequently obtain the corresponding mechanism and mode. The key significance is approach is the determination of the time this potential landslide will break out or at which evolution stage it is in. The deformation mechanism and forecast time are discussed in the following.
5.1. Kinematics and deformation mechanism analysis
The deformation analysis in Section 4.2 reveals that the deformation process initially occurred in the bottom and central lower part of the landslide site, and subsequently gradually expanded and connected. The field survey reveals that at the rear edge, the landslide is bounded by bedrock while the slope deposit is thick. The central area exhibits obvious a sink rate and further behind there is a steep slope consisting of a deposit and lake sediment layer. The front edge is thin and contains residential and cultivated land close to the steep slope area, while the left side of the foot is eroded by the Diexi Lake. Combining both of deformation process and field investigation determines the location of the initial deformation in the regions of the thick deposit and front edge, with the uplift area positioned in this rear edge area. The characteristics of the section profile at this potential landslide are denoted as the rear edge zone, steep zone, subsidence zone and eroded zone, respectively ().
Figure 14. Deformation zone with characteristics of the section profile.
In the following, we describe the source deformation, main deformation and shear-outlet of these four components.
The source deformation area compromises the eroded zone and subsidence zone, which is confirmed by the cavities in and is attributed to the dredging and erosion over a long period of time. These cavities are distributed widely in the two zones and exhibit a trend of expansion. The extensive distribution of the lacustrine deposit is also a source of the observed cavities. The loss of soil in these cavities, as well as the long-term lake erosion at the top of the slope, accelerated the land subsidence in the eroded and subsidence zones. Furthermore, the operation of the Tianlonghu hydropower station from 2003 sped up the dredging and erosion. The cracks observed on local houses and the curved broken pavement surrounding the mountain and leaning towards the mountain toe offer additional evidence of sliding (). The curved broken pavement proves the uneven settlement of the ground and the area beside the mountain foot sinks more than that at the mountaintop. This further demonstrates the subsiding of the eroded and subsidence zones, which is consistent with the SBAS-InSAR results.
The main deformation area is the steep zone. This is also the area with the largest settlement value, close to 70 mm/y. Its deformation is due to the instability caused by the sinking of the eroded and subsidence zones, generating an integral downward slide. Thus, a large slope with two overall cracks is formed. The unequal down-sliding of the subsidence and steep zones induced the slight surface collapse. The thickness of the sliding body is difficult to determine due to the low deformation speed; however, it is estimated to exceed 20 m by field estimations of the accumulation deposit. Moreover, the rear edge zone close to the steep zone exhibits an uprising current. This zone is mainly composed of bedrock and overlying accumulation, which begin to slightly uplift following the marginal subsiding in the lower region and subsequently slide down when the lower components are unstable.
Through the above analysis, two possible shear-outlets were ascertained at the edge of the eroded zone and on the junction of the bulging and steep zones, respectively, the occurrence of which depend on the deformation speed. If the cumulative deformation of the two parts are nearly equal the shear-outlet will be at the edge of the eroded zone; and if the cumulative deformation of the steep zone is much larger than the eroded and subsidence zones, the shear-outlet will be at the foot of the steep zone. Note that this work does not consider the sudden occurrence of earthquakes, downpours, flooding, etc.
Moreover, rural roads cross the front edge, while a small number of residential houses and a large area of cultivated land are located at the foot of the slope, which along with other engineering activities accelerate the sinking of the subsidence zone.
5.2. Analysis of future deformation
The velocity and accumulative deformation-time value are employed to identify the evolution stage of landslides (Bao et al. Citation2021; Shankar et al. Citation2022). The current settlement velocity of the Tuanjiecun potential landslide is still at a relatively stable deformation stage, denoted as the early creep stage (Li et al. Citation2020). The cumulative deformation reveals that the landslide is far from reaching the critical threshold (Angeli et al. Citation2000). We subsequently predicted the evolution trend over the next five years (). The deformation trend was difficult to identify intuitively from , thus, the distribution histogram of the predicted cumulative deformation values is presented in . This agrees with the division level in . The cumulative deformation histograms from 2022 to 2026, based on predicted values, reveal the maximum number of points in the middle of the histogram to gradually evolve from −11.775 to −26.203 mm. This indicates the significant downward trend of the whole region. The number of potential landslide points (i.e., points in red bracket) has not increased significantly, indicating that the scope of the potential landslide has not expanded. The potential landslide deformation area exhibits a slow growth trend, suggesting that the Tuanjiecun potential landslide will continue to be in a relatively stable stage for a long time. However, the whole slope and surrounding areas are slowly sinking, and the potential landslide area is sinking more seriously.
Figure 15. Distribution histogram of predicted cumulative deformation values.
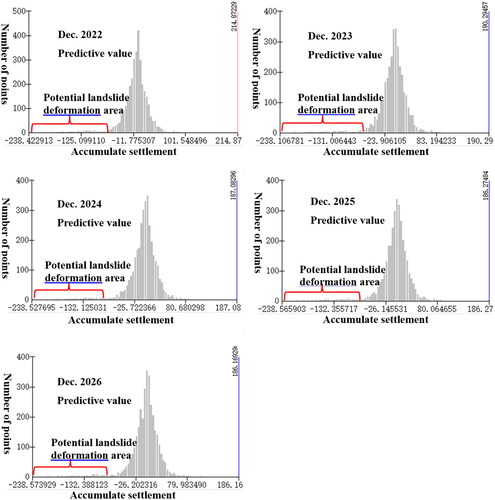
In summary, our results reveal that in the absence of large earthquakes, excessive precipitation, abnormal human activities, etc., the Tuanjiecun potential landslide will not be active in the next five years. At present, the Tuanjiecun potential landslide is in a slow creep state and requires a certain amount of time and gravity accumulation to evolve into the tertiary creep state. However, it is necessary to closely observe the area considering the devastating destruction of landslides in high-order position areas and the complex engineering geological conditions around the village.
5.3. Summary
Determining a potential landslide is critical as the massive landslides in the dense forest area cause many casualties and destroy property due to their instantaneous and destructive nature. This is particularly true from the potential landslide found under the Tuanjiecun village in this study, as there are over 100 residents directly below it. Thus the effective monitoring of the potential landslide can protect the lives and property of the village.
Although optical and microwave remote sensing approaches have been the key means of landslide investigation in recent years, studies typically investigate landslides that have occurred or will occur, and there are few cases of effective prediction of potential landslides in the early stages. Landslides in the early stage of deformation are difficult to recognize, and landslides that have not occurred cannot easily be verified. Thus, the identification and verification of the Tuanjiecun potential landslide in this study has important significance. This article not only effectively identifies the potential landslide of the Tuanjiecun village through remote sensing methods, but also deeply analyzes the driving mechanism of the potential landslide by combining on-site and deformation analysis data. It is important to consider the potential errors and limitations when using remote sensing data from different sources and at different resolutions. These factors can impact the quality and reliability of the data. Such as differences in spatial resolution and coverage, as well as the quality and accuracy of remote sensing data can vary depending on the sensor characteristics, data acquisition conditions and processing techniques. But it is precisely for the purpose of obtaining the most original surface state that the best images from different sensors were selected and processed accordingly. So it is carefully consider the limitations and potential errors when using remote sensing data in this study, such as the preliminary interpretation work was completed by applying corresponding data preprocessing procedures, and selecting remote sensing images with similar resolutions (1 and 2 m), using the same control points for ortho-rectification to ensure the authenticity of the ground objects to the greatest extent possible.
Finally, it predicts the future deformation trend of the potential landslide through LSTM algorithm analysis. This study solves the all-round research of potential landslides from recognition to analysis and prediction, which provides reference for the early recognition and evolution development of similar high-altitude and sudden landslides. It also provides reference for the study of the driving mechanism of slow creep-type landslides in the southwestern mountains of China. However, the LSTM algorithm is only suitable for the prediction and analysis of the early creep of potential landslides, as previous research shows that the initial stage of creep is relatively slow and has significant regularity. When the potential landslide evolves to a certain stage, other methods need to be used to predict its deformation. Such methods often have a certain threshold for specific times and still require comprehensive analysis in the future.
6. Conclusion
Diexi, China is an ecologically fragile mountainous area with complex geological conditions, frequent earthquakes and various human engineering activities. In order to avoid the recurrence of major catastrophes such as the Xinmocun landslide, the early identification of landslides must be performed. This study adopts deformation characteristics from SBAS-InSAR data as the key information source, and integrates it with Google Earth, GF-1, GF-2, ZY-3 and UAV imagery, as well as DEM data and field investigations of the Tuanjiecun potential landslide to analyze the failure mechanism. Low resolution data is used for the initial investigation, while high resolution data is employed for further analysis and to verify the initial investigation. This progressive identification method improves the safety and efficiency of potential landslide investigations. The proposed approach effectively transforms landslide identification into potential landslide identification, and can complete the monitoring of a specific landslide at the early stage.
The LSTM method is a machine learning prediction approach that employs the cumulative displacement to predict the future settlement based on the existing displacement information. It can overcome the disadvantages of traditional methods that relay on manual field measurements of deformation. This method can effectively predict the deformation in a certain period. The Tuanjiecun potential landslide is predicted to remain stable for the following several years in the absence of extreme events. This provides immediate risk aversion and guidance for the establishment of an effective disaster system.
This article solves the problem of determining and analyzing the evolution of a potential landslide, changing the landslide research from passive avoidance to active prevention. The Tuanjiecun potential landslide deformation was observed to occur prior to 2014 due to the lack of historical data; however, the specific time at which it began remains unknown. The deformation position can only be identified from the existing data, while the initial deformation value requires further research.
Acknowledgements
This research was supported by the National Key Research and Development Program of China (No. 2022YFC3080200, No. 2017YFC1501004), and the National Nature Science Foundation of China (No. 42022053, No. 41877220). The authors highly appreciate anonymous reviewers and the Editor for their constructive comments that helped us to improve the paper.
Authors’ Contributions
Y.L. finished the Investigation, Methodology, Software, Formal analysis, Writing – original draft. P.X. finished the Conceptualization, Investigation, Writing – review & editing, Project administration, Funding acquisition. C.C. finished the Validation, Writing, Investigation, Project administration. W.Z. finished the Conceptualization, Methodology, Validation, Investigation. M.Z. finished the Validation, Software, Data curation. K.Z. finished the Formal analysis, Data curation. All authors reviewed the manuscript.
Disclosure Statement
The authors declare that they have no known competing financial interests or personal relationships that could have appeared to influence the work reported in this article.
Data Availability
The datasets used and analysed during the current study available from the corresponding author on reasonable request.
References
- Angeli M-G, Pasuto A, Silvano S. 2000. A critical review of landslide monitoring experiences. Eng Geol. 55(3):133–147.
- Azarafza M, Ghazifard A, Akgün H, Asghari-Kaljahi E. 2018. Landslide susceptibility assessment of South Pars Special Zone, southwest Iran. Environ Earth Sci. 77:1–29.
- Azarafza M, Azarafza M, Akgün H, Atkinson PM, Derakhshani R. 2021. Deep learning-based landslide susceptibility mapping. Sci Reports. 11(1):24112.
- Bao L, Zhang G, Hu X, Wu S, Liu X. 2021. Stage division of landslide deformation and prediction of critical sliding based on inverse logistic function. Energies. 14(4)
- Bouali EH, Oommen T, Escobar-Wolf R. 2019. Evidence of instability in previously-mapped landslides as measured using GPS, optical, and SAR data between 2007 and 2017: a case study in the Portuguese Bend Landslide Complex, California. Remote Sens. 11(8).
- Cai J, Liu G, Jia H, Zhang B, Wu R, Fu Y, Xiang W, Mao W, Wang X, Zhang R. 2022. A new algorithm for landslide dynamic monitoring with high temporal resolution by Kalman filter integration of multiplatform time-series InSAR processing. Int J Appl Earth Observ Geoinf. 110.
- Cao C, Zhang W, Chen J, Shan B, Song S, Zhan J. 2021. Quantitative estimation of debris flow source materials by integrating multi-source data: a case study. Eng Geol. 291:106222.
- Cao C, Zhu K, Song T, Bai J, Zhang W, Chen J, Song S. 2022. Comparative study on potential landslide identification with ALOS-2 and Sentinel-1A data in heavy forest reach, Upstream of the Jinsha River. Remote Sens. 14(9):1962.
- Chung C-C, Lin C-P, Ngui YJ, Lin W-C, Yang C-S. 2022. Improved technical guide from physical model tests for TDR landslide monitoring. Eng Geol. 296.
- Cui S, Wu H, Pei X, Yang Q, Huang R, Guo B. 2022. Characterizing the spatial distribution, frequency, geomorphological and geological controls on landslides triggered by the 1933 Mw 7.3 Diexi Earthquake, Sichuan. China Geomorphol. 403:108177.
- Dong J, Zhang L, Li M, Yu Y, Liao M, Gong J, Luo H. 2018. Measuring precursory movements of the recent Xinmo landslide in Mao County, China with Sentinel-1 and ALOS-2 PALSAR-2 datasets. Landslides. 15(1):135–144.
- Du J, Yin K, Lacasse S. 2013. Displacement prediction in colluvial landslides, three Gorges reservoir, China. Landslides. 10(2):203–218.
- Eker R, Aydın A. 2021. Long-term retrospective investigation of a large, deep-seated, and slow-moving landslide using InSAR time series, historical aerial photographs, and UAV data: the case of Devrek landslide (NW Turkey). Catena. 196:104895.
- Fan X, Xu Q, Scaringi G, Dai L, Li W, Dong X, Zhu X, Pei X, Dai K, Havenith H-B. 2017. Failure mechanism and kinematics of the deadly June 24th 2017 Xinmo landslide, Maoxian, Sichuan, China. Landslides. 14(6):2129–2146.
- Fobert M-A, Singhroy V, Spray JG. 2021. InSAR monitoring of landslide activity in Dominica. Remote Sens. 13(4):815.
- Frattini P, Crosta GB, Rossini M, Allievi J. 2018. Activity and kinematic behaviour of deep-seated landslides from PS-InSAR displacement rate measurements. Landslides. 15(6):1053–1070.
- Gao Y, Chen X, Tu R, Chen G, Luo T, Xue D. 2022. Prediction of landslide displacement based on the combined VMD-stacked LSTM-TAR model. Remote Sens. 14(5).
- Gao H, He L, He Z-w, Bai W-q 2022. Early landslide mapping with slope units division and multi-scale object-based image analysis—A case study in the Xianshui river basin of Sichuan, China. J Mt Sci. 19(6):1618–1632.
- Huang F, Yin K, Zhang G, Gui L, Yang B, Liu L. 2016. Landslide displacement prediction using discrete wavelet transform and extreme learning machine based on chaos theory. Environ Earth Sci. 75(20):1–18.
- Jibson RW. 2007. Regression models for estimating coseismic landslide displacement. Eng Geol. 91(2–4):209–218.
- Kalantar B, Ueda N, Saeidi V, Ahmadi K, Halin AA, Shabani F. 2020. Landslide susceptibility mapping: machine and ensemble learning based on remote sensing big data. Remote Sens. 12(11):1737.
- Lauknes T, Dehls J, Larsen Y, Henderson I, Zebker H. 2007. Regional landslide mapping and monitoring in norway using SBAS InSAR. In: AGU Fall Meeting Abstracts, G53A-08.
- Li M, Zhang L, Ding C, Li W, Luo H, Liao M, Xu Q. 2020. Retrieval of historical surface displacements of the Baige landslide from time-series SAR observations for retrospective analysis of the collapse event. Remote Sens Environ. 240.
- Li Y, Chen J, Zhou F, Song S, Zhang Y, Gu F, Cao C. 2020. Identification of ancient river-blocking events and analysis of the mechanisms for the formation of landslide dams in the Suwalong section of the upper Jinsha River, SE Tibetan Plateau. Geomorphology. 368:107351.
- Lian C, Zeng Z, Yao W, Tang H. 2015. Multiple neural networks switched prediction for landslide displacement. Eng Geol. 186:91–99.
- Lian C, Zeng Z, Yao W, Tang H, Chen CLP. 2016. Landslide displacement prediction with uncertainty based on neural networks with random hidden weights. IEEE Trans Neural Netw Learn Syst. 27(12):2683–2695.
- Liao K, Wu Y, Miao F, Li L, Xue Y. 2021. Time-varying reliability analysis of Majiagou landslide based on weakening of hydro-fluctuation belt under wetting-drying cycles. Landslides. 18(1):267–280.
- Liu Z, Shao J, Xu W, Chen H, Shi C. 2014. Comparison on landslide nonlinear displacement analysis and prediction with computational intelligence approaches. Landslides. 11(5):889–896.
- Long J, Li C, Liu Y, Feng P, Zuo Q. 2022. A multi-feature fusion transfer learning method for displacement prediction of rainfall reservoir-induced landslide with step-like deformation characteristics. Eng Geol. 297.
- Lucieer A, Jong S, Turner D. 2014. Mapping landslide displacements using structure from Motion (SfM) and image correlation of multi-temporal UAV photography. Prog Phys Geogr. 38(1):97–116.
- Mantovani F, Soeters R, Van Westen C. 1996. Remote sensing techniques for landslide studies and hazard zonation in Europe. Geomorphology. 15(3–4):213–225.
- McCann D, Forster A. 1990. Reconnaissance geophysical methods in landslide investigations. Eng Geol. 29(1):59–78.
- Mengistu F, Suryabhagavan K, Raghuvanshi TK, Lewi E. 2019. Landslide Hazard zonation and slope instability assessment using optical and InSAR data: a case study from Gidole town and its surrounding areas, southern Ethiopia. Remote Sens Land. 3(1):1–14.
- Mondini AC, Guzzetti F, Chang K-T, Monserrat O, Martha TR, Manconi A. 2021. Landslide failures detection and mapping using Synthetic Aperture Radar: past, present and future. Earth-Sci Rev. 216.
- Nanehkaran YA, Mao Y, Azarafza M, Kockar MK, Zhu H-H. 2021. Fuzzy-based multiple decision method for landslide susceptibility and hazard assessment: a case study of Tabriz, Iran. Geomech Eng. 24(5):407–418.
- Nikoobakht S, Azarafza M, Akgün H, Derakhshani R. 2022. Landslide susceptibility assessment by using convolutional neural network. Appl Sci. 12(12):5992.
- Nourani V, Alami MT, Aminfar MH. 2009. A combined neural-wavelet model for prediction of Ligvanchai watershed precipitation. Eng Appl Artif Intell. 22(3):466–472.
- Pecoraro G, Calvello M, Piciullo L. 2018. Monitoring strategies for local landslide early warning systems. Landslides. 16(2):213–231.
- Rib HT, Liang T. 1978. Recognition and identification. Transportation Research Board Special Report. 176.
- Saba SB, van der Meijde M, van der Werff H. 2010. Spatiotemporal landslide detection for the 2005 Kashmir earthquake region. Geomorphology. 124(1–2):17–25.
- Sauchyn DJ, Trench N. 1978. Landsat applied to landslide mapping. Photogramm Eng Remote Sens. 44(6):735–741.
- Scaioni M. 2013. Remote sensing for landslide investigations: from research into practice. In: MDPI, p. 5488–5492.
- Sezer E. 2010. A computer program for fractal dimension (FRACEK) with application on type of mass movement characterization. Comput Geosci. 36(3):391–396.
- Shankar H, Singh D, Chauhan P. 2022. Landslide deformation and temporal prediction of slope failure in Himalayan terrain using PSInSAR and Sentinel-1 data. Adv Space Res.
- Turner D, Lucieer A, De Jong SM. 2015. Time series analysis of landslide dynamics using an unmanned aerial vehicle (UAV). Remote Sens. 7(2):1736–1757.
- Wang H, Liu S, Xu W, Yan L, Qu X, Xie W-C. 2020. Numerical investigation on the sliding process and deposit feature of an earthquake-induced landslide: a case study. Landslides. 17(11):2671–2682.
- Wang Y, Tang H, Huang J, Wen T, Ma J, Zhang J. 2022. A comparative study of different machine learning methods for reservoir landslide displacement prediction. Eng Geol. 298
- Wasowski J, Bovenga F. 2014. Investigating landslides and unstable slopes with satellite Multi Temporal Interferometry: current issues and future perspectives. Eng Geol. 174:103–138.
- Xie P, Zhou A, Chai B. 2019. The application of long short-term memory (LSTM) method on displacement prediction of multifactor-induced landslides. IEEE Access. 7:54305–54311.
- Zhang Y, Tang J, Cheng Y, Huang L, Guo F, Yin X, Li N. 2022. Prediction of landslide displacement with dynamic features using intelligent approaches. Int J Mining Sci Technol. 32(3):539–549.
- Zhang Y, Wang X, Tang H. 2019. An improved Elman neural network with piecewise weighted gradient for time series prediction. Neurocomputing. 359:199–208.
- Zhang X, Zhu C, He M, Dong M, Zhang G, Zhang F. 2021. Failure mechanism and long short-term memory neural network model for landslide risk prediction. Remote Sens. 14(1):166.
- Zhao C, Lu Z, Zhang Q, de La Fuente J. 2012. Large-area landslide detection and monitoring with ALOS/PALSAR imagery data over Northern California and Southern Oregon, USA. Remote Sens Environ. 124:348–359.
- Zhuang Y, Xing A, Leng Y, Bilal M, Zhang Y, Jin K, He J. 2021. Investigation of characteristics of long Runout landslides based on the multi-source data collaboration: a case study of the Shuicheng Basalt Landslide in Guizhou, China. Rock Mech Rock Eng. 54(8):3783–3798.