
 ?Mathematical formulae have been encoded as MathML and are displayed in this HTML version using MathJax in order to improve their display. Uncheck the box to turn MathJax off. This feature requires Javascript. Click on a formula to zoom.
Abstract
Bamboo groves predominantly thrive in tropical or subtropical regions. Assessing the efficacy of remote sensing data of various types in extracting bamboo forest information from bright and shadow areas is a critical issue for achieving precise identification of bamboo forests in complex terrain. In this study, 34 features were obtained from Sentinel-1 SAR and Sentinel-2 optical images using the Google Earth Engine platform. The normalized shaded vegetation index (NSVI) was then employed to segment the bright and shadow woodlands. Different features from diverse data sources were evaluated to extract bamboo forest information in the bright and shadow areas, then use the random forest (RF) classification algorithm to extract bamboo forest. The results showed that (1) the red-edge and short-wave infrared bands of Sentinel-2 optical images and their corresponding vegetation indices are significant in bamboo forest information extraction. (2) The dissimilarity and homogeneity of Sentinel-2 texture features in the bright area and dissimilarity in the shadow area, the Sentinel-1 backscatter features in the bright area and the VV and VH in the bright area and VV-VH in the shadow area have some variability between bamboo and nonbamboo forests, which can be used as effective features for bamboo forest extraction. (3) The combination of spectral, texture and backscatter features yields the highest overall classification accuracy and Kappa coefficient, at 87.96% and 0.7435, respectively. This study has the potential for remote sensing refinement of bamboo forest identification in complex terrain areas by utilizing subregion classification methods combined with optical and radar image features.
1. Introduction
Bamboo forests are a particular and essential forest type in tropical and subtropical regions, where they play an essential role in forest ecosystems (Xu et al. Citation2016). There are various types of bamboo forests, characterized by their fast growth and high yield and short-cutting cycles. The global area covered by bamboo forests is continually increasing (Li et al. Citation2015). China has the largest area of bamboo forests in the world, accounting for 20.6% of the total (Du et al. Citation2018). China’s Ninth National Forest Resources Inventory (2014–2018) indicated that the bamboo forest area in China had reached 64,116 km2, accounting for 2% of forest land and 3% of forested areas. Moso bamboo (Phyllostachys pubescens) forest covers an area of 46,778 km2, making up 73% of the total bamboo forest area (Zhou and Jiang Citation2004; Fei and Qi Citation2020). Moso bamboo forests are distributed in over ten provinces, with more than 7000 km2 located in four provinces, namely Fujian, Jiangxi, Hunan and Zhejiang, totaling 37,062 km2 and accounting for 79.2% of China’s Moso bamboo forest area. The rapid growth and carbon sequestration of Moso bamboo forests provide them with strong carbon storage potential, 1.39 to 2.39 times that of Chinese fir forests under the same environmental conditions, and 1.33 times that of tropical rainforests (Xiao et al. Citation2007; Yen and Lee Citation2011; Yuen et al. Citation2017). With the increasing area of bamboo forests, the carbon storage of Chinese bamboo forests is expected to continue to increase (Chen et al. Citation2008). According to the ‘China Bamboo Industry Development Plan (2013–2020)’, the annual output value of China’s bamboo industry reached 43,734,966,105.4 USD in 2020, with employment of 10 million people (Fei et al. Citation2021). Therefore, to achieve the scientific management of bamboo resources, timely understanding of the extent and distribution of bamboo forests is an important consideration.
Remote sensing data sources are the basis for bamboo forest information extraction (Tamang et al. Citation2022). Compared with nonoptical satellite and unmanned aerial vehicle-based remote sensing, optical satellite remote sensing exhibits the advantages of multiple sensors, comprehensive coverage, high temporal-spectral resolution. It is currently the primary data source for land resource remote sensing monitoring, with ASTER, Landsat, WorldView-2 and MODIS have been widely used for bamboo forest resource monitoring (Ghosh and Joshi Citation2014; Du et al. Citation2018; Greig et al. Citation2018; Chaves et al. Citation2021). However, the lower spatial resolution of these data can aggravate the influence of uncertainties such as mixed pixels and missing surface information, limiting their applications in fragmented landscapes and heterogeneous areas (Wan et al. Citation2019). In addition, traditional multispectral images, such as Landsat TM/ETM+/OLI, tend to exhibit saturation effects in the red and near-infrared bands in highly vegetated areas (Deventer et al. Citation2019). Compared to other optical satellites such as the Landsat series, Sentinel-2 satellite imagery has higher spatial and temporal resolution, a wider spectral range and is currently the only satellite with three bands in the red-edge region, which has great advantages for monitoring vegetation growth and health (Kaplan and Avdan Citation2019). However, due to the influence of the subtropical monsoon climate in the subtropical region, the rainy season is long and the persistent cloud cover makes it difficult to obtain high-quality Sentinel-2 optical satellite imagery, which to some extent limits the accurate extraction of bamboo forest information. To overcome this limitation, researchers have processed the optical remote sensing data by removing clouds and smoothing curves to improve the quality of optical images. However, cloud removal can only reduce the noise impact to a certain extent and cannot fundamentally eliminate local noise (Liu et al. Citation2010; Xu et al. Citation2017).
Synthetic aperture radar (SAR) images has the advantages of high spatial and temporal resolution, independent of clouds and rain and strong penetration, which compensate for the shortcomings of optical satellite image. It is frequently used in flood monitoring, tree species classification, crop identification and biomass estimation (Kersten et al. Citation2018; Martone et al. Citation2018; Zhang et al. Citation2018). SAR actively emits electromagnetic signals from the sensor and then receives electromagnetic echo signals from the ground to obtain ground information. Previous research has demonstrated that the penetration of the vegetation canopy increase with increasing microwave wavelength. For example, the P-band and L-band can interact with the tree branches, trunks and ground elements under the forest canopy and the radar echoes will be mixed with a large amount of microwave scattering information from the underlying surface (Zeng et al. Citation2015). On the contrary, shorter wavelengths, such as the C-band and X-band, mainly interact with canopy elements, and their backscatter signals can more comprehensively reflect the vertical structure information of plants (Periasamy Citation2018). As a result, SAR data in the short-wave band has been used for bamboo forest monitoring and has achieved good results (Liu et al. Citation2016). However, the feasibility of X-band SAR data is limited by its high cost and complexity. Sentinel-1, as a noncommercial satellite with dual-polarization and C-band sensors, offers a valuable option for bamboo forest resource monitoring. Cai et al. (Citation2019) research shows that the backscatter coefficient of Sentinel-1 has a higher contribution in land use classification and can achieve the highest overall accuracy (OA) and Kappa coefficient. Therefore, this study used the backscatter coefficient of Sentinel-1 to extract bamboo forest information.
However, at the same geographical resolution, using SAR data to classify is typically less accurate than optical data. The combination of optical and SAR data for land use classification and tree species mapping has better classification accuracy than single optical or SAR data (Zhang and Xu Citation2018; Guo et al. Citation2019; Shuai et al. Citation2019). Liu et al. (Citation2016) used the bidimensional empirical mode decomposition (BEMD) algorithm to fuse data from GF-1 image multispectral band, panchromatic band and TerraSAR-X band, and the results showed that the BEMD method can effectively enhance the accuracy of bamboo forest classification, and the fused data also have better interpretation accuracy. Dida et al. (Citation2021) used Sentinel 1 and Sentinel 2 data and their vegetation indices to map bamboo coverage in Iloilo Province, Philippines. As a result, it is necessary to combine multisource remote sensing data for bamboo forest information extraction at the regional or global scale, which has significant advantages.
Bamboo prefers a warm and humid climate. In China, bamboo forests are mainly distributed in the southern mountainous and hilly areas. Due to the comprehensive effects of solar incidence angle, satellite yaw, object height and terrain undulation, there are generally a large number of shadows in remote sensing images. The grayscale value difference between bright and shadow forest land pixels on the same image is large, and due to the high forest cover, there is strong interference between different land covers, and bamboo is prone to ‘same spectrum for different objects, different spectra for the same object’ with other vegetation. Therefore, when classifying vegetation in mountainous areas, if the bright and shadow areas are not distinguishable, there will be more misclassification and omission, which makes accurate identification of bamboo forest information difficult (Li et al. Citation2006; Jing et al. Citation2008). Remote sensing image shadow detection broadly includes two types of methods, model-based and shadow attribute-based, while shadow attribute-based methods mainly use attributes such as spectra, textures and geometric shapes of shadow regions to detect shadows, among which, shadow indices have been favored by many scholars with the advantages of fast calculation and wider application (Zhou et al. Citation2011; Xu ZH et al. Citation2018; Liu et al. Citation2019). In this study, we have selected the Google Earth Engine (GEE) cloud platform for its high-performance computing capabilities (Gorelick et al. Citation2017). We have differentiated between forest and bamboo forest in bright and shadow areas based on the Normalized Shadow Vegetation Index (NSVI), and have extracted information on bamboo forests using subregions methods.
In this study, we aimed to carry out bamboo forest information subregions extraction using Sentinel-1/2 data from the GEE platform. The study’s specific objectives were: (1) explore the feasibility of combining Sentinel-1 SAR and Sentinel-2 MSI data to extract bamboo forest information based on segmenting bright and shadow woodlands; (2) evaluate the contribution of different features from different data sources to bamboo forest information extraction in bright and shadow areas; (3) design different feature combination schemes for bamboo forest information extraction and accuracy evaluation to obtain the optimal classification strategy.
2. Study area and data
2.1. Study area
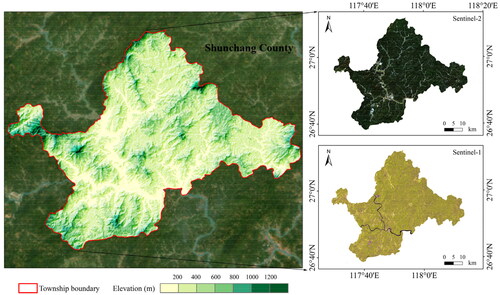
The experimental area () is located in Shunchang County, northwestern Fujian Province, at the southern foot of the Wuyi Mountains. The experimental area is located near the crossroads of the provinces of Fujian, Zhejiang and Jiangxi, with latitude and longitude ranges of 117°30′–118°14′ E and 26°39′–27°12′ N with a total area of around 1985 km2. The area is dominated by mountainous and hilly terrain, with complex and diverse topography. It is perennially influenced by a tropical monsoon climate, with an average temperature of 18.5 °C and an average annual rainfall of 1756 mm. These conditions provide a unique advantage for the growth of bamboo forests. The county lies in a significant forest area in southern China, with a forest coverage rate of 79.9%, and the primary grass and tree species include moso bamboo, fir wood (Cunninghamia lanceolata), horsetail pine (Pinus massoniana), broad-leaved forest and orchard. Among them, the bamboo forest has a standing stock of 110 million culms, making it one of the ‘Top Ten Bamboo Towns in China’.
Figure 1. Study area. The R:G:B composite of Sentinel-2 optical image and VV:VH:ratio composite of Sentinel-1 radar image on the right side, respectively.
2.2. Data and preprocessing
2.2.1. Remote sensing data
Sentinel-1 and Sentinel-2 data were invoked and preprocessed in this study by writing code on the GEE platform. Sentinel-1 active microwave remote sensing satellite consists of two satellites, A and B, carrying C-band sensors. A single satellite’s interval is 12-days, while the observations of the two satellites complement each other with a 6-day revisit interval. We used the GEE platform’s ground range detected (GRD) product, which was preprocessed with the Sentinel-1 toolbox, including orbital parameter calibration, boundary noise removal, thermal noise removal, radiometric calibration and terrain correction. The Sentinel-1A composite image was created by selecting interferometric wide swath (IW) imaging mode images, applying coherent speckle filtering to each image using the Refined Lee filter, calculating the mean values of the backscatter coefficients VV and VH, and then, normalizing the radiometric topography to each image(Mullissa et al. Citation2021).
Sentinel-2 records information about the Earth’s surface in 13 spectral bands, ranging from visible to short-wave infrared (SWIR) regions, with spatial resolutions ranging from 10 to 60 m. The GEE platform’s Sentinel-2 Level-2A product was chosen for this study, which was atmospherically corrected and obtained by running the Sen2cor plug-in provided by ESA, contains 12 unsigned integer spectral bands, eight bands specific to Level-2A and 3 QA bands, of which the QA60 band contains cloud probability and cloud mask information, which can be used to remove cirrus and thick clouds from the images. The images with less than 10% clouds are filtered based on the cloud content ranking, the values of Bit10 and Bit11 in the QA60 band were calculated, and both values were set to 0 to obtain the cloud mask. The cloud information in the image was removed in batch using the cloud mask and cloud probability to obtain the Sentinel-2 cloud-free synthetic image finally.
According to the statistics of Sentinel-1 and Sentinel-2 remote sensing images covering the study area in 2020 (Supporting Information Figure 1S), it was found that the total observation data of Sentinel-1 was on average once every 8 days, while the total observation data of Sentinel-2 was on average once every 2 days, with an average of once every 8 days in most parts of the study area. Further analysis of the number of Sentinel-2 remote sensing images in each month in 2020 (Supporting InformationFigure 2S) revealed that the climate in the southeastern coastal region is often cloudy and rainy, and the study area had only 50 Sentinel-2 images available in each month, with only 3–15 of them being usable due to cloud cover. In March, May, June, July and December, there were severe cloud cover and no usable images, making it difficult to extract vegetation information based on optical satellite remote sensing images. In order to obtain cloud-free images of the study area and based on field investigations, a total of 21 Sentinel-1/2 remote sensing images from October 2020 were selected to extract information on the bamboo forest in the study area, including 6 Sentinel-1 and 15 Sentinel-2 images ().
Figure 2. Location of samples used in validation, including bamboo forest and nonbamboo forest. (a, b) bamboo forest sample. (c, d) nonbamboo forest sample. Base maps are Google Earth images.
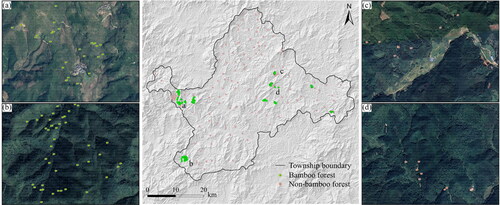
Table 1. The dataset used in this study.
2.2.2. Sample data
The normalized difference vegetation index (NDVI) was used to extract woodland information by Otsu algorithm, the NSVI was used to segment the woodland into nonshadow and shadow areas, which we refer to as bright and shadow areas in this study, and the land cover types of bright and shadow areas were determined synthetically using Google Earth images, Forestry Class II subcompartment data and field data. The sample selection procedure is as follows: (1) online selection of bamboo and nonbamboo forest samples in bright and shadow areas on Sentinel-2 data; (2) the samples were exported to KML format and then imported into the Google Earth platform, where their accuracy was verified using contemporaneous high-resolution base maps. Different sample points were generated by the random sampling method, and the sample size is shown in .
Table 2. Sample data.
2.2.3. Validation data
Between 15 September 2020 and 25 September 2020, we conducted fieldwork in subcompartments, collecting coordinate information for more than 70 Moso bamboo forest sample sites using handheld GNSS, each of sample sites was 25 m 25 m in size, with more than 85% of Moso bamboo forests having relatively pure cover types. Meanwhile, 465 sample points were obtained using Google Earth images from the same period, including 287 bamboo forest sample points and 178 nonbamboo forest sample points (). These sample points were not used in the classification and were only used to validate the classification result.
3. Methodology
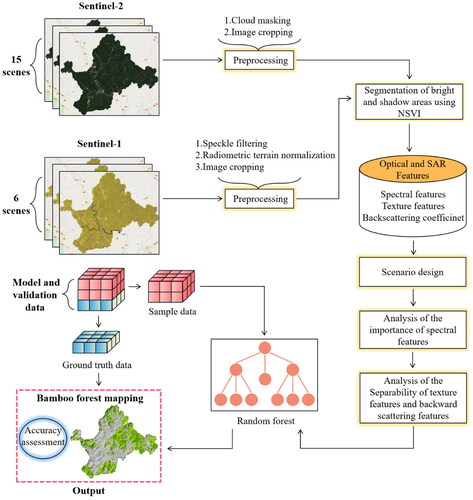
The following processes made up the overall workflow utilized for mapping bamboo forests, which is shown in : (1) remote sensing data collection and processing; (2) optical and SAR features selection; (3) models design; (4) classification accuracy assessment.
Figure 3. Flow chart of the proposed bamboo forest information extraction method.
3.1. Optical and SAR features selection
One of the most crucial aspects of image classification is the selection of feature variables. The scientific use of several feature variables and the combination of feature variables can significantly enhance classification accuracy. Based on Sentinel-1 and Sentinel-2 data, 34 feature variables, including 23 spectral features, 7 texture features and 4 backward scattering coefficient features, were chosen to participate in remote sensing extraction of bamboo forest information in this study.
Based on existing research on vegetation indices and bamboo forest information extraction from optical remote sensing images, the spectral differences between bamboo forests and other vegetation are concentrated in the NIR and SWIR1 bands during the autumn and winter (Wang et al. Citation2009; Guan et al. Citation2012). The red-edge band of Sentinel-2 has the same reflectance as NIR band, which can be used to distinguish bamboo forest from other vegetation. Meanwhile, bamboo forests have a clustered canopy structure, and their canopy texture is bright and distinct from other forest types. The development of texture characteristics also aids in extracting bamboo forest information (Liu et al. Citation2018). Therefore, in this study, 5 vegetation indices, 8 red edge indices and 7 texture features of the first principal component band of the Sentinel-2 image collection were calculated by the GEE platform (Supporting Information), which were added to the original bands as independent spectral bands to participate in the classification.
Different polarization modes’ backscatter coefficients, and the corresponding difference (Diff) and ratio (Ratio) values, have been demonstrated to be relevant for image classification (Dong et al. Citation2012). The following equations were used to calculate the Diff and Ratio of VV and VH, and a total of four backscatter features, VV, VH, Diff and Ratio, were selected as Sentinel-1 input variables.
(1)
(1)
(2)
(2)
where VV and VH are the VV polarization backscatter coefficient and VH polarization backscatter coefficient, respectively.
3.2. Feature selection method
Multisource remote sensing features fully use the spectral and spatio-temporal information of images, providing more information for feature interpretation and image classification. However, the number of features is not as large as possible; too many features are prone to low processing efficiency and redundancy of information, which can cause the ‘Hughes phenomenon’ and affect the model’s classification performance (Zhang Citation2016). Therefore, it is of great importance to reduce the number of feature dimensions and select feature variables correctly for accurate feature recognition. In this study, random forest (RF) importance ranking and recursive feature elimination (RFE) algorithms were used to evaluate the importance of Sentinel-2 feature variables in bright and shadow areas.
The RF is an algorithm that ensembles multiple decision trees for learning. RF introduces more randomness in tree growth and searches for the best features in a randomly generated subset of features. The importance of a feature can be estimated by calculating the average depth of the feature across all trees in the forest (Liang et al. Citation2020). In this study, a RF algorithm based on the Gini index is used to evaluate feature importance and to prefer features.
The RFE algorithm is a greedy algorithm to find the optimal feature subset. The algorithm first uses all the features as the initial features, then, uses the RF algorithm to calculate the feature weights, sorts the features according to the size of the weights, removes one feature with the smallest weight each time, uses the OA as the accuracy evaluation criterion and so forth iteratively until the feature set is empty, and outputs the feature combined with the highest accuracy evaluation (Jeon and Oh Citation2020). In this study, the RFE module of scikit-learn was used to implement feature elimination, and the RFECV module is used for cross-validation to rank the features.
3.3. Classification algorithm
The RF algorithm, proposed by Breiman in 2001 (Breiman Citation2001), combines Bagging integrated learning theory with a stochastic subspace approach, which has unique advantages in processing high-dimensional data and building decision trees (Belgiu and Drăgut Citation2016) and has been widely used in many fields such as land-use change mapping, and is considered to have more robust classification results for multidimensional classification features (Rodriguez-Galiano et al. Citation2012; Gong et al. Citation2013).
The basic process includes: (1) N sets of training sets are randomly selected from training samples with put-back repetitions by Bootstrap; (2) N decision tree models are obtained using N sets of training sets, and in a single decision tree, m (m < M) features are randomly selected from M feature variables for internal node division, and this node division method is chosen as Gini index; (3) All decision tree models are integrated results and finally determine the new category using majority voting.
The number of decision trees (N) and the number of features input at node splitting (M) must both be specified for the RF model. In existing studies (Belgiu and Drăgut Citation2016), the M is used when the following values are used (the M is fixed at 500): (1) one-third of all features; (2) the square root of all features; (3) one-half of all features; (4) two-thirds of all features; (5) all features, classification accuracy varies only slightly. Therefore, according to the literature, we used the RF algorithm provided by the GEE platform to set the M as the square root of the total number of features, and the N is parameterized to find the optimal number.
3.4. Feature model design
To evaluate the potential of Sentinel-2 spectral features, texture features and Sentinel-1 backscatter coefficient features for bamboo forest information extraction, we designed four feature models () as the input features of the classifier for feature classification to compare the performance of Sentinel-1/2 data and their features in terms of classification accuracy improvement in bright and shadow areas: (1) FM1 was built using Sentinel-2 original bands, vegetation indices and red-edge features to examine the ability of Sentinel-2 spectral features to extract bamboo forest information; (2) FM2 was built to contrast classification accuracy with and without texture features; (3) FM3 was built to examine the potential of Sentinel-1 backscatter coefficient features for bamboo forest information extraction; (4) FM4 was the integration of Sentinel-1 backscatter coefficient features, Sentinel-2 spectral features and texture features, with the goal of determining whether combining SAR and optical features may increase classification accuracy.
Table 3. Four feature models for bamboo forest mapping.
3.5. Classification accuracy assessments
In this study, based on field research and 465 sample points collected in Google Earth, a confusion matrix was utilized to assess the classification accuracy of four feature models, including Producer’s accuracy (PA), User’s accuracy (UA), OA and Kappa coefficient.
4. Results
4.1. Analysis of the importance of spectral features
The RF was used to calculate the importance percentages and cumulative percentages of various spectral features in bright and shadow areas (). In the bright area, the vegetation indices NDMI and MVI had the highest importance with 20.5% and 15%, followed by the SWIR bands B12 and B11 with 14.6% and 13.6%, and the red-edge band B5 with higher importance of 9.4%. In the shadow area, the red-edge indices MSAVI and NDre1 have the highest importance with 10.5% and 9.1%, respectively; followed by the vegetation index NDVI with the importance of 8.5%; followed by the near-infrared band B4 and SWIR band B12 with the importance of 8.4% and 8.2%, respectively; the red-edge indices NDre2 and NDVIre1 have the higher importance of 6% and 4.5%, respectively.
Figure 4. Importance ranking of Sentinel-2 original bands, vegetation index and red edge index features. (a) The importance ranking of features in bright areas, (b) the importance ranking of features in shadow areas. The orange represents the original bands, the yellow represents the vegetation index and the blue represents the red edge index and the solid line represents the cumulative percentage of different features from left to right.
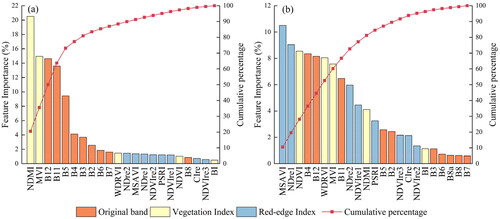
Low luminance is one of the characteristics of shaded areas in remote sensing images, manifested as low spectral reflectance. It can be observed from that the importance of shaded area features is generally lower than that of bright areas. The blue and green bands in bright areas have a higher correlation, while the importance of the green band in shaded areas is relatively reduced compared to the blue band. In the SWIR band, the importance of shaded areas is also lower than that of bright areas. These changes also affect the variations of relevant band features. Assuming the screening criteria for the feature index are met when the cumulative percentage exceeds 95%, the variable combination can be selected when N = 16 in the bright area with a cumulative percentage of 95.13%, and when N = 17 in the shadow area with a cumulative percentage of 95.16%.
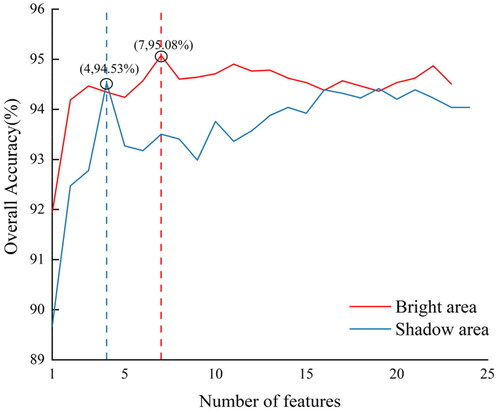
According to the RFE method, the search for the optimal number of features and feature indices continued by cross-validation (). In the bright area, the OA gradually increases from 1 to 7 feature variables, reaching its highest value when the number of feature variables is 7, and the OA is 95.1% with the features combination of NDMI, MVI, B11, B12, B5, B3 and WDRVI; in the shadow area, the OA improves significantly from 1 to 4 feature variables, reaching its highest value when the number of feature variables is 4, and the OA is 94.5% with the features combination of MSAVI, NDVI, B4 and B12.
Figure 5. Bright area and shadow area recursive feature importance evaluation. The solid line represents the overall accuracy (OA). The circles at the intersection of the solid and dashed lines represent the OA corresponding to the best feature dimension. Red and blue represent the bright and shadow areas, respectively.
As a result, summarizing the number of features obtained by the two strategies (), the features screened by the RFE method are included in the RF algorithm, indicating that the algorithm can further eliminate redundant features, B5 and MSAVI in the common features of bright and shadow regions, both of which are associated with the red-edge band while combining with , it can be seen that the red-edge band and the SWIR band are more important in the bamboo forest information extraction, for the three red-edge bands, the importance ranking is B5 > B6 > B7, which is consistent with the analysis results of the importance ranking of Sentinel-2 spectral features in . Overall, the red-edge bands, the red-edge index and SWIR bands have a high value for bamboo forest information extraction.
Figure 6. Importance ranking of the bright and shadow Sentinel-2 original bands. The horizontal axis represents the 10 original bands of Sentinel-2, and the vertical axis represents the feature importance values of the input variables. The red and blue represent the bright and shadow areas, respectively.
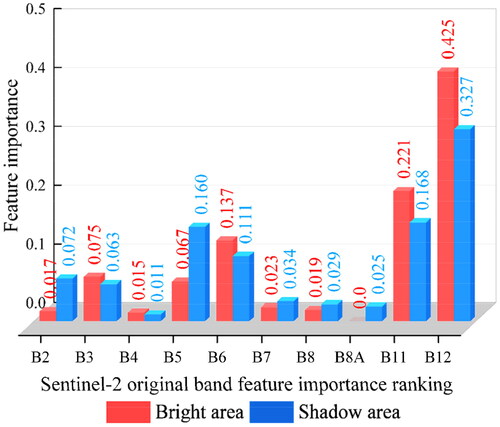
Table 4. Results of feature variable selection for different strategies.
4.2. Analysis of the separability of texture features and backward scattering features
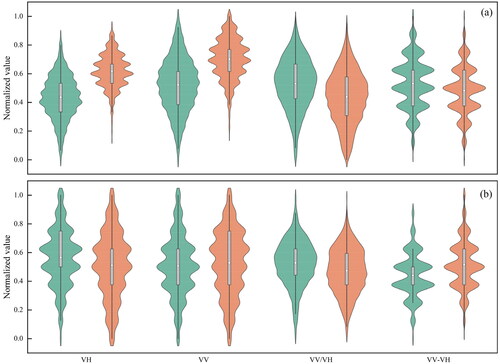
The texture features and backscatter coefficients of bamboo and nonbamboo forests in the bright and shadow areas are extracted separately ( and ), and it can be found that both bamboo and nonbamboo forests have certain separability. In terms of texture features, bamboo forests in the bright area are smaller than nonbamboo forests in terms of homogeneity and larger than nonbamboo forests in terms of dissimilarity, with better separability; bamboo forests in the shadow areas are smaller than nonbamboo forests in terms of dissimilarity, with better separability; bamboo forests were relatively less distinguished from nonbamboo forests in the angular second moment (ASM), contrast, correlation, entropy and variance features. In terms of backscatter coefficient features, bamboo forests in bright areas are smaller than nonbamboo forests in VV and VH features, with better separability and less distinguishable from nonbamboo forests in VV/VH and VV-VH features; bamboo forests in shadow areas are smaller than nonbamboo forests in VV-VH features, with better separability and less distinguishable from nonbamboo forests in VV, VH and VV/VH features. Overall, the Sentinel-2 texture features and Sentinel-1 backscatter coefficient feature can be used effectively for bamboo forest information extraction.
Figure 7. Feature values of bamboo and nonbamboo forests in different areas on texture features. (a) Sentinel-2 texture features in bright areas, (b) Sentinel-2 texture features in shadow areas. The horizontal axis represents the seven texture features of the Sentinel-2 optical image, and the vertical axis represents the features normalized by the min–max method. In the violin box plot, the white point is mean, and the green and orange represent bamboo forest and nonbamboo forest samples, respectively.
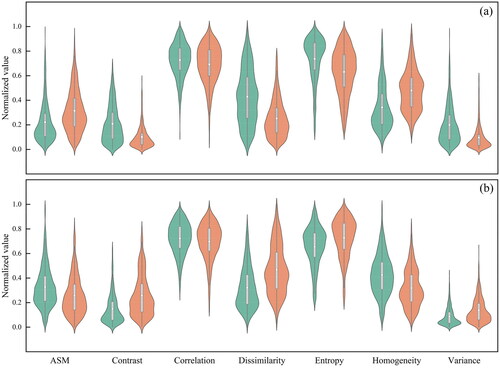
Figure 8. Feature values of backscatter coefficients for bamboo and nonbamboo forests in different areas. (a) Sentinel-1 backscatter coefficient features in bright areas, (b) Sentinel-1 backscatter coefficient features in shadow areas. The horizontal axis represents the four backscatter coefficient features of Sentinel-1 SAR images, and the vertical axis represents the features normalized by the min–max method. In the violin box plot, the white point is mean, and the green and orange represent the bamboo forest and nonbamboo forest samples, respectively.
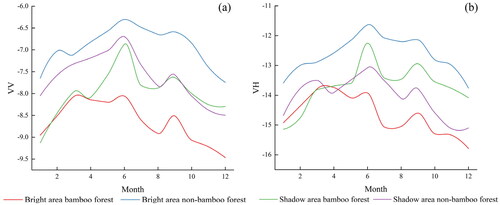
The monthly synthetic Sentinel-1 time series backscatter coefficient characteristic data for 2020 were obtained from the GEE platform (). It can be found that bamboo and nonbamboo forests in the bright and shadow areas exhibit different patterns under the VV and VH polarization modes. In the bright area, the trends of the two polarization modes are similar, the backscatter coefficients of bamboo and nonbamboo forests are more different, and VV and VH feature curves peaks primarily from June to December, which is favorable for the distinguishing bamboo and nonbamboo forests; in the shadow area, the trends of the two polarization modes are slightly different, the backscatter coefficients of bamboo and nonbamboo forests overlap more, and the VV feature curve peaks in April, while the VH feature curves peaks mainly in June and September to December, indicating that these months may be the best time to distinguish between bamboo and nonbamboo forests.
Figure 9. Multi-temporal SAR backscatter of bamboo and nonbamboo forests in bright and shadow areas. (a) VV polarization, (b) VH polarization.
4.3. Bamboo forest extraction and accuracy analysis
Different feature models yielded different classification results using the RF classifier. and shows limited differentiation between bamboo and nonbamboo forests using only Sentinel-2 spectral features. The best classification results were obtained for FM4, which combined Sentinel-2 texture features and Sentinel-1 backward scattering coefficient features for classification. It is difficult to obtain accurate classification maps solely based on spectral features, and the maps have more fine patches. There is an insufficient bamboo forest to accurately distinguish the spectral features of bamboo forest and nonbamboo forest image pixels. Due to the separability of texture features of typical vegetation such as bamboo forests and other tree species, the output of FM2 with added texture features achieves better classification results than FM1. The classification data obtained after including Sentinel-1 features effectively reduces the classification error between bamboo and nonbamboo forests, and the retrieved bamboo forest data is more realistic. In addition, when compared to the first three methods, FM4, which incorporated texture and backscatter coefficient features, reduced the fragmentation of both bamboo and nonbamboo forest classification patches and improved the ‘pretzel phenomenon’.
Figure 10. Four classification results for different combinations of features. (a) FM1, (b) FM2, (c) FM3, (d) FM4.
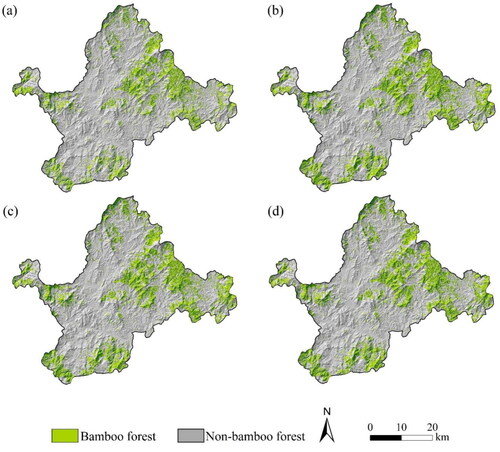
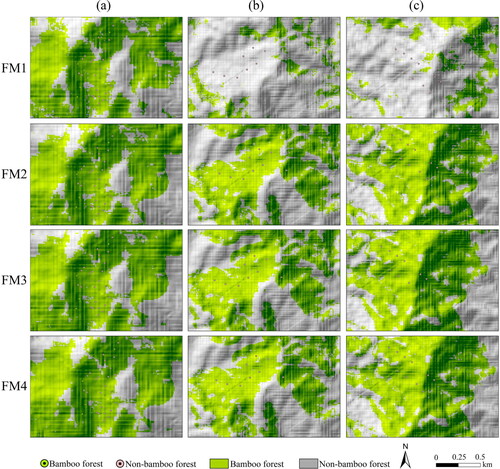
Figure 11. The classification results in three validation regions using four feature models of FM1, FM2, FM3 and FM4.
The classification accuracy was evaluated by calculating the confusion matrix with field validation samples. The UA, PA, OA and Kappa coefficient of the four feature models were counted (). The OA of FM1 based on Sentinel-2 spectral features is 78.5%, and the Kappa coefficient is 0.5773. After adding texture features and backscatter coefficient features to FM1, the classification accuracy of FM2 and FM3 increases slightly, with OA reaching 87.3% and 87.1%, respectively, and the Kappa coefficients are 0.7306 and 0.7263. This indicates that including texture features and backscatter coefficient features will increase the accuracy of information extraction about bamboo forest. This is because the category information carried by each feature may not be represented equally when simply using spectral features overlaid together. However, the introduction of texture features of optical data and backscatter coefficient features of radar data, as well as the sensitivity to feature parameters, can make the features of individual categories more explicitly learned by the model, allowing it to more reasonably and effectively identify multiple features by learning them. Furthermore, FM4, which combines Sentinel-2 texture features and Sentinel-1 backscatter coefficient features for classification, achieves the highest OA and Kappa coefficient of 88% and 0.7435, respectively, which is 0.7% higher in OA and 0.0129 higher in Kappa coefficient than FM2, the best extraction among the previous three models. Since the SAR data are not affected by clouds and rain, and the integration of optical and radar features enhances the differentiability between categories, the best classification accuracy is obtained by adding SAR features.
Table 5. Classification accuracy statistics for different feature models.
4.4. Spatial distribution statistics of bamboo forest
Based on the GEE platform, the topographic factors were extracted from the bamboo forest classification results of the optimal feature combination scheme 4 (). The spatial distribution map of bamboo forests in Shunchang County reveals that the distribution of bamboo resources in Shunchang County is remarkably regular, with bamboo forest area distribution primarily concentrated in the remote surrounding mountains, with less distribution in the central and northwestern parts.
Figure 12. Topographic factor classification map of bamboo forest classification results. (a) Elevation, (b) slope, (c) aspect.
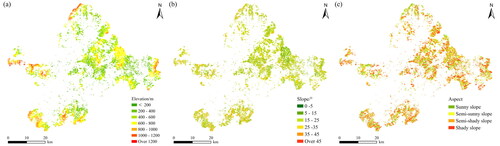
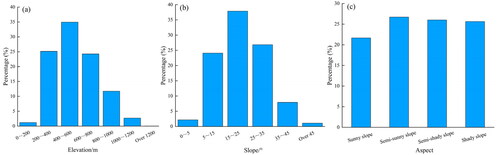
Further analysis of the elevation, slope and aspect of bamboo forest distribution in Shunchang County: (1) seven elevation intervals were set at 200 m (), and the bamboo forests in Shunchang County were mainly distributed in the elevation range of 200–1000 m, accounting for 96.1% of the weight of all bamboo resources, with the largest proportion of bamboo forests in the grade range of 400–600 m accounting for 64% of the total bamboo forest resources, and less in the grade range of 1200–1400 m, accounting for 0.1%. (2) With 5° as an interval range and a total of 6 slope ranges (), bamboo forests in Shunchang County were mainly distributed within the slope range of 5°–35°, accounting for 88.8% of all bamboo resources, with the largest proportion of bamboo forests within the grade range of 15° to 25° making up 37.9% of the total bamboo resources. 37.9%, and less distributed in the range of >45° grade, accounting for 1.1% of the total weight; (3) Using the national forest resources survey standard, the aspect was divided into four grades (), namely, sunny slope (135°–225°), half-sunny slope (90°–135°, 225°–270°), half-shady slope (45°–90°, 270°–315°) and shady slopes (315°–360°, 0°–45°). The analysis shows that the proportion of bamboo forests in Shunchang County is the largest on the semi-positive slope, 26.7%. The smallest on the positive slope, 21.7%, and the sum of the proportion of bamboo forests on the positive and semi-positive slopes is 48.4%, which is smaller than the sum of the proportion of bamboo forests in the negative and semi-positive slopes, 51.6%. The main reason may be that the soil layer in the middle and lower slopes with a gentle slope is deep and fertile, with high moisture accumulation, which is favorable to the growth of bamboo forests. In contrast, the upper slopes with a large slope have a thin soil layer, which is not easy to accumulate moisture, and the bamboo stands do not have high bamboo establishment and poor growth; in summer and autumn during the germination period, there is more precipitation and less water evaporation on the shadow slopes, which is favorable to more germination. This result is in line with the findings of Guang and Fan (Citation2010).
Figure 13. Percentage of bamboo forest classification results for each class under different topographic factors. (a) Elevation, (b) slope and (c) aspect. The horizontal axis represents the interval of terrain factor classification, and the vertical axis represents the percentage of input variables.
5. Discussions
5.1. Impact of Sentinel-1 SAR data on bamboo forest classification
Optical remote sensing images and polarized radar image data are widely used in the research of feature identification extraction. However, a single data source is insufficient to significantly improve the extraction accuracy of bamboo forest information identification, and the fusion and combination of multiple sources of remote sensing data applied to bamboo forest resource monitoring will have more information than a single remote sensing data source. The fused images have better spatial texture and visual differentiation effects. Ning et al. (Citation2022) extracted large-scale regional swamp wetland information from Sentinel-1, Sentinel-2 and topographic data from the GEE platform and discovered that red-edge features, radar features and topographic features improved the mapping accuracy and user accuracy of swamps by 7.6%, 5%, 5%, 5.4%; 4.5%, 4.2%, respectively. The separation obtained from JM distance revealed that red-edge features > other optical features > terrain features > radar features. Arsalan et al. (Citation2021) extracted mangrove information from Sentinel-1 and Sentinel-2 time series data from the GEE platform using a RF algorithm and discovered that the classification accuracy of multisource data, the OA and Kappa coefficient was 93.2% and 0.92, respectively, and the OA and Kappa coefficient of the scenes containing only optical data were 90.7% and 0.89, respectively, which were improved by 2.6% and 0.03, respectively. Although this study demonstrated the feasibility of bamboo forest information extraction by combining Sentinel-1 SAR data and Sentinel-2 optical data from the GEE platform, practical applications have some limitations. Xu W et al. (Citation2018) used Sentinel-l radar remote sensing images to extract swamp vegetation and discovered that the radar-emitted electromagnetic waves were more likely to penetrate the canopy and occur secondary echo scattering when the vegetation was in the deciduous phase by comparing the image extraction backscatter coefficients of different time phases. In this study, radar remote sensing images were acquired in October 2020, when some broad-leaved tree species were preparing to enter the winter dormancy period. The leaves began to fall, and C-band SAR may have acquired the backscatter coefficients close to the ground surface. The difference in backscatter coefficient values between bamboo forest and nonbamboo forest samples became smaller, implying that the contribution of the four radar remote sensing factors in the model was not significant enough compared with the optical feature factors. Furthermore, SAR imaging operates in a side-view environment, with the image produced as a result of the time elapsed between signal transmission and reception; thus, the topography is a surface attribute that affects SAR imaging (Vollrath et al. Citation2020), and the complex topography of the southern mountainous hills can change the way the signal returns to the sensor, resulting in perspective shortening, transit and radar shadowing phenomena, which adds uncertainty to a certain extent to bamboo forest information extraction.
5.2. Applicability of subregion methods to bamboo forest classification
The NSVI was used to divide the bright and shadow areas in this study, which not only ensures the absolute difference between the vegetation in the bright area, the vegetation in the shadow area and the water body area in the NIR band but also significantly enlarges the relative difference between the three areas. Badgley et al. (Citation2017) constructed the same model as shaded vegetation index (SVI), which is a vegetation index before normalization of NSVI, to estimate terrestrial gross primary productivity (GPP), demonstrating the index’s potential in several fields. Furthermore, leaves in bright areas receive more solar radiation and have stronger photosynthesis (Wang et al. Citation2010). Light also directly impact on the transpiration and airflow exchange of leaves (Yayon et al. Citation1984; Sofo et al. Citation2009), with higher stomatal conductance, higher transpiration rate and faster CO and O2 exchange rate under well-lit conditions, resulting in higher maximum net photosynthetic CO2 assimilation rate of leaves (Lichtenthaler et al. Citation2007). In contrast, leaves in shadow areas have a compensatory mechanism to compensate for the lack of light intensity by increasing leaf area and chlorophyll content. The low temperature in the shadow areas also makes them more efficient in carbon sequestration (Emmel et al. Citation2014). Therefore, the precise division of bright and shaded zone and the investigation of the underlying mechanism of photosynthesis in different zones of leaves are helpful for estimating GPP, biomass and carbon storage.
Statistics on the spectral reflectance of 287 bamboo forest validation sample points in Sentinel-2 image () reveal that the spectral curve characteristics of bamboo forests in the bright area are consistent with the theoretical spectral curve of green vegetation, while the spectral curve characteristics of bamboo forests located in the shadow area differ, mainly: (1) bamboo forests in bright areas have higher spectral reflectance than bamboo forests in shadow areas, indicating that bamboo forests in shadow areas lose more information, which increases the difficulty of their accurate extraction; (2) the spectral curves of bamboo forests in the shadow area changed to a certain extent compared with those in the bright area, primarily in the near-infrared band and the red-edge band, which were weakened to a greater extent, and the spectral curves generally showed an increasing trend, but the trend was relatively flat. The final classification accuracy () was obtained based on the results of 10-fold cross-validation by using the RF algorithm with the three datasets of bright area, shadow area and both combined NIR and red-edge band samples, with the model OA of 89% and 87.5% for bright area samples and shadow area samples, respectively, and the F-score of 88.6% and 86.7%, respectively, which is higher than the model OA of both combined datasets. The OA of the model with the bright area samples and the shadow area samples as the dataset increased by 2.3% and 1.5%, respectively, while the F-score increased by 2.4% and 0.5%, respectively. If performed without separating the samples in bright and shadow areas, the large difference between the samples in the bright and shadow areas resulted in a poor classification of bamboo and nonbamboo forests in the model trained from each data, which affected the overall classification effect.
Figure 14. Canopy spectral reflectance of bamboo forest in Sentinel-2 MSI. The red solid line is the spectral reflectance of bamboo forest in bright area, and the blue solid line is the spectral reflectance of bamboo forest in shadow area.
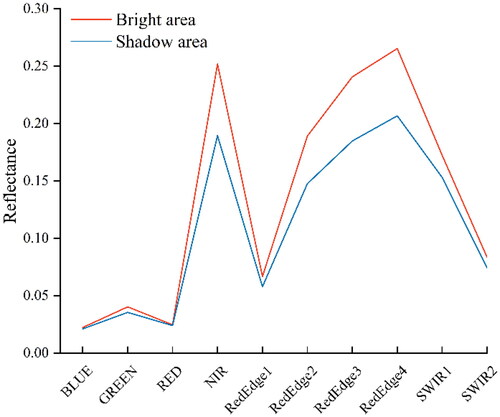
Table 6. Model classification accuracy statistics for bright area, shadow area and both combined NIR and red-edge band samples.
5.3. Sources of error in bamboo forest classification and prospect
As the research progressed, some disturbing factors were still to be explored. Bamboo has unique phenological characteristics, owing to alternating on- and off-years. When bamboo is in an off-year, nutrients are mainly supplied to the whip, which results in smaller, yellowish bamboo leaves due to the poor nutrition (Xu XJ et al. Citation2018) and the lack of chlorophyll and nutrients causes a large difference in the spectral reflectance of the leaves compared with that of on-year leaves (Huang et al. Citation2021); the lack of optical remote sensing images, the long return period of traditional remote sensing data and the vulnerability to weather and terrain factors, which contribute to the inability to collect the best extracted seasonal images of Moso bamboo forest and the difficulty in collecting complete time series remote sensing data during the growth cycle; Furthermore, bamboo forests are under attack from a variety of insect pests, and when insects eat the leaves, the interior structure, nutrients and water content of the leaves alter, resulting in spectral reflectance changes at various insect pest levels (Huang et al. Citation2018). Conversely, although bamboo is typically regarded as a quintessential feature of Asia, the majority of research on bamboo forest mapping has been conducted in China (Tamang et al. Citation2022). However, remote sensing-based bamboo resource mapping has also been reported in South America and Africa. In tropical regions such as the Amazon, where a multitude of tree species with similar morphologies exist, one or a few clusters of large trees may impede the growth of bamboo and its occupation of the canopy, making it difficult to locate in the canopy (Chaves et al. Citation2021). These factors are also potential reasons for misclassifying bamboo forests as other types of woodlands.
6. Conclusion
In this study, we extracted bamboo forest information by combining Sentinel-1 and Sentinel-2 features in bright and shadow areas. Different combinations of features were studied, and the results showed that red-edge and SWIR bands of Sentinel-2, as well as corresponding vegetation index, were highly significant in bamboo forest information extraction. Dissimilarity and homogeneity texture features of Sentinel-2, VV and VH backscatter features in the bright area of Sentinel-1, and VV-VH backscatter features in the shadow area of Sentinel-1 were effective features for bamboo forest extraction. Combining spectral, texture and backscatter features, the highest accuracy was achieved with an OA and Kappa coefficient of 88% and 0.7435, respectively.
Supplemental Material
Download MS Word (277.9 KB)Disclosure statement
The authors declare that they have no known competing financial interests or personal relationships that could have appeared to influence the work reported in this article.
Additional information
Funding
References
- Arsalan G, Soheil Z, Mohammadi AR, Meisam A, Ali M, Sadegh J. 2021. Mangrove ecosystem mapping using Sentinel-1 and Sentinel-2 satellite images and random forest algorithm in Google Earth Engine. Remote Sens. 13(13). DOI: 10.3390/rs13132565.
- Badgley G, Field CB, Berry JA. 2017. Canopy near-infrared reflectance and terrestrial photosynthesis. Sci Adv. 3(3):e1602244.
- Belgiu M, Drăgut L. 2016. Random forest in remote sensing: a review of applications and future directions. ISPRS J Photogramm Remote Sens. 114:24–31.
- Breiman L. 2001. Random forests. Mach Learn. 45(1):5–32.
- Cai YT, Lin H, Zhang M. 2019. Mapping paddy rice by the object-based random forest method using time series Sentinel-1/Sentinel-2 data. Adv Space Res. 64(11):2233–2244.
- Chaves PP, Reategui Echeverri N, Ruokolainen K, Kalliola R, Van Doninck J, Gómez Rivero E, Zuquim G, Tuomisto H. 2021. Using forestry inventories and satellite imagery to assess floristic variation in bamboo‐dominated forests in Peruvian Amazonia. J Veg Sci. 32(1):e12938.
- Chen XG, Zhang YP, Zhang XQ, Guo Y. 2008. Carbon stock changes in bamboo stands in China over the last 50 years. Acta Ecol Sin. 28(11):5218–5227.
- Deventer HV, Cho MA, Mutanga O. 2019. Multi-season RapidEye imagery improves the classification of wetland and dryland communities in a subtropical coastal region. ISPRS J Photogramm Remote Sens. 157:171–187.
- Dida JJV, Araza AB, Eduarte GT, Umali AGA, Malabrigo PL, Razal RA. 2021. Towards nationwide mapping of bamboo resources in the Philippines: testing the pixel-based and fractional cover approaches. Int J Remote Sens. 42(9):3380–3404.
- Dong JW, Xiao XM, Sheldon S, Biradar C, Duong ND, Hazarika M. 2012. A comparison of forest cover maps in Mainland Southeast Asia from multiple sources: PALSAR, MERIS, MODIS and FRA. Remote Sens Environ. 127:60–73.
- Du HQ, Mao FJ, Li XJ, Zhou GM, Xu XJ, Han N, Sun SB, Gao GL, Cui L, Li YG, et al. 2018. Mapping global bamboo forest distribution using multisource remote sensing data. IEEE J Sel Top Appl Earth Observations Remote Sens. 11(5):1458–1471.
- Emmel C, Paul-Limoges E, Bowler R, Black TA, Christen A. 2014. Vertical distribution of carbon dioxide sources and sinks in a recovering mountain pine beetle-attacked lodgepole pine stand. Agric For Meteorol. 195–196:108–122.
- Fei BH, Qi LH. 2020. Thoughts on the strategic planning of implementing national bamboo reserve. World For Res. 33(3):38–42.
- Fei YQ, Liu Y, Chen JW, Ding FL, Wang ZG. 2021. Development of bamboo cutting and transporting machinery. World For Res. 34(1):31–36.
- Fernández-Manso A, Fernández-Manso O, Quintano C. 2016. SENTINEL-2A red-edge spectral indices suitability for discriminating burn severity. Int J Appl Earth Obs Geoinf. 50:170–175.
- Galvão LS, Formaggio AR, Tisot DA. 2005. Discrimination of sugarcane varieties in Southeastern Brazil with EO-1 Hyperion data. Remote Sens Environ. 94(4):523–534.
- Ghosh A, Joshi PK. 2014. A comparison of selected classification algorithms for mapping bamboo patches in lower Gangetic plains using very high resolution WorldView 2 imagery. Int J Appl Earth Obs Geoinf. 26:298–311.
- Gitelson AA. 2004. Wide dynamic range vegetation index for remote quantification of biophysical characteristics of vegetation. J Plant Physiol. 161(2):165–173.
- Gong P, Wang J, Yu L, Zhao YC, Zhao YY, Liang L, Niu ZG, Huang XM, Fu HH, Liu S, et al. 2013. Finer resolution observation and monitoring of global land cover: first mapping results with Landsat TM and ETM + data. Int J Remote Sens. 34(7):2607–2654.
- Gorelick N, Hancher M, Dixon M, Ilyushchenko S, Thau D, Moore R. 2017. Google Earth Engine: planetary-scale geospatial analysis for everyone. Remote Sens Environ. 202:18–27.
- Goswami J, Tajo L, Sarma KK. 2010. Bamboo resources mapping using satellite technology. Curr Sci. 99(5):650–653.
- Greig C, Robertson C, Lacerda AB. 2018. Spectral-temporal modelling of bamboo-dominated forest succession in the Atlantic Forest of Southern Brazil. Ecol Modell. 384:316–332.
- Guan FY, Deng WH, Fan SH. 2012. Spectral characteristics of Phyllostachys pubescens stand and its differential analysis with typical vegetation. J Beijing For Univ. 34(3):31–35.
- Guang FY, Fan SH. 2010. Characterization of topographic variation in the dynamics of bamboo forests. Anhui Agric. Sci. 38(8):4333–4335.
- Guo YQ, Jia XP, Paull D, Benediktsson JA. 2019. Nomination-favoured opinion pool for optical-SAR-synergistic rice mapping in face of weakened flooding signals. ISPRS J Photogramm Remote Sens. 155:187–205.
- Haboudane D, Miller JR, Pattey E, Zarco-Tejada PJ, Strachan IB. 2004. Hyperspectral vegetation indices and novel algorithms for predicting green LAI of crop canopies: modeling and validation in the context of precision agriculture. Remote Sens Environ. 90(3):337–352.
- Huang XY, Xu ZH, Yang X, Shi JM, Hu XY, Ju WM. 2021. Monitoring the severity of Pantana phyllostachysae chao on bamboo using leaf hyperspectral data. Remote Sens. 13(20):4146.
- Huang XY, Xu ZH, Lin L, Liu J, Zhong ZQ, Zhou HK. 2018. Spectral characteristic wavelengths of moso bamboo leaves damaged by Pantana Phyllostachysae Chao. Spectr Spectr Anal. 38(12):3829–3838.
- Jeon H, Oh S. 2020. Hybrid-recursive feature elimination for efficient feature selection. Appl Sci. 10(9):3211.
- Jing X, Wang JD, Wang JH, Huang WJ, Liu LY. 2008. Classifying forest vegetation using sub-region classification based on multi-temporal remote sensing images. Remote Sens Technol Appl. 23(4):394–397.
- Kaplan G, Avdan U. 2019. Evaluating the utilization of the red edge and radar bands from sentinel sensors for wetland classification. Catena. 178:109–119.
- Kersten C, Marco O, Patrick L, Claudia K. 2018. Estimating rice production in the Mekong Delta, Vietnam, utilizing time series of Sentinel-1 SAR data. Int J Appl Earth Obs Geoinf. 73:574–585.
- Li P, Zhou G, Du H, Lu D, Mo L, Xu X, Shi Y, Zhou Y. 2015. Current and potential carbon stocks in Moso bamboo forests in China. J Environ Manage. 156:89–96.
- Li SH, Wang JL, Chen Y. 2006. An investigation on subregion classification method of TM image in Dulong River Basin. Remote Sens Infor. (3):40–43.
- Liang J, Zheng ZW, Xia ST, Zhang XT, Tang YY. 2020. Crop recognition and evaluationusing red edge features of GF-6 satellite. J Remote Sens. 24(10):1168–1179.
- Lichtenthaler HK, Ac A, Marek MV, Kalina J, Urban O. 2007. Differences in pigment composition, photosynthetic rates and chlorophyll fluorescence images of sun and shade leaves of four tree species. Plant Physiol Biochem. 45(8):577–588.
- Liu C, Xiong TW, Gong P, Qi SH. 2018. Improving large-scale Moso bamboo mapping based on dense Landsat time series and auxiliary data: a case study in Fujian Province, China. Remote Sens Lett. 9(1):1–10.
- Liu G, Li L, Gong H, Jin QW, Li XW, Song R, Chen Y, Chen Y, He CX, Huang YQ, et al. 2016. Multisource remote sensing imagery fusion scheme based on bidimensional empirical mode decomposition (BEMD) and its application to the extraction of bamboo forest. Remote Sens. 9(1):19.
- Liu XN, Jiang H, Wang XQ. 2019. Extraction of mountain vegetation information based on vegetation distinguished and shadow eliminated vegetation index. Trans Chin Soc Agric Eng. 35(20):135–144.
- Liu XS, Sun R, Wu F, Hu B, Wang W. 2010. Land-cover classification for Henan Province with time-series MODIS EVI data. Trans Chin Soc Agric Eng. 26(S1):213–219.
- Martone M, Rizzoli P, Wecklich C, González C, Bueso-Bello J-L, Valdo P, Schulze D, Zink M, Krieger G, Moreira A, et al. 2018. The global forest/non-forest map from TanDEM-X interferometric SAR data. Remote Sens Environ. 205:352–373.
- Mullissa A, Vollrath A, Odongo-Braun C, Slagter B, Balling J, Gou Y, Gorelick N, Reiche J. 2021. Sentinel-1 SAR Backscatter Analysis Ready Data Preparation in Google Earth Engine. Remote Sens. 13(10):1954.
- Ning XG, Chang WT, Wang H, Zhang HC, Zhu QD. 2022. Extraction of marsh wetland in Heilongjiang Basin based on GEE and multi-source remote sensing data. J Remote Sens. 26(2):386–396.
- Periasamy S. 2018. Significance of dual polarimetric synthetic aperture radar in biomass retrieval: an attempt on Sentinel-1. Remote Sens Environ. 217:537–549.
- Rodriguez-Galiano VF, Ghimire B, Rogan J, Chica-Olmo M, Rigol-Sanchez JP. 2012. An assessment of the effectiveness of a random forest classifier for land-cover classification. ISPRS J Photogramm Remote Sens. 67:93–104.
- Schlerf M, Atzberger C, Hill J. 2005. Remote sensing of forest biophysical variables using HyMap imaging spectrometer data. Remote Sens Environ. 95(2):177–194.
- Shuai GY, Zhang JS, Basso B, Pan YZ, Zhu XF, Zhu S, Liu HL. 2019. Multi-temporal RADARSAT-2 polarimetric SAR for maize mapping supported by segmentations from high-resolution optical image. Int J Appl Earth Obs Geoinf. 74:1–15.
- Sofo A, Dichio B, Montanaro G, Xiloyannis C. 2009. Photosynthetic performance and light response of two olive cultivars under different water and light regimes. Photosynthetica. 47(4):602–608.
- Tamang M, Nandy S, Srinet R, Das AK, Padalia H. 2022. Bamboo mapping using earth observation data: a systematic review. J Indian Soc Remote Sens. 50(11):2055–2072.
- Vollrath A, Mullissa A, Reiche J. 2020. Angular-based radiometric slope correction for Sentinel-1 on Google Earth Engine. Remote Sens. 12(11):1867.
- Wan CG, Wu XD, Lin XW. 2019. Impact of spatial and temporal scales of remote sensing data on the spatiotemporal change in geographic elements. J Remote Sens. 23(6):1064–1077.
- Wang R, Liu GS, Chen GH, Xiang DE, Wu YP. 2010. Effects of light intensity on photosynthesis and dry matter production of flue-cured tobacco at its seedling stage. Ying Yong Sheng Tai Xue Bao. 21(8):2072–2077.
- Wang TJ, Skidmore AK, Toxopeus AG. 2009. Understory bamboo discrimination using a winter image. Photogramm Eng Remote Sens. 75(1):37–47.
- Xiao FM, Fan SH, Wang SL, Xiong CY, Zhang C, Liu SP, Zhang J. 2007. Carbon storage and spatial distribution in Phyllostachy pubescens and Cunninghamia lanceolata plantation ecosystem. Acta Ecol Sin. 27(7):2794–2801.
- Xu L, Wu ZC, Luo F, Yang F, Xiang W, Gao F. 2017. Quantitative extraction of forest cover based on fusing of GF-1/WFV and MODIS Data. Trans Chin Soc Agric Mach. 48(7):145–152.
- Xu W, Zhou YX, Shen F, Tian B, Yu P. 2018. Recognition and extraction of Phragmites Australis Salt Marsh vegetation in Chongming Tidal Flat from Sentinel-1A SAR Data. J Jilin Univ (Earth Sci Ed). 48(4):1192–1200.
- Xu XJ, Du HQ, Zhou GM, Mao FJ, Li XJ, Zhu D, Li YG, Cui L. 2018. Remote estimation of canopy leaf area index and chlorophyll content in Moso bamboo (Phyllostachys edulis (Carrière) J. Houz.) forest using MODIS reflectance data. Ann For Sci. 75(1):1–14.
- Xu XJ, Zhou GM, Du HQ, Sun SB, Gao GL. 2016. Interannual variability of Moso bamboo forest GPP and its driving factors: a case study of Anji County. Acta Ecol Sin. 36(6):1636–1644.
- Xu ZH, Lin L, Wang QF, Huang XY, Liu J, Yu KY, Chen CC. 2018. Construction and application effects of normalized shaded vegetation index (NSVI). J Infrared Millimeter Waves. 37(2):154–162.
- Yayon A, Bauminger ER, Ofer S, Ginsburg H. 1984. The malarial pigment in rat infected erythrocytes and its interaction with chloroquine. A Mossbauer effect study. J Biol Chem. 259(13):8163–8167.
- Yen TM, Lee JS. 2011. Comparing aboveground carbon sequestration between moso bamboo (Phyllostachys heterocycla) and China fir (Cunninghamia lanceolata) forests based on the allometric model. For Ecol Manage. 261(6):995–1002.
- Yuen JQ, Fung T, Ziegler AD. 2017. Carbon stocks in bamboo ecosystems worldwide: estimates and uncertainties. For Ecol Manage. 393:113–138.
- Zeng YL, Li J, Liu QH, Qu YH, Huete AR, Xu BD, Yin GF, Zhao J. 2015. An optimal sampling design for observing and validating long-term leaf area index with temporal variations in spatial heterogeneities. Remote Sens. 7(2):1300–1319.
- Zhang B. 2016. Advancement of hyperspectral image processing and information extraction. J Remote Sens. 20(5):1062–1090.
- Zhang HS, Lin H, Wang YP. 2018. A new scheme for urban impervious surface classification from SAR images. ISPRS J Photogramm Remote Sens. 139:103–118.
- Zhang HS, Xu R. 2018. Exploring the optimal integration levels between SAR and optical data for better urban land cover mapping in the Pearl River Delta. Int J Appl Earth Obs Geoinf. 64:87–95.
- Zhou GM, Jiang PK. 2004. Density, storage and spatial distribution of carbon in Phyllostachy pubescens forest. Sci Sil Sin. 40(6):20–24.
- Zhou JH, Zhou YF, Guo XH, Ren Z. 2011. Methods of extracting distribution information of plants at urban darken areas and repairing their brightness. J East China Norm Univ (Nat Sci). 6:1–9.