
Abstract
Seaweed aquaculture is vital in protecting the marine eco-environment and mitigating climate change. China generates more than half of the world’s total seaweed production. However, despite multiple local studies, accurate and reliable information on broad-scale seaweed farms is still scarce. Using an object-based method to classify 3 m spatial resolution Planet Scope images along offshore China, a total of 129,494 ha of cultured seaweed was identified and delineated with an overall accuracy of 95.70% and a KAPPA index of 0.912, respectively. Then, a seaweed map in offshore China in 2018–2019 was developed. The results provided basic information about seaweed farms in China. The approach reported in this work is accurate and efficient, which can be used to replace the conventional method to obtain the culture seaweed information. This study can be of reference for mapping seaweed on a broader or global scale.
1. Introduction
Seaweeds play a critical role in marine ecosystems. As primary producers, seaweeds consume carbon dioxide (CO2) and release oxygen (O2), which helps regulate the composition of the atmosphere. This can mitigate the greenhouse effect and contribute to carbon offsetting (Duarte et al. Citation2017; Froehlich et al. Citation2019; Wu et al. Citation2020). Seaweeds are one of the most biodiverse natural ecosystems in the world. They provide not only habitats, nursery grounds, and shelters for marine animals (Mantri et al. Citation2019), but also food sources (Peng et al. Citation2009; Tiwari and Troy Citation2015). Their major functions include reducing seawater turbulence (Vettori and Nikora Citation2019), providing attachment substrates for attached organisms and living space for marine animals, forming habitat and spawning sites for fish, shrimp, and shellfish, and hatcheries for juvenile fish, and improving the productivity of aquatic organisms (Evans and Critchley Citation2014). The role of seaweed is also significant in environmental protection. During growth, seaweeds can absorb nutrients such as nitrogen and phosphorus to repair eutrophication in nearshore waters (Xiao et al. Citation2017; Zheng, Jin, et al. Citation2019) and alleviate the HABs problem (Zhu et al. Citation2022). They can also mitigate ocean acidification (Xiao et al. Citation2021), adsorb heavy metals (e.g. Zn, Pb, Cu, Cr, etc.) and purify water (Troell et al. Citation1999; He et al. Citation2008). Moreover, seaweeds have shown significant potential for applications in the food, pharmaceutical, and cosmetic industries (Smit Citation2004; Pereira et al. Citation2013; Wei et al. Citation2013; Hasan Citation2017).
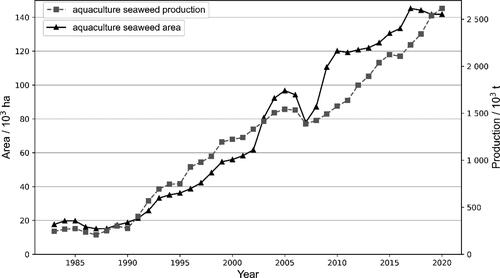
Large-scale seaweed aquaculture in China was started in the 1950s. After decades of development, China is currently the largest producer of seaweed, accounting for more than half of the total world production (The State of World Fisheries and Aquaculture 2022 Citation2022). The yield of cultured seaweed accounts for about 98% of the total production. As shown in , in the past 30 years, the culture area has increased more than eight times from 17.6 × 10³ ha in 1983 to 141.8 × 10³ ha in 2020, and the production yield has increased ten times from 244.8 × 10³ T in 1983 to 2615.1 × 103 T in 2020, respectively (China Agriculture Press 2021). The conventional method of field surveys and level-by-level reporting from individual farms/village, county, city, province, and then to the National Bureau of Statistics, is very time-consuming, labour-intensive, and substantially time-lag, which is no longer suited to the rapid and accurate assessment of seaweed farming. In contrast, satellite remote sensing has the advantages of broad range, long time series, high efficiency, and economy. This is suitable for large-scale and time series assessment and it is also increasingly used in monitoring coastal environments and resources, such as seagrass meadows (Li et al. Citation2022), salt marshes (Chen et al. Citation2022) and tidal flats (Wang et al. Citation2020). Therefore, the use of remote sensing technology in monitoring the spatiotemporal dynamics of seaweed culture is of practical significance in understanding the development and providing the improved management of the seaweed farming industry (Borja et al. Citation2013). In China, most studies on remote sensing of seaweed farming are focused on Jiangsu Province (Xing et al. Citation2019; Cheng et al. Citation2022). Remote sensing has also been used to identify bottom-farming seaweeds in some regional studies in Indonesia (Andréfouët et al. Citation2021; Langford et al. Citation2021; Pratama and Albasri Citation2021). By using high-resolution satellite imagery, the objectives of this study are to develop a procedure for seaweed identification and delineation by using remote sensing images, and 2) generate a map of seaweed along coastal China with the areal extent and spatial distribution information.
Figure 1. Inter-annual variation of areal extent and yield production of aquaculture seaweed in China during 1983–2020 (China Agriculture Press Citation1983-2021,).
2. Material and methods
2.1. Study area
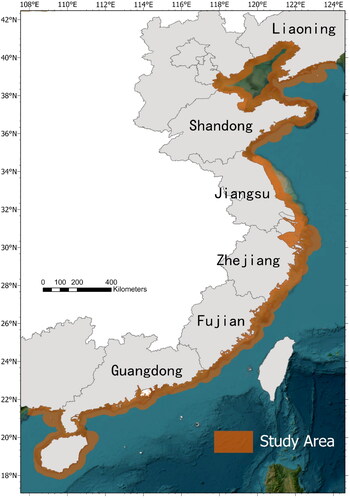
China has a continental coastal line of about 18000 Km, starting from the mouth of the Yalu River in the north (40.5°N) to the estuary of Beilun River in the south (18.2°N). This study covers all continental coastal provinces/cities that have seaweed aquaculture, with large-scale farming in Liaoning, Shandong, Jiangsu, Zhejiang, Fujian, and Guangdong (China Agriculture Press 2020). The map of the study area is shown in .
Figure 2. The study area of offshore China.
2.2. Imagery data
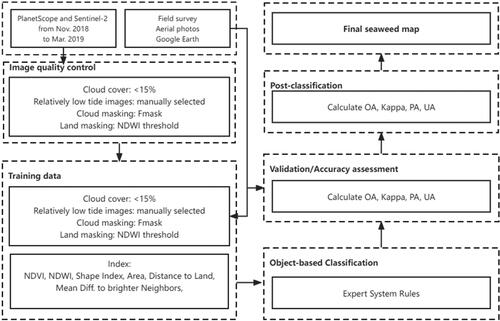
In this study, Planet Scope satellite imagery was used as the data source. Planet Scope has the largest number of satellites in the world, with 149 satellites in orbit. The multispectral data contains four bands (blue – B1–490 nm, green – B2–566 nm, red – B3–665 nm, and near infrared – B4–865 nm) with a spatial resolution of 3.5 m. We processed 296 scenes of Planet Scope images in this study, which cover about 50,000 km2 of sea area. Since Planet Scope imagery does not cover some seaweed farming areas in Jiangsu province, we used three scenes of Sentinel-2 imagery as alternatives which are about 12,000 km2 of sea area. Porphyra is generally cultivated in the sea in September in most parts of China and harvested for 2 to 6 times from October to April (Xiao et al. Citation2021; Cheng et al. Citation2022), while Gracilaria may be cultivated year round and harvested for about 6–15 times, depending on the seawater temperature, management practice, and nutrient concentrations. Other types of seaweed farms such as Laminaria and Sargassum are generally planted in October and harvested only once from April to June (Fang et al. Citation2016; Xiao et al. Citation2021). Thus, all images in this study were acquired from November 2018 to March 2019 during which seaweeds in China can be identified. The research framework of this study is shown in .
Figure 3. The research framework.
2.3. Spectral information
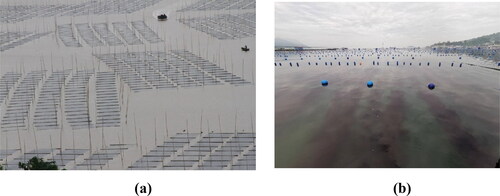
In most parts of China, seaweed such as Porphyra is cultivated on raft racks as shown in , while other seaweeds such as Gracilaria, Laminaria, and Sargassum fusiforme are cultivated on floating rafts as shown in . Additionally, the geometric shape of the Porphyra farming is different from that of other seaweed farming in remote sensing images. These two characteristics are used to distinguish Porphyra farming from other categories. Seaweeds float on the sea surface due to the type of seaweed farming that uses floating racks, while Saccharina japonica could be about 0.5 meters below the water’s surface. The width of the rafts in the breeding area varies from about 5–50 meters and the length from 100 to 500 m, and hundreds of thousands of rafts are regularly arranged on the sea surface, and the scale of the breeding zone can be up to ten kilometers.
Figure 4. (a) Field Porphyra farms in Dayuwan, Zhejiang, China; (b) Field Gracilaria farms in Ningde, Fujian, China.
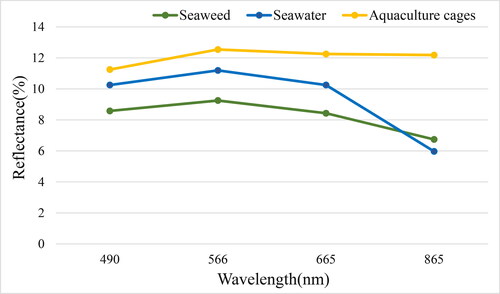
The seaweed as plants have a higher absorption capacity of visible light than the surrounding water bodies, and their brightness values are lower than those of the background water bodies. In Planet Scope images, in the blue, green, and red bands, the brightness of the seaweed farm area is slightly lower than the background water, and the brightness of the aquaculture cages is higher than the seawater and the seaweed farming area as shown in . In the NIR band, the brightness of the seaweed farming area is slightly higher than the background seawater, both are significantly lower than the brightness of aquaculture cages. Also, the geometry of the seaweed farming area is obvious, with regular dark stripes or rectangles in the visible band of the image. Farming seaweed has a regular geometric shape, while wild seaweed does not. Therefore, geometric shape and spatial distribution characteristics play an important role in distinguishing between culturing and wild seaweed.
Figure 5. Spectral reflectance of seaweed, seawater, and aquaculture cages.
2.4. Object-based analysis
Currently, most farming information extraction is based on pixel-based or object-based methods (Zheng, Duarte, et al. Citation2019). With the pixel-based method, it is easy to produce salt-and-pepper noise, the classification accuracy is low, and it also produces a large number of data redundancy. The object-based method is time-saving, efficient, and repeatable compared to the visual decoding method. It can avoid the salt-and-pepper noise, and can also incorporate spatial shape characteristics of the status in addition to spectral information. The object-based method has two main steps. One is image segmentation and the other is the classification of the segmented patches. Thus, more parameters need to be adjusted to have better results.
2.4.1. Image segmentation
As the basic unit of object-based classification operation, image segmentation aims to divide the image into meaningful separated regions to form primary image objects, which provide information carriers and building blocks for further classification. Therefore, the final classification accuracy of the image largely depends on the merits of segmentation.
The technique starts with single-pixel objects and gradually merges smaller image objects into larger ones, minimizing the heterogeneity weight of image objects in the process. If the minimum growth of heterogeneity of neighboring image objects is less than the threshold defined by the scale parameter, they are merged; otherwise, the process stops.
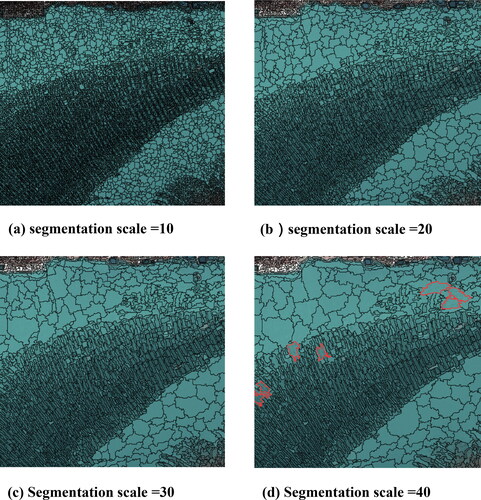
In this study, image segmentation and classification were implemented in the eCognition software. Multiscale segmentation is performed by adjusting three parameters: segmentation scale, shape factor, and tightness factor. The most appropriate segmentation effect is considered when the segmentation boundary is almost identical to the image’s boundary of the farming area. The shape factor of multiscale segmentation is 0.8, and the tightness factor is 1.0 because the target objects have apparent geometric features. In , the corresponding segmentation scales are from 10 to 40. When the segmentation scale is 40, the multiple seaweed farming areas are divided into a single piece along with the intervening seawater, as shown in the red border area in . This is not conducive to constructing the seaweed feature function. It is easy to cause misclassification when classifying seaweed, since seawater and seaweed are segmented into the same small patch, and the farming area is not accurate enough. When the segmentation scale is 30, the boundaries of the segmentation object coincide with the single seaweed farming area identified by visual inspection. There is no case where multiple farming areas are divided into the same object when the segmentation scale is 40, so the object can be segmented well.
Figure 6. Local schematic diagram of multi-scale segmentation results based on multispectral bands.
Due to the differences in images in different regions of the country, multispectral segmentation is first performed using the segmentation scale of 30-40. Then the spectral difference segmentation is performed.
2.4.2. Classification method
The expert system rules (ESR) are the primary classification techniques used in the object-based method for segment categorization (Qian et al. Citation2014). To automatically and objectively organize rules, ESR models expert judgment. The rules were created to specify which class an object belongs to and to describe the feature characteristics of the various classes. Among the indices and characteristics used to distinguish between the seaweeds and seawater were the Normalized Difference Water Index (NDWI) (McFEETERS Citation1996), Normalized Difference Vegetation Index (NDVI) (Rouse et al. Citation1974), and mean layer 1 (ML1-blue band). The NDVI amplifies the difference between vegetation’s absorption in the red band and reflection in the near-infrared band (Turner et al. Citation1999). The coastline data from Open Street Map (https://osm-boundaries.com) is used as the boundary to clip out sea areas to prevent interference from terrestrial plants. As a result, we considered the NDVI as one index to extract the seaweed farm from seawater. Because the seaweed farm is influenced by seawater, its NDVI may be lower than that of terrestrial plants. We finally found the right NDVI value for distinguishing Seaweed farms from seawaters after extensive testing with eCognition software. Some seaweed farms, however, were still misclassified as seawater. Given the relatively high reflectance for saltwater in the blue band, we used ML1 to remove the seaweed farms that were incorrectly categorized as seawater. The seaweed farm has a comparatively low ML1 rating compared to the seawater. Furthermore, as the intertidal area’s spectrum mainly contains plant information, we employed the NDWI to distinguish it from the seaweed farm. However, the seaweed farm includes additional water spectrum data. The saltwater class surrounded by land was finally recognized as a fishing pond thanks to a logical relationship since some fishing ponds were mistakenly classified as seawater due to similar spectral properties (Wang et al. Citation2015).
2.5. Accuracy assessment
We conducted a comprehensive accuracy assessment to evaluate the validity and reliability of the reported seaweed farming areas. This assessment involved multiple field trips to visit the reported locations, interviews with local residents to confirm their knowledge of seaweed cultivation and the use of tools such as the DJI Phantom 4 drone to gather high-quality aerial imagery. To ensure the high accuracy of our results, we conducted manual interpretation of Google Earth images with a higher spatial resolution and drone imagery, as shown in . These images allowed us to identify and verify typical areas of seaweed cultivation and determine the exact location of each sample point. In total, we selected more than 200 seawater and seaweed sample points in each province for accuracy assessment. These points were chosen based on their representativeness of the reported seaweed cultivation areas and their accessibility for field sampling.
Figure 7. DJI Phantom 4 drone image of seaweed farms in Dongtou, Zhejiang province, China, in December 2018.
3. Results
3.1. Classification accuracy
Estimation indices indicated that the image classification results were excellent (). Specifically, the recall for seaweed in different regions ranged from 89.95% to 98.33%, with an average of 95.38%, and the precision for seaweed ranged from 90.37% to 98.98% with an average of 95.93%. The overall accuracy for seaweed and water ranged from 90.77% to 98.67%, with an average of 95.70%, and the classification Kappa index ranged from 0.811 to 0.980, with an average of 0.912.
Table 1. Validation recall and precision for seaweed, Overall accuracy (OA) (%), and KAPPA index for all validation points.
3.2. Areal extent and spatial distribution of seaweed farms
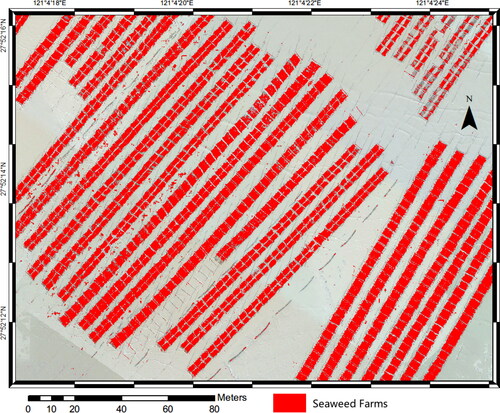
The areal extent and spatial distribution of seaweed farms identified and delineated from remote sensing imagery in 2018-19 are shown in and , respectively. The large areas of seaweed farms were identified and delineated from the images, with Jiangsu, 37,536 ha; Fujian, 33,209 ha; Liaoning, 23,911 ha; Shandong, 23,439 ha, Zhejiang, 8376 ha; and Guangdong, 2764 ha by province. As shown in , the largest Porphyra extent (37,536 ha) is in Jiangsu, while the second area (10,910 ha) is in Fujian. The identified Porphyra areas in Zhejiang, Shandong, and Guangdong were about 7244, 1103, and 820 ha, respectively. As shown in , the typical region results demonstrate a high accuracy in the classification results..
Figure 8. The areal extent and spatial distribution of seaweed farms in coastal China in 2018-2019. Liaoning, LN; Shandong, SD; Jiangsu, JS; Zhejiang, ZJ; Fujian, FJ; Guangdong, GD.
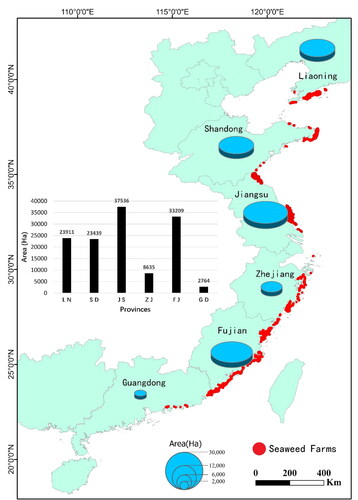
Figure 9. Remote sensing of seaweed farming areas in some typical regions of China’s coastal provinces in 2018–19.
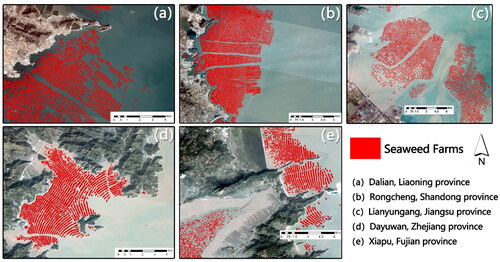
Table 2. A comparison of seaweed farming areas between those identified from remote sensing and that of the Fishery Statistic Yearbook in 2019 in China (Unit: ha).
Table 3. A comparison of Porphyra farming areas between those identified from remote sensing imagery and that of the Fishery Statistic Yearbook in 2019 in China (Unit: ha).
3.3. Spatial distribution analysis
Exploratory spatial data analysis (ESDA) is the frontier technology and essential development direction of spatial statistics; average Nearest Neighbour (ANN) is one of ESDA tools to calculate the nearest neighbor index based on the average distance from each feature to its nearest neighboring feature, an indicator of aggregation of objects. The results of ANN of seaweed farms in each province are shown in . Given the z-score of −50, there is less than a 1% likelihood that this clustered pattern could result from random chance, which means all the seaweed farms in China are highly clustered. Zhejiang and Fujian provinces have the smallest Z-values (< −300), indicating that these two provinces have the highest density of seaweed culture. On the contrary, Guangdong has the lowest seaweed culture density. The remaining provinces have medium and similar culture densities (−300 Z-values < −100).
Table 4. Average nearest neighbour summary of seaweed farms in each province.
4. Discussion
4.1. Advantages of remote sensing approach: efficiency, time, cost, accuracy
As mentioned previously, the conventional method of obtaining seaweed culturing information through field surveys and level-by-level reporting systems can no longer meet the need for rapid and accurate acquisition of seaweed farming information. With an average overall accuracy of 95.70%, and a classification Kappa index of 0.912, this study shows satellite remote sensing is suitable for monitoring seaweed farms on a broad scale. It is highly efficient at a very low cost. Therefore, the application of remote sensing technology in monitoring the spatial distribution of seaweeds is of great significance in understanding the development of seaweed farming and better managing the seaweed culture industry.
4.2. Mapping methodology advancement
The high spatial resolution images lead to the object-based method producing superior outcomes. Increasing spatial resolution can result in more detailed characteristics than the moderate resolution sensors, like Landsat-8 and Sentinel-2. As a consequence, the selection of Planet Scope satellite images symbolizes highly accurate classification results. Object-based classification methods were shown to be more effective than pixel-based methods in identifying seaweed farms with high-resolution images. Zheng et al. (Citation2018) compared the results of several studies to illustrate the advanced nature of the object-based approach. When it comes to detecting seaweed farms, the object-based method outperforms the pixel-based one.
4.3. A Comparison between remotely sensed results and conventional statistics
The data of the 2018–2019 farming area reported in the 2019 and 2020 China Fisheries Statistical Yearbook were compared with the results of this study. In general, the identified area of seaweed from remote sensing imagery differed substantially from the data reported in the China Fisheries Statistical Yearbook. Taking the area from Fishery Statistic Yearbook in 2019 (China Agriculture Press 2019) as the contrast, the seaweed farming area delineated from remote sensing images was 10.2% less than the one from Fishery Statistic Yearbook. The data on seaweed farming areas in Fishery Statistic Yearbook in 2019 were collected from January to December in 2018. Our remote sensing images were mainly acquired from November 2018 to April 2019. The different acquiring times of the data could be one reason for the area difference. Among the provinces for which statistics are available, Liaoning has the largest relative difference, with 110.2% more remote sensing-extracted seaweed farming area than the statistics reported in the yearbook. This discrepancy may be due to the omission of some statistics in Liaoning Province. On the other hand, Zhejiang, Fujian, and Jiangsu Provinces all have less remote sensing-extracted area than the yearbook statistics indicate. Specifically, the relative differences in these provinces are 50.8%, 23.1%, and 13.5%, respectively.
As was mentioned above, the overall accuracy and the Kappa index for the remote sensing classification of seaweed are all high, which demonstrates the high quality of our remote sensing results. However, there are substantial discrepancies between the data obtained from the remote sensing approach and that from the conventional statistics. This is attributable to the following three features or limitations of conventional statistics. (1) In a conventional way, the national summary is rooted in the information reported from individual farmers. As more than 4.5 million people in China are employed in fishery farming, it is hard for each village to verify the accuracy of reported data from the individual farmer. In addition, some farmers could not be reached or their information was missed. Consequently, there could be substantial uncertainties in the data reported at the village level. By taking Hainan Province as an example, a total of 597 ha was reported from the Fishery Statistic Yearbook. However, we took multiple field trips, visited the reported locations, interviewed residents, and also used DJI Phantom 4 drone to check if there were cultured seaweed in the region. All these verified that the results from our remote sensing were accurate and reliable. (2) There is a lack of standards for counting the area of culture seaweed. For example, in some fishing villages in Zhejiang Province, the cultivated Porphyra area of 2700 m2 is counted as one hectare. This is likely the main reason causing the discrepancy between the area (7244 ha) from remote sensing and the area (15,156 ha) from Fishery Statistic Yearbook (). For Laminaria culture, it is attached to a rope. In some fishing villages, a total of 1200 ropes that cultivate Laminaria are counted as one hectare. The length of the rope could vary from 3.5 m to 3.8 m, and the interval between two ropes could also vary from one farmer to the other, depending on their preference. These again add to the uncertainties of conventional statistics. (3) There are seven major cultivated seaweed species, that is, Laminaria, Undaria, Porphyra, Gracilaria, Eucheuma, Sargassum fusiforme, and Ulva in China (Zheng, Jin, et al. Citation2019). The cultivation methods are differed among the various species and from one village to the other, and then the methods to count the actual acreage of culture seaweed are varied from one specie to the other. While the conventional statistics approach has limitations, our high-resolution imagery-based approach has proven to be a valuable alternative in addressing some of these limitations. Our findings demonstrate that our approach offers improved accuracy and reliability in identifying and quantifying seaweed farming areas compared to conventional methods.
4.4. Future work
This study identified and delineated seaweed farming areas, and their areal extent and spatial distribution information are obtained for the entire nation. To fully understand the ecological and environmental benefits of seaweed cultivation, it is essential to have more information such as species, yield, and phenology, in addition to longer time series and higher spatial resolution remote sensing images. Therefore, time-series mapping of seaweed farms that incorporate these variables is crucial for accurately estimating these benefits over multiple years (Bell et al. Citation2020). Moreover, the application of automatic underwater vehicles (AUV) (Peres et al. Citation2021) and super high-resolution images (Pratama and Albasri Citation2021) could help estimate seaweed biomass.
5. Conclusion
By using the object-based method and high-resolution satellite images, this study accurately identified and delineated the seaweed farms area, and a nationwide map of cultured seaweed in 2019 was developed. This approach can identify and verify typical areas of seaweed farming with a high degree of accuracy, and the resulting map provides comprehensive information on the distribution of seaweed farms across multiple provinces. Our results highlight the potential of this approach for improving the management and sustainability of seaweed cultivation, as well as for providing valuable information for policymakers and industry stakeholders. We recommend using the approach reported in this paper to replace the conventional level-by-level reporting system of seaweed production.
Acknowledgements
We greatly appreciate the Editor and three Reviewers for their thoughtful and constructive comments/suggestions on the early version of this paper. This research was partially funded by the Ministry of Natural Resources (Remote Sensing Applications of Ocean Satellites), the National Natural Science Foundation of China (42171398), and the Fundamental Research Fund of Zhejiang University (2021XZZX012).
Disclosure statement
No potential conflict of interest was reported by the authors.
Data availability statement
The data that support the findings of this study are available from the corresponding author, Jiaping Wu, upon reasonable request.
Additional information
Funding
References
- Andréfouët S, Dewantama IMI, Ampou EE. 2021. Seaweed farming collapse and fast changing socio-ecosystems exacerbated by tourism and natural hazards in Indonesia: a view from space and from the households of Nusa Lembongan island. Ocean Coastal Manage. 207:105586.
- Bell TW, Nidzieko NJ, Siegel DA, Miller RJ, Cavanaugh KC, Nelson NB, Reed DC, Fedorov D, Moran C, Snyder JN, et al. 2020. The utility of satellites and autonomous remote sensing platforms for monitoring offshore aquaculture farms: a case study for canopy forming kelps. Front Mar Sci. 7:1083.
- Borja Á, Fontán A, Muxika I. 2013. Interactions between climatic variables and human pressures upon a macroalgae population: implications for management. Ocean Coastal Manage. 76:85–95.
- Chen G, Jin R, Ye Z, Li Q, Gu J, Luo M, Luo Y, Christakos G, Morris J, He J, et al. 2022. Spatiotemporal mapping of salt marshes in the intertidal zone of China during 1985–2019. J Remote Sens. 2022:9793626.
- Cheng J, Jia N, Chen R, Guo X, Ge J, Zhou F. 2022. High-resolution mapping of seaweed aquaculture along the Jiangsu coast of China using Google Earth engine (2016–2022). Remote Sensing. 14(24):6202.
- China Agriculture Press. 1983-2021. China Fishery Statistical Yearbook.
- Duarte CM, Wu J, Xiao X, Bruhn A, Krause-Jensen D. 2017. Can seaweed farming play a role in climate change mitigation and adaptation? Front Mar Sci. 4:100.
- Evans FD, Critchley AT. 2014. Seaweeds for animal production use. J Appl Phycol. 26(2):891–899.
- Fang J, Zhang J, Xiao T, Huang D, Liu S. 2016. Integrated multi-trophic aquaculture (IMTA) in Sanggou Bay, China. Aquacult Environ Interact. 8:201–205.
- Froehlich HE, Afflerbach JC, Frazier M, Halpern BS. 2019. Blue growth potential to mitigate climate change through seaweed offsetting. Curr Biol. 29(18):3087–3093.e3.
- Hasan MM. 2017. Algae as nutrition, medicine and cosmetic: the forgotten history, present status and future trends. WJPPS. 6(6):1934–1959.
- He P, Xu S, Zhang H, Wen S, Dai Y, Lin S, Yarish C. 2008. Bioremediation efficiency in the removal of dissolved inorganic nutrients by the red seaweed, Porphyra yezoensis, cultivated in the open sea. Water Res. 42(4-5):1281–1289.
- Langford A, Waldron S, Saleh, H, Sulfahri. 2021. Monitoring the COVID-19-affected Indonesian seaweed industry using remote sensing data. Marine Policy. 127:104431.
- Li Q, Jin R, Ye Z, Gu J, Dan L, He J, Christakos G, Agusti S, Duarte CM, Wu J. 2022. Mapping seagrass meadows in coastal China using GEE. Geocarto Int. 37(26):12602–12617.
- Mantri VA, Kavale MG, Kazi MA. 2019. Seaweed biodiversity of India: reviewing current knowledge to identify gaps, challenges, and opportunities. Diversity 12(1):13.
- McFeeters SK. 1996. The use of the Normalized Difference Water Index (NDWI) in the delineation of open water features. Int J Remote Sens. 17(7):1425–1432.
- Peng C, Hong-Bo S, Di X, Song Q. 2009. Progress in Gracilaria biology and developmental utilization: main issues and prospective. Rev Fish Sci. 17(4):494–504.
- Pereira L, Gheda SF, Ribeiro-Claro PJA. 2013. Analysis by vibrational spectroscopy of seaweed polysaccharides with potential use in food, pharmaceutical, and cosmetic industries. Int J Carbohydrate Chem. 2013:e537202–7.
- Peres C, Emam M, Jafarzadeh H, Belcastro M, O’Flynn B. 2021. Development of a low-power underwater NFC-enabled sensor device for seaweed monitoring. Sensors 21(14):4649.
- Pratama I, Albasri H. 2021. Mapping and estimating harvest potential of seaweed culture using Worldview-2 Satellite images: a case study in Nusa Lembongan, Bali, Indonesia. Aquat Living Resour. 34:15.
- Qian Y, Zhou W, Yan J, Li W, Han L. 2014. Comparing machine learning classifiers for object-based land cover classification using very high resolution imagery. Remote Sens. 7(1):153–168.
- Rouse JW, Haas RH, Schell JA, Deering DW. (1974, January 1). Monitoring vegetation systems in the Great Plains with ERTS. https://ntrs.nasa.gov/citations/19740022614.
- Smit AJ. 2004. Medicinal and pharmaceutical uses of seaweed natural products: a review. J Appl Phycol. 16(4):245–262.
- The State of World Fisheries and Aquaculture 2022. 2022. FAO.
- Tiwari BK, Troy DJ. 2015. Seaweed Sustainability: food and Non-Food Applications, 1–470.
- Troell M, Rönnbäck P, Halling C, Kautsky N, Buschmann A. 1999. Ecological engineering in aquaculture: use of seaweeds for removing nutrients from intensive mariculture. J Appl Phycol. 11(1):89–97.
- Turner DP, Cohen WB, Kennedy RE, Fassnacht KS, Briggs JM. 1999. Relationships between leaf area index and Landsat TM spectral vegetation indices across three temperate zone sites. Remote Sens Environ. 70(1):52–68.
- Vettori D, Nikora V. 2019. Flow-seaweed interactions of Saccharina latissima at a blade scale: Turbulence, drag force, and blade dynamics. Aquat Sci. 81(4):61.
- Wang A, Chen J, Jing C, Ye G, Wu J, Huang Z, Zhou C. 2015. Monitoring the invasion of Spartina alterniflora from 1993 to 2014 with Landsat TM and SPOT 6 satellite data in Yueqing Bay, China. PLoS One. 10(8):e0135538.
- Wang X, Xiao X, Zou Z, Chen B, Ma J, Dong J, Doughty RB, Zhong Q, Qin Y, Dai S, et al. 2020. Tracking annual changes of coastal tidal flats in China during 1986–2016 through analyses of Landsat images with Google Earth Engine. Remote Sens Environ. 238:110987.
- Wei N, Quarterman J, Jin Y-S. 2013. Marine macroalgae: An untapped resource for producing fuels and chemicals. Trends Biotechnol. 31(2):70–77.
- Wu J, Zhang H, Pan Y, Krause-Jensen D, He Z, Fan W, Xiao X, Chung I, Marbà N, Serrano O, et al. 2020. Opportunities for blue carbon strategies in China. Ocean Coastal Manage. 194:105241.
- Xiao X, Agusti S, Lin F, Li K, Pan Y, Yu Y, Zheng Y, Wu J, Duarte CM. 2017. Nutrient removal from Chinese coastal waters by large-scale seaweed aquaculture. Sci Rep. 7(1):46613.
- Xiao X, Agustí S, Yu Y, Huang Y, Chen W, Hu J, Li C, Li K, Wei F, Lu Y, et al. 2021. Seaweed farms provide refugia from ocean acidification. Sci Total Environ. 776:145192.
- Xing Q, An D, Zheng X, Wei Z, Wang X, Li L, Tian L, Chen J. 2019. Monitoring seaweed aquaculture in the Yellow Sea with multiple sensors for managing the disaster of macroalgal blooms. Remote Sens Environ. 231:111279.
- Zheng Y, Wu J, Wang A, Chen J. 2018. Object- and pixel-based classifications of macroalgae farmingarea with high spatial resolution imagery. Geocarto International. 33(10):1048–1063.
- Zheng Y, Duarte CM, Chen J, Li D, Lou Z, Wu J. 2019. Remote sensing mapping of macroalgal farms by modifying thresholds in the classification tree. Geocarto Int. 34(10):1098–1108.
- Zheng Y, Jin R, Zhang X, Wang Q, Wu J. 2019. The considerable environmental benefits of seaweed aquaculture in China. Stoch Environ Res Risk Assess. 33(4-6):1203–1221.
- Zhu Y, Wang Z, Song L, Christakos G, Agusti S, Duarte C, Wu J. 2022. Dynamics of phytoplankton community in relation to seasonal variation and Laminaria japonica culturing in coastal area. Estuarine Coastal Shelf Sci. 277:108063.