
 ?Mathematical formulae have been encoded as MathML and are displayed in this HTML version using MathJax in order to improve their display. Uncheck the box to turn MathJax off. This feature requires Javascript. Click on a formula to zoom.
Abstract
In the integrated generalization of contours and rivers, it is more important to consider the generalization of their geographical characteristics in addition to focusing on the graph generalization. Therefore, we elaborated on the geographical characteristics on which the contours and rivers depend in the integrated generalization, qualitatively describe and quantitatively characterize the geographical characteristics (spatial characteristics and geographical elements information content characteristics), and put forward the integrated generalization method of contours and rivers considering geographical characteristics. Based on the geographical characteristics, this article first identifies the relief and river network morphology, then as an essential terrain constraint, the spatial analysis and selection of topographic feature lines were carried out. Second, according to the integrated generalization method, the contours and rivers were discretized into 3D points along with describing semantic information and giving weights. Finally, the integrated generalization considering geographical characteristics experiment was implemented and well generalization results were obtained.
1. Introduction
The generalization of contours and rivers is one of the important topics in cartography generalization. Given that the maintenance of spatial relations after the generalization of the two elements, the collaborative generalization (Long et al. Citation2008) and the integrated generalization (Fei et al. Citation2009) of contours and rivers have been the focus of research.
The collaborative generalization method was introduced from the synergy theory emphasizing the collaboration between subsystems, and it was applied in the agent-based collaborative generalization of building groups (Ruas and Duchêne Citation2007; Touya et al. Citation2010). Simultaneously, there are also some research achievements in the collaborative generalization of contours and rivers. For example, Long et al. (Citation2008) pointed out that it should consider contours, rivers, and their relations as a whole, and ensure the consistency of spatial and attribute relations among these two elements through collaborative consideration and overall control, that is, by co-constructing the constrained Delaunay triangulation network (D-TIN) of contour clusters and river networks, the distribution characteristics of constrained D-TIN that rivers flow through the region were analysed, and the spatial collaborative relationships between the two elements were established, so as to achieve the collaborative generalization of contours and rivers. However, because of the complex spatial relations between the two elements, the generalization algorithm also becomes complicated and inefficient.
Compared to the collaborative generalization method, the integrated generalization method is more direct and efficient, in which contours and rivers are considered as the surface 3D discrete points, and by comparing the weighted point-to-plane distance with a preset threshold value, the main feature points describing the surface of the earth were retained. In this way, a simplified 3D point set was obtained and then converted into the desired format (i.e. contours and rivers) (Fei and He Citation2009; Fei et al. Citation2009). However, the multi-scale generalization of contours and rivers through the method of updating thresholds constantly affects the generalization efficiency. So our previous study proposed an improved integrated generalization method of contours and rivers using the importance sequence of all points from these two elements (2021), that is, without deleting any points, the importance value of points according to their geometric and semantic weight was calculated, and then a point importance sequence containing the importance values of all points from large to small was formed. Finally, the point set required by the target scales was determined, so as to achieve the multi-scale generalization. Nevertheless, the method seldom takes into account the geographical characteristics of contours and rivers, it only deals with the spatial relationship between contours and rivers, and pays more attention to its graph generalization; besides, the graph generalization, cartography generalization is also a generalization process guided by geographical regularity, namely, the generalization of geographical characteristics of map elements. The geographical characteristics-oriented automatic generalization of the map takes the geographical regularity as the guidance, to consider the spatial distribution characteristics, spatial relations, types, and grade differences of geographical elements in the generalization of geographic elements (Qi and Liu Citation1998). The generalization results should not only highlight the geographic characteristics and the regularity of geographical elements but also reflect their hierarchical characteristics.
Therefore, based on our previous study and combined with geographical characteristics of contours and rivers, we proposed an integrated generalization method of contours and rivers considering geographical characteristics, which aims to describe the geographical characteristics on which the contours and rivers depend in the integrated generalization, and carry out the qualitative description and the quantitative characterization of their geographic characteristics, thus the multi-scale generalization of contours and rivers is realized.
2. Materials and methods
First, the study area was introduced. Then we elaborated on the geographical characteristics on which the contours and the rivers depend in concrete. In this article, the geographical characteristics refer to the qualitative descriptions and quantitative characterizations of geographical elements, to reflect their geographical regularity. It includes the spatial characteristics and information content characteristics of geographical elements. In the spatial characteristics, there are spatial statistical characteristics of reliefs, rivers and topographic feature lines, as well as their spatial relations. The information content characteristics of geographical elements include information content of relief and rivers.
2.1. Study area
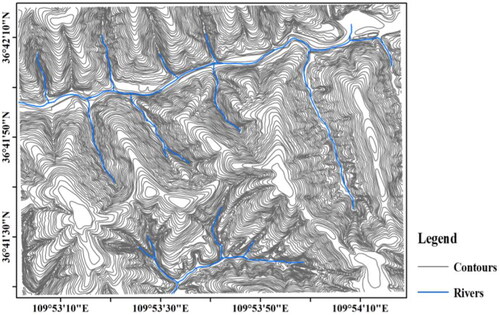
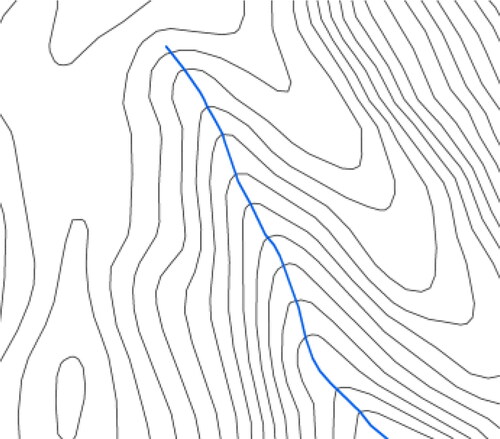
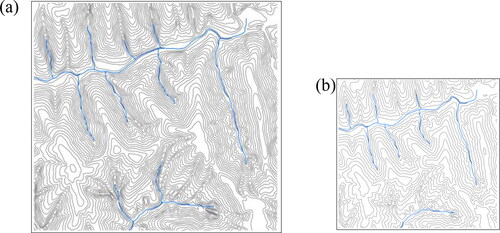
The study area in this article is part of contours and rivers in China with a scale of 1:10,000, whose latitude and longitude range is (36°41′–36°42′, 109°53′–109°54′), and the contour interval is 5 m, and the number of rivers is 16 (). It can be seen that the contours are relatively dense, the mountain tops are mainly flat, and the sources of local rivers are short.
Figure 1. Contours and rivers with a scale of 1:10,000 in the study area.
2.2. Spatial characteristics
The spatial characteristics refer to those of reliefs (contours), rivers, and topographic feature lines. Simultaneously, their spatial characteristics and spatial relationships should be analyzed and described.
2.2.1. Spatial characteristics of reliefs
The spatial characteristics of reliefs in this article include geographical location, terrain features, and positive/negative terrain ratio. According to the relative or absolute geographical location of the relief, and combined with its topographic characteristics, it is beneficial to define the type of reliefs. Besides, the positive/negative terrain ratio is conducive to analysing the structural changes of the relief.
Geographic location. Geographic location describes the relationships between time and space of geographic things, it can use different methods to carry out qualitative research, quantitative research, and positioning research for the geographic things according to the different needs of people, so as to grasp the spatial and temporal attributes and related characteristics of the geographic things, and the description of geographic location can reflect the general distribution pattern of relief from the side.
Terrain features. Terrain features are the unique signs of ground undulations, it includes terrain type, regional extremum, main terrain distribution, and conditions. The terrain type includes plain, hill and mountain, etc.; regional extremum refers to the maximum and minimum elevations of a relief; the main terrain distribution describes the dominant topography in a certain region if there are a variety of terrain conditions, and the distribution and arrangement of various topographic areas in the region, namely, the spatial arrangement and the terrain condition can describe the high and low conditions of topography, and the terrain type of a region can be judged by the relief degree of the terrain.
In order to quantify the terrain features of contour DEM, we converted the contour DEM with a constraint of topographic feature lines into the regular grid DEM. Then the mean change-point method, which is a common method for determining the optimal analysis window of relief, was used to calculate the terrain of the transformed regular grid DEM. Finally, the terrain type in the study area can be judged.
Positive/negative terrain ratio. The positive and negative terrains of reliefs are opposites, they are interrelated and interdependent. At the same time, they struggle and oppose each other. According to the role of the positive and negative terrains, the positive/negative terrain ratio (Cheng et al. Citation2022) was used to reflect the spatial features of topographic changes.
2.2.2. Spatial characteristics of rivers
The spatial characteristics of rivers include river classification, river elevation acquisition, and identification of river network morphology. The river classification is a basis for avoiding the logical error of the river elevation and the identification of river network morphology; the river elevation acquisition is the premise of integrated generalization. The method of river classification and elevation acquisition can be seen in reference to Cheng et al. (Citation2022). Generally, several common river network morphologies include dendritic river network, lattice river network, feather river network, and parallel river network (Kichul et al. Citation2019).
The graphic constraint factors can effectively reflect the graphic structure of the river networks, to ensure that the river networks are graphically similar before and after generalization. The parameters describing the graphic constraint factors for the river networks include outflow degree, inflow degree, length ratio (Zhang and Guilbert Citation2013), river spacing, tortuous coefficient, and river grade, etc. The parameters of river networks play their roles in the generalization of different river networks. For example, in the generalization of the dendritic river networks, small tributaries showing the acute angle intersection of the main tributaries should be selected first, to reflect the graphic features of dendritic river networks. Automatic identification of river network morphology is the premise of river network generalization, because river networks with different morphologies have great differences in methods selection, process control, and quality evaluation (Wu Citation1997). The method of automatic identification of river network morphology can be realized by statistical analysis of the spatial distribution characteristics of rivers, such as inflow angle analysis, flow direction analysis, sinuosity, length ratio, etc. (Zhang and Guilbert Citation2013) ().
Table 1. Identification rules for parts of river network morphologies.
2.2.3 Spatial characteristics of topographic feature lines
There are spatial statistical characteristics, the spatial coupling between topographic feature lines and rivers, and the elevation acquisition in the spatial characteristics of topographic feature lines. Since the elevation acquisition of topographic feature lines is similar to that of rivers, this section will focus on the first two characteristics of the topographic feature lines.
Spatial statistical characteristics of topographic feature lines. It includes category statistics, level statistics, and gentle probability statistics. The quantity statistics of topographic feature lines are conducive to the study of spatial variation pattern features of regional geomorphic forms (Tang et al. Citation2017). In this article, the topographic feature lines refer to valley lines, ridge lines, and saddle lines. The valley lines were divided into main valley lines, first-level branch valley lines, second-level branch valley lines and lower-level branch valley lines; the level divisions of the ridge lines are similar to those of the valley lines (). On the basis, the number of different grades of each type of topographic feature line is counted. The higher the grade of topographic feature lines, the more critical the valley or ridge area is in the whole relief. The more topographic feature lines of a certain grade, it means that the valley or ridge area where the topographic feature lines are located is dominant in the spatial arrangement of the whole relief.
Table 2. Classification of topographic feature lines.
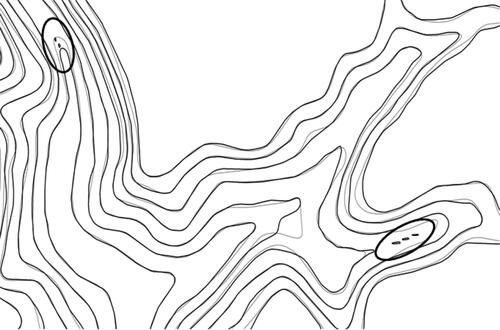
One of the important functions of topographic feature lines is to prevent topological relationship variation in the contours generalization, especially in the valley bottom of a narrow gentle slope or the wide area of ridge and saddle. It should be emphasized that the topological variation between contours in this article refers to the situation that the topological structure of local generalized contours is inconsistent with the corresponding original contours. For example, the gray lines are the original contours, and the dark black lines are the generalized contours (), it can be seen that the contours marked by ellipses that some local generalized contours become two or even three contours with the same name, which is mainly caused by the lack of constraints of topographic feature lines.
Figure 2. Variation of the topological relationship between contours.
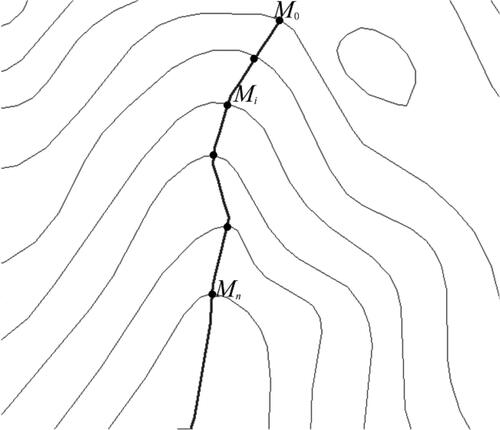
In order to solve the problem of topological variation in the generalization of contours, we selected a certain number of topographic feature lines according to the distribution characteristics of the gentle probability of topographic feature lines, to participate in the integrated generalization of contours and rivers. The gentle probability of a topographic feature line refers to the proportion of the length of the gentle slope area in a complete topographic feature line (valley line or ridge lines) (Formula (1), ). On the one hand, some topographic feature lines were selected to participate in the integrated generalization, so as to prevent the topological relationship variation of the generalized contours in the important valley bottom, ridge, and saddle area. On the other hand, eliminating some minor topographic feature lines is beneficial to reduce the importance of ranking ‘competition’ of spatial discrete points in the integrated generalization, and it is also conducive to further improving the integrated generalization efficiency by selecting more meaningful discrete points on topographic feature lines to participate in the generalization.
(1)
(1)
where P refers to the gentle probability of the topographic feature lines, i refers to the node index of the topographic feature lines, M is a node of the topographic feature lines, and L refers to the total length of the topographic feature lines.
Figure 3. Gentle probability of topographic feature lines.
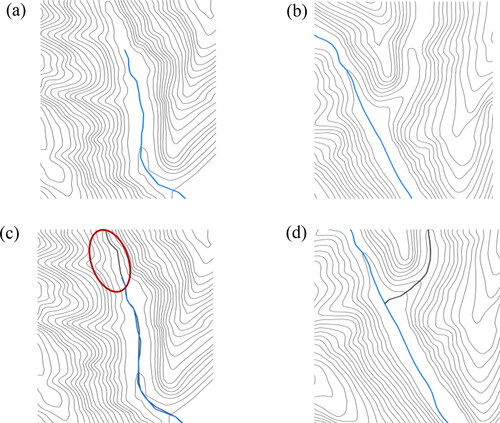
Spatial coupling between topographic feature lines and rivers. The extraction of high-precision topographic feature lines, especially valley lines, can ‘replace’ rivers in some cases. For example, under the influence of geographical location, climate, topography, and other factors, rivers in different regions have different degrees of development: some regions with advantageous geographical locations and abundant precipitation have developed rivers. On the contrary, rivers are less developed, with fewer perennial rivers, and the headwaters of rivers are less developed (). However, in some areas where the valley floor is more convex, seasonal rivers may dominate (). When the development of the river source is relatively low, the extracted source of the valley lines can be used to ‘replace’ the rivers, and the source of the valley lines has the same level as the rivers, such as the valley lines (black line) in the red ellipse (). If valley bottoms are obvious, but there are no rivers, then the extracted valley lines can be regarded as the rivers (black line) (). This relationship in which valley lines ‘replace’ rivers is called spatial coupling.
Figure 4. Spatial coupling between valley lines and less developed rivers. (a) Rivers with lower headwaters; (b) the area of the valley floor where rivers protrude but do not develop; (c) valley line headwaters are served as river headwaters; (d) the valley lines in the convex region of the valley floor ‘replace’ the rivers.
In the integrated generalization, if there is a river in the local valley bottom, then except for part of the valley line segments, that is, part of the valley lines that have spatial coupling with rivers, should be selected to participate in the integrated generalization as constraints, and the rest parts are not.
2.2.4. Spatial relationship between contours and rivers
The relationship between contours and rivers belongs to the category of spatial relationship between lines, the spatial relationships between topographic feature lines and contours are similar to those between rivers and contours, so this section will focus on the positive intersection relationship between contours and rivers. The intersection relationship refers to the fact that the river element crosses the contour element, and then forms the point intersection on the two-dimensional plane space, which is also called the intersection point. The positive intersection relationship refers to the approximately orthogonal relationship between rivers and contours (), it is also known as ‘coupling relations’, coupling comes from physics, and it is a measure of how two entities depend on each other. The positive intersection relationship between contours and rivers conforms to the regularity of natural geography.
Figure 5. The positive intersection relationship between contours and rivers.
2.3. Information content characteristics of geographical elements
2.3.1. Information content of reliefs
The information content is a measure of information, the information theory is widely used in data compression, statistic, and signal processing. In the field of hydrology, surface roughness is often used to reflect the degree of fragmentation and erosion of the inland surface in the macroscopic region of the surface. Therefore, the surface roughness was used to quantify the index of geomorphic information content, the formula is as follows (Chen et al. Citation2012):
(2)
(2)
where K is surface roughness, S is the slope, A is the projection area of two-dimensional horizontal area (DEM), A ' is the surface area (DEM), i is for the case of the i unit, n is the total number of units.
Our previous study pointed out that in the point importance sequence, according to the point segmentation method and the continuous analysis of the generalization results for each reserved point set rate, thus the point set required to be retained by the target generalization scale was determined (Cheng et al. Citation2022), which has a certain degree of subjectivity. Therefore, in this article, we compared the relief information content formed by different reserved point set rates with the relief information content of the standard map, if the relief information content of a certain reserved point set rate is the same or closest to that of the standard map, then the reserved point set rate is to be required for the target generalization scale.
In this section, by converting the original contour DEM with the topographic feature lines constraint into the regular grid DEM, we can obtain the standard map. Then the standard map, that is the regular grid DEM, was generalized into a specific scale DEM and its relief information content was calculated, thus we can attain the relief information content of the standard map. At the same time, in order to improve the automatic determination efficiency of the reserved point set rate required by the target generalization scale, information quantification was carried out in a segmentation way, that is, from the initial point set rate of 100% to the point set rate of 1% ().
Figure 6. Diagram of point set rate segmentation.
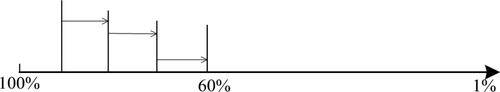
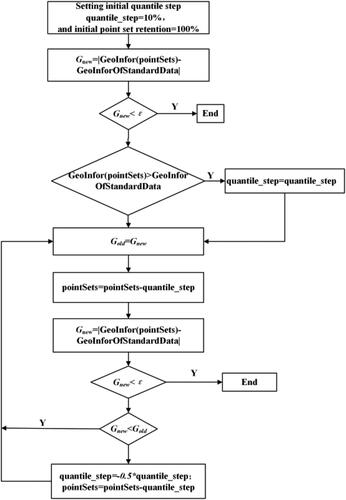
First, we calculated the relief information content (GeoInfor) of each point set rate, and compare it with the relief information (GeoInforOfStandardData) of the standard map. If the absolute value of the difference between the two relief information content was within the threshold, namely, Gnew = | GeoInfor (pointSets) − GeoInforOfStandardData | < it was over. If the relief information content obtained by the point set rate was greater than that of the standard map, then the point set rate was reduced with the step of quantile_step =10%. If it is less than the relief information of the standard map, the corresponding point set rate was increased in the reverse direction by half of the quantile_step step, and so on, until the condition is met ().
Figure 7. Flow chart of determining the reserved point rate for the target scale.
2.3.2. Information content of rivers
The information content is conducive to making an evaluation for the generalized rivers in the later study, and we mainly talked about the single-line rivers generalization in this article.
The information content of a map is determined by the diversity and difference of elements and their distribution features, that is to say, the greater the diversity and difference of elements and their distribution features on the map, the greater the corresponding information content. If not, the smaller. This has the opposite trend to the maximum information content under the equilibrium condition of information entropy (Deng et al. Citation2013). Therefore, based on the idea of information entropy (Shannon Citation1948), Whelan and Mcbratiney (Citation1998) established a feature-based map information calculation model, and the formula is as follows:
(3)
(3)
where wi is the ith standardized quantitative description value on the feature W; Iw is the information content generated by the feature w. When the base is 2, the information content unit is a bit, and the feature description value is set as dimensionless.
The distribution of elevation values of surface points is irregular, but their values are not random and have a certain correlation (Bjorke and Nilsen Citation2002), and the elevation distribution of rivers also has similar characteristics. The characteristics of line elements are reflected by the nodes of line elements and the overall shape of bending baseline elements, from the perspective of the information content of line elements, line elements can be divided into element layer composed of nodes, neighbourhood layer composed of bending, and overall level as independent elements. At the element level, the importance degree of the line element nodes in expressing the overall form of the line element determines the information content of the line element. The greater the importance degree of the point, the greater the information content (Deng et al. Citation2013). The reserved points in the integrated generalization are all important points, which indicate the reserved important point based on element-level information. Therefore, this section will focus on the information quantification based on neighbourhood-level curved geometry and overall level shape maintenance.
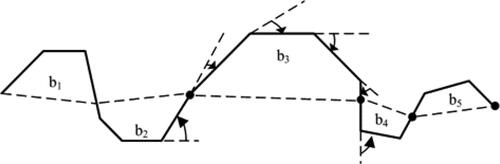
First, it is necessary to identify the bend of rivers, which is based on the extreme points of the line elements for the bending subdivision proposed by Wang (Citation2021). A set of bending sequences of streamline elements of the river was obtained (), the line elements are divided into a set of ordered bending {b1, b2, b3, b4, b5}, According to the commonly used bending metrics, namely, bending length, bending area, bending baseline width, etc., bending degree can be defined as the ratio of bending length (Len) to bending baseline width (Wid), and the formula is as follows:
(4)
(4)
where f (bi) is the bending degree of bi, and the value range is (1, +∞).
Figure 8. Bending division based on extreme points of line elements (Deng et al. Citation2013).
If the shapes of two bending degrees are similar, then the bending degrees are also similar, and it is not easy to distinguish the bending with the size difference. Therefore, the bending area ratio index is used to distinguish the difference of bending size, which refers to the ratio of a bending area S (bi) to the maximum bending area Max[S(bi)] in the bending sequence, and the formula is as follows:
(5)
(5)
where r(bi) is the relative area ratio of bending bi. According to EquationEquations (4)
(4)
(4) and Equation(5)
(5)
(5) , the bending degree sequence {f (b1), f (b2), f (b3), f (b4), f (b5)}and the bending area ratio sequence {r(b1), r(b2), r(b3), r(b4), r(b5)} can be obtained, respectively. Thus, the information content of bending bi is:
(6)
(6)
where H(bi) is the information content of bending bi in the neighbourhood of line elements, then the formula of neighbourhood-level information of the whole line group elements is calculated as follow:
(7)
(7)
where nj is the bending number of the jth line element, and m is the number of line elements.
Second, in the feature-based map information calculation model, the information content of the overall level of the rivers mainly adopts the density of line elements as the feature index to measure the information at the overall level, that is, the length of line elements divided by the area of line element buffer, and the formula is as follow:
(8)
(8)
where
is the length of the line elements,
is the width that is 3 times the minimum displacement of the tolerance to the line elements of buffer area. Similarly, HWL, the information content of online elements at the overall level, is expressed as:
(9)
(9)
where m is the number of line elements. Therefore, by comparing the information content at the overall level before and after the generalized rivers, their overall morphological retention ability can be evaluated.
3. Results and discussion
Based on Section 2, the experiments of the integrated generalization of contours and rivers considering geographical characteristics were carried out.
3.1. Recognition of relief type and river network morphology
According to the spatial characteristics of reliefs in Section 2.2.1, we first converted the contour DEM into the regular gride DEM with 5-m resolution, and by mean change-point method analysis, the 33*33 grid size is the best analysis window of topographic average relief degree. Second, we used the ArcGIS software to calculate its topographic relief degree and its range is from 18.09 to 156.38. Since the elevation values of this area range from 910 m to 1140 m, the relative altitude is 230 m, and the lowest elevation value is large, it can be judged that the study area belongs to the low mountain terrain. At the same time, because the latitude and longitude of the region range from 109° 53′E to 109°54′E, 36° 41′N to 36° 4′N, it belongs to part of Shaanxi Province in China with a large number of loess, so this area belongs to loess relief.
The river network morphology in this study area can be judged according to the calculation of spatial statistical characteristic parameters in in Section 2.2.2. shows the results of the river network classification and elevation profiles of a river in the loess relief, and shows the river networks parameter information calculated according to the identification rules for river network morphologies.
Figure 9. River network classification and the elevation change of river AB.
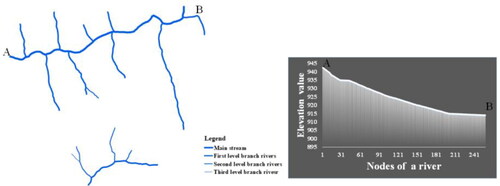
Table 3. Calculation results of river network parameters in the study area.
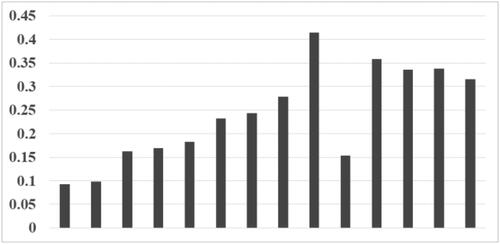
It can be seen in that the overall sinuosity in the loess relief is less than 1.1, and the approximate right-angle intersection distribution of the main and tributaries is as high as 71.4%, the river length ratio does not change much (), and due to the nature of loess gullies, the flow direction of the river is parallel to the mountain basically, that is, the flow direction of the tributaries is the same. Therefore, according to the morphological characteristics of the different river networks in of Section 2, it can be judged that the river network morphology belongs to the feather-like river network.
Figure 10. Variation of river length ratio.
3.2. Spatial analysis and selection of topographic feature lines
First, complete and highly accurate topographic feature lines were extracted from contours (Cheng et al. Citation2022) as shown in .
Figure 11. Extraction results of topographic feature lines.
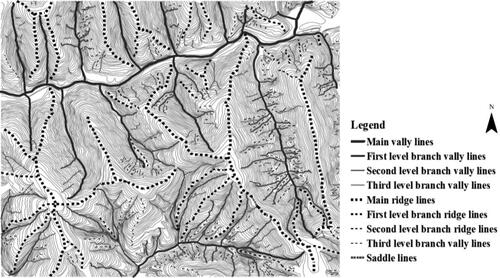
Second, the number of categories of topographic feature lines was counted to reflect the geomorphic characteristics. The spatial statistics of topographic feature lines mainly count the categories and corresponding quantities of topographic feature lines (), because it can describe the relief characteristics reflected in the statistical results.
Figure 12. Spatial statistical characteristics of topographic feature lines.
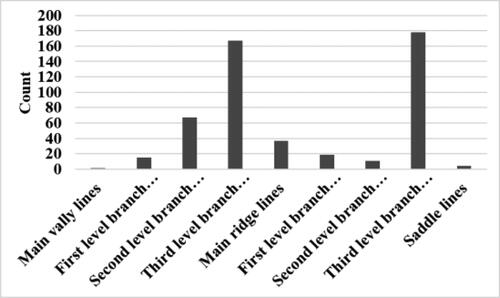
It can be seen that the number of third-level valley (ridge) lines with lower grade was dozens of times higher than that of the main valley (ridge) lines or higher grade valley (ridge) lines, indicating that there were more broken gullies or small ridges.
Finally, according to the gentle probability in Formula (1), the arcLen threshold of the gentle parameter was set 30 m, and the statistics of the gentle probability of different types of topographic feature lines were carried out (). It shows that the gentle probability of the valley lines is higher than that of the ridge line on the whole in loess relief, but the gentle probability of the local ridge lines is higher than that of the valley line of the same level.
Table 4. Gentle probability distribution of topographic feature lines.
By combining with the spatial coupling between topographic feature lines and rivers, a certain number of topographic feature lines were selected as constraints to participate in the integrated generalization of contours and rivers. In other words, among the topographic feature lines extracted from loess relief, all saddle lines, valley lines, and ridge lines with a gentle probability greater than 0 are selected. At the same time, the overlapped parts between local valley lines and rivers were not selected, but only the valley lines or their sources that have spatial coupling with rivers were selected. Finally, the total number of topographic feature lines was selected ().
Table 5. Selection of topographic feature lines.
3.3 Semantic information description
In this article, semantic information mainly describes the semantic information of contours, rivers, and topographic feature lines after they are discretized into 3D discrete points. The analysis of the spatial distribution characteristics of contours, rivers, and topographic feature lines in Section 2.2 lays a foundation for the structural description of the discretization of each element.
This section describes the semantic information of these discrete elements, including the data structure semantic information of discrete points on contours, rivers, and topographic feature lines, as well as the semantic importance description and weight assignment for different types of discrete points. Besides, each type of discrete point can be further divided according to its structural features and semantic importance.
Classification of discrete points on contours. The discrete points on contours are divided into general discrete points on contours, the discrete points where contours are intersected with rivers of different grades, and special discrete points on contours referring to the contours selected in different target generalization scales among n contours. The more the total number of times the contours are selected in different target generalization scales, the more important the discrete points will be.
Classification of discrete points on rivers. The discrete points on rivers can be divided into discrete points on rivers of different grades, the first and last points on rivers, confluence points between rivers, and intersection points between rivers of different grades and contours. The first and last points on rivers allow for whether the river length is close to the actual length after generalization, the confluence points between rivers maintain the spatial structure and integrity of rivers, and the intersection points between rivers and contours give consideration to the spatial relationship between rivers and contours.
Classification of discrete points on topographic feature lines. The discrete points on topographic feature lines include the discrete points on valley lines, ridge lines, and saddle lines, among which the discrete points on valley lines and ridge lines are divided in the same way as the discrete points on rivers, so it is not mentioned here.
Weighted for discrete points of different types. Since the importance description of discrete points on rivers and that on topographic feature lines are similar, this subsection mainly describes the semantic importance relationship between discrete points on contours and rivers, which can be seen in reference to Cheng et al. (Citation2022). The statistical results of the number of discrete points on each element in the research area are shown in . Then, according to the above classification of discrete points and the comparison of semantic importance, these 3D discrete points are classified and given corresponding semantic weight. Because of the overlapping relationship between rivers and valley lines in the topographic map representation, the ridge lines are also called ‘inverted rivers’. Therefore, it is considered that the semantic weights of rivers and valley (ridge) lines are the same under the same rank.
Table 6. Discretization information of each element.
Taking the semantic weight for discrete points on contours and rivers as an example, it can be seen from that loess relief (scale 1:10,000) is 96 times higher. Given that the difference in the number of rivers and the difference in the number of discrete points between contours and rivers, and whether the intersection points between rivers and contours, the first and last points on rivers, and the junction points between rivers can be effectively preserved in the integrated generalization, as well as the influence on the generalization effect of rivers. In this article, according to the description of the semantic importance of different types of discrete points, the weights of discrete points on contours and rivers were respectively assigned (). What needs to be emphasized here is that assigning the semantic weight of different types of discrete points can reflect the difference of each type of discrete point and achieve the purpose of discrimination.
Table 7. Semantic information description and weighted for discrete points of different types.
3.4 Analysis of integrated generalization of contours and rivers
The target generalization scales of the loess relief are 1:25 000 with a contour interval of 10 m and 1:50 000 with a contour interval of 20 m, respectively. And according to Topfer’s (Citation1966) rule, the number of rivers selected by the two scales is 12 and 9, respectively.
First, through the method in Section 2.3.1, point set rates of 80% and 50% were respectively selected as the point sets required to be retained for the target generalization scales of 1:25,000 and 1:50,000. Second, from the point set rates of 80% and 50%, points on contours were interpolated with the constraint of points on topographic feature lines; points on rivers were reconstructed according to the information of the elevation values, the ID number of original rivers, the ID number of nodes of rivers and the grade code of rivers (Cheng et al. Citation2022); then the reconstructed rivers should be selected in accordance with the requirements of the target. According to the selection rules of the feather-like river network, the reconstructed river network was selected. Finally, the integrated results of contours and rivers of 1:25,000 and 1:50,000 were obtained ().
Figure 13. Generalization results of loess relief. (a) Integrated generalization results with a scale of 1:25000; (b) integrated generalization results with a scale of 1:50,000.
After obtaining the integrated generalization results, the evaluations were made in qualitative and quantitative methods. There are various forms of loess relief, it can be found that there are many ridges and valley lines of lower grades from the extraction, the spatial distribution, and the quantitative statistics of the topographic feature lines, indicating that there are many gullies and small ridges, and the top of the plateau is mainly flat which belongs to the loess tableland, it is the largest positive landform with flat surface among Huangtugou relief. Therefore, this section will evaluate the generalization results from two aspects, namely, terrain accuracy evaluation and surface description evaluation, and make an information content evaluation for rivers.
Terrain accuracy evaluation. In terms of the terrain accuracy evaluation, the average slope (the average slope of each point within a certain distance of the surface), maximum elevation value, minimum elevation value, elevation average value, and elevation standard deviation and the topographic positive and negative ratio for quantitative description. Therefore, the terrain accuracy information before and after the loess relief generalization was obtained ().
Table 8. Comparison of terrain accuracy information before and after loess relief generalization.
It can be seen from that the average slope before and after generalization is similar, the maximum and minimum elevation values are unchanged, the average elevation changes little, the standard deviation of elevation is similar, and the ratio of positive- and negative- terrain ratio is similar. This indicates that although the reserved point set rate decreases with the increase of the generalization scale, leading to the loss of geomorphic details, the reserved point set rate is calculated according to the importance value of points, which are relatively important points on the surface, and these points can maintain the overall terrain ups and downs.
Terrain description evaluation. The contour morphological description of loess relief emphasized that the top features of the positive terrain should be maintained, the saddle shape should be kept, and the shape and direction of contour lines of the same valley should be coordinated with each other.
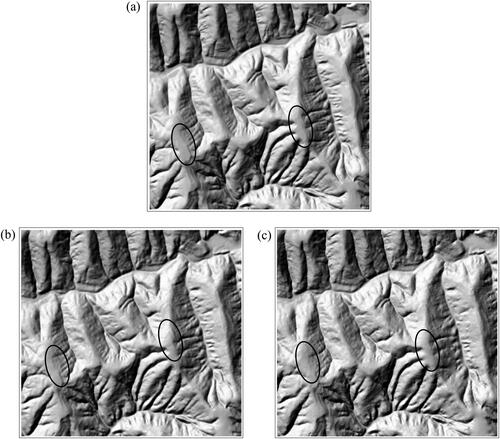
To better reflect the characteristics of loess tableland before and after generalization, this section compared the original mountain shadow with the mountain shadow formed by the generalization results of two different scales with the same magnitude (). It can be seen that as the scale of generalization increases, the number of reserved points decreases and local details are weakened, but the overall characteristics, such as the flat tableland, saddle, and gully, can basically maintain their original appearance as shown in the black ellipse.
Figure 14. Comparison of shadow maps at different scales in the study area. (a) Original shadow map with a scale of 1:10,000; (b) shadow map with a scale of 1:25,000; and (c) shadow map with a scale of 1:50,000.
River evaluation. Aiming at the target generalization scale of rivers, this article adopts the information content of rivers to quantify the features of curved geometry preservation and overall form preservation of rivers after generalization ().
Table 9. Comparison of information volume before and after river reconstruction.
As can be seen from , before and after the generalization, the information content of the river’s bending geometry decreases in a step-like manner, but the information content of its shape preservation is less different, indicating that the river has been simplified to a certain extent. And its overall morphological characteristics are also maintained.
3.5. Discussion
In the relief generalization, generalization degree of the automatic control problem has been the difficulty, and the generalization degree is a more abstract concept, and a generalization landscape to what extent to accord with the requirement of generalization scale is also a tough question to clear. Different relief types have different requirements for generalization degrees, relief types are the same, but their characteristics are different, and the requirements for the degree of generalization are not necessarily the same. Therefore, it is necessary to combine a large amount of geomorphic data, geomorphic generalization experience knowledge, and a mature geomorphic generalization method system to define the degree of generalization for each or approximate geomorphic type. In this article, the point importance sequence was divided by point segmentation to realize multi-scale generalization without judging whether the retained point set rate meets the generalization requirements of the target generalization scale, which is the key problem to be studied in the next step of this article. In addition, this article takes the extracted topographic feature lines as the generalization constraints, and the constraints are relatively simple, it does not consider the other constraints such as roads, buildings, and lakes on the relief generalization, and does not consider the generalization of double-line rivers and lakes, which is one of the important contents to be studied in the future.
4. Conclusion
The geographical characteristics for the integrated generalization of the contours and rivers were proposed in this article. First, the geographical characteristics on which the contours and rivers depend in the integrated generalization were described, namely, the spatial characteristics and the geographical elements information content characteristics, in which the spatial characteristics include spatial characteristics of reliefs (geographic location, topographic features, and positive- and negative-terrain ratio), of rivers (classification, river elevation extraction, and the identification of river network morphology), of topographic feature lines (quantitative statistics of topographic feature lines and the spatial coupling between topographic feature lines and rivers) and the spatial relationship features between contours and rivers. Second, the information content of geographical elements was introduced; it includes the information of relief represented by the surface roughness in the topographic macro factor, and the information content based on the bending geometry of the neighbourhood level and the overall level shape maintenance. Based on these geographical characteristics, we implemented an integrated generalization experiment and obtain well generalization results.
Disclosure statement
No potential conflict of interest was reported by the authors.
Data availability statement
The dataset utilized/analyzed during the current study will be available from the corresponding author upon request.
Additional information
Funding
References
- Bjorke JT, Nilsen S. 2002. Efficient representation of digital terrain models: compression and spatial decorrelation techniques. Comput Geosci. 28(4):433–445.
- Chen Y, Wilson JP, Zhu QS, Zhou QM. 2012. Comparison of drainage-constrained methods for DEM generalization. Comput Geosci. (48)::41–49.
- Cheng L, Guo QS, Fei LF, Wei ZW. 2022. An improved integrated generalization method for contours and rivers using importance sequence of all points from these two elements. Geocarto Int. 37(25):9261–9276.
- Cheng L, Guo QS, Fei LF, Wei ZW, He GF, Liu Y. 2022. Multi-criterion methods to extract topographic feature lines from contours ondifferent topographic gradients. Int J Geogr Inform Sci. 36(8):1629–1651.
- Deng M, Fan ZD, Liu HM. 2013. Performance evaluation of line simplification algorithm based on hierarchical information content. Acta Geod et Cartogr Sin. 4-2(5):767–773,781. in Chinese)
- Fei LF, He J. 2009. A three-dimensional Douglas–Peucker algorithm and its application to automated generalization of DEMs. Int J Geogr Inform Sci. 23(6):703–718.
- Fei LF, Huang LN, He J. 2009. Integrated generalization of cartographic symbols for water system and geomorphology. Paper presented at the 2nd International Conference on Earth Observation for Global Changes, 1(5):p. 2062–2079.
- Kichul J, Shin JY, Daeryong P. 2019. A new approach for river network classification based on the beta distribution of tributary junction angles. J Hydrol. 572:66–74
- Long Y, Cui SL, Shen J. 2008. The foundational theory and concept model of cooperative generalization of multi-elemental geographic information. Proc SPIE Int Soc Opt Eng. 7143,Geoinformatics 2008 and Joint Conferenceon GIS and Built Environment: Geo-Simulation and Virtual GIS Environments. Guangzhou, China.
- Qi QW, Liu Y. 1998. The theory and approaches of geographic feature-oriented generalization in GIS environment. Acta Geogr Sin. (04):3–5. in Chinese)
- Ruas A, Duchêne C. 2007. A prototype generalization system based on the multiagent system paradigm. In: w. Mackaness, A. Ruas and L. Sarjakoski, editors. Generalization of geographic information: cartographic modelling and applications. Amsterdam: Elsevier, chapter 14; p. 269–284.
- Shannon CE. 1948. A mathematical theory of communication. Bell Syst Tech J. 27(3):379–423.
- Tang GA, Na JM, Cheng WM. 2017. Progress of digital terrain analysis on regional geomorphology in China. Acta Geogr Sin. 46(10):1570–1591.
- Topfer F, Pillewizer W. 1966. The principles of selection: a means of cartographic generalization. Cartogr J. 3(1):10–16.
- Touya G, Duchêne C, Ruas A. 2010. Collaborative generalization: formalization of generalization knowledge to orchestrate different cartographic generalization processes. Heidelberg, Germany: Springer-Verlag.
- Wang HH. 2021. Research on simplification method of line elements based on domain knowledge. Thesis (Master). Wuhan city: Wuhan University (in Chinese).
- Whelan BM, Mcbratiney AB. 1998. Prediction uncertainty and implications for digital map resolution. Paper presented at the Fourth International Conference on Precision Agriculture. Madison:[s.n.]: 1185–1196.
- Wu HH. 1997. Structured approach to implementing automatic cartographic generalization. Paper presented at the 18th ICC. Stockholm, Sweden.
- Zhang L, Guilbert E. 2013. Automatic drainage pattern recognition in river networks. Int J Geogr Inform Sci. 27(12):2319–2342.