
 ?Mathematical formulae have been encoded as MathML and are displayed in this HTML version using MathJax in order to improve their display. Uncheck the box to turn MathJax off. This feature requires Javascript. Click on a formula to zoom.
Abstract
Unmanned aerial vehicle (UAV) hyperspectral remote sensing technology has developed rapidly in recent years, providing a new scheme for intelligent monitoring of forest resources. This study aims to deeply mining the UAV hyperspectral information, and construct the best model for extracting Moso bamboo (Phyllostachys pubescens) forest information. Firstly, the spectral information features of Moso bamboo, broadleaf, bare area and shadow were obtained and their spectral anisotropies were analyzed. Secondly, multiple machine learning algorithms were combined with the recursive feature elimination (RFE) to obtain three sets of optimized feature subsets. Eventually, three sets of optimization features were substituted into multiple machine learning algorithms to build nine models of Moso bamboo information extraction, comparing their classification effects and generalization capabilities. The results showed that: (1) The subset of features optimized by different base classifiers in combination with RFE and the ranking results of optimized features’ importance were different, but all the three sets of optimized feature subsets showed relatively obvious feature difference patterns; (2) The nine models based on SVM-RFE, RF-RFE and XGBoost-RFE were all capable of extracting Moso bamboo information, among which, the classification effect of the XGBoost-RFE-XGBoost model was the best and had significant advantages, with the overall classification accuracy OA, Kappa coefficient and R2 of 98.75%, 0.983 and 0.980, respectively, and the classification accuracy for Moso bamboo was 98.34%. Thus, XGBoost was the most applicable algorithm for feature optimization in combination with RFE, and the most effective algorithm with a better generalization ability for extracting Moso bamboo information from UAV hyperspectral images. This study is crucial for Moso bamboo’s large area monitoring and fine identification, providing a technical reference for obtaining information about the spatial and temporal distribution of Moso bamboo resources timely and accurately, facilitating the monitoring and management of them, and giving full play to their ecological and economic benefits.
1. Introduction
Bamboo is an evergreen perennial flowering plant, which mainly exists in the tropical and subtropical regions of the world and provides people with important ecosystem products and services (Zhou et al. Citation2011; Houdanon et al. Citation2018). Asia, Latin America and Africa are the main distribution areas of bamboo in the world (Qi et al. Citation2022). Du et al. used Landsat 8 OLI and MODIS data to estimate the total global bamboo forest area to be about 30,358.35 × 10 km2 (Cui et al. Citation2019). Among them, Asian bamboo forests are mainly distributed in China, India and other Southeast Asian countries. As the largest global bamboo-producing country, the number of bamboo species, the bamboo forests area and the bamboo products yield all rank first in the world. According to China Ninth Inventory of Forest Resources (2014–2018), China’s existing bamboo forest area is nearly 6,416,600 hm2; China’s bamboo species and bamboo forest area accounted for about 1/4 of the global total, with more than 10,000 kinds of products, and the annual output value of the bamboo industry has exceeded 200 billion RMB. Among many bamboo species, Moso bamboo (Phyllostachys pubescens) is the most widely grown bamboo species in the subtropical regions of Asia, Africa and Latin America, occupying more than 2/3 of the total area of bamboo forests in China, meanwhile, it is widely distributed in southern China and has a long history of being cultivated and utilized, especially in Fujian, Zhejiang, Jiangxi and Hunan provinces (Li and Kobayashi Citation2004; Gratani et al. Citation2008; Li et al. Citation2015; Lv et al. Citation2020). As a huge, green and renewable forest resource, Moso bamboo has the functions of water conservation, soil and water conservation, and maintaining carbon and oxygen balance, and is a bamboo species with the largest area, widest distribution and highest economic value in China. Thus, timely and accurate information on the spatial and temporal distribution of Moso bamboo forest can help to monitor and manage Moso bamboo resources as well as give full play to their ecological and economic benefits.
At present, satellite remote sensing is an effective way to monitor forest resources and their spatial and temporal dynamics on a large scale (Griffiths et al. Citation2014; Lu et al. Citation2016; Stagakis et al. Citation2016). Meanwhile, the utilization of remote sensing technology combined with machine learning algorithms in the extraction of thematic information of bamboo resources has become increasingly sophisticated. For example, Han et al. (Citation2014) proposed a multi-scale, object-oriented Moso bamboo information extraction method using SPOT-5 images, and combined it with the nearest neighbor algorithm to greatly improve the extraction accuracy of Moso bamboo information. Li et al. (Citation2019) obtained spatio-temporal distribution information of land use and bamboo forests with extraction accuracy over 75% using maximum likelihood method and Landsat time series data. Li et al. (Citation2019) and Shang et al. (Citation2013) combined scale transformed Landsat TM images, field survey data and MODIS-NDVI images to extract thematic information of Moso bamboo forest using matched filtering (MF) technique; Zhou et al. (Citation2021) used the random forest algorithm combined with the recursive feature elimination method (RF-RFE) to obtain the optimized feature subsets and used RF algorithm to achieve classification and identification of bamboo, coniferous and broadleaf forests; Maschler et al. (Citation2018) classified the tree species in the United Nations Educational, Scientific, and Cultural Organization (UNESCO) Wenawald Biosphere Reserve by using the object-oriented RF classification algorithm and achieved high accuracy.
Compared with satellite remote sensing technology, unmanned aerial vehicle (UAV) remote sensing is a new mesoscale remote sensing technology, which can seize images according to the spatial and temporal resolution specified by users, meanwhile, it has higher flexibility, cost-effectiveness and spatial resolution, which is significant to easily extract leaf spectral reflectance with centimeter spatial resolution from UAV images. Therefore, this technology has been increasingly applied to forest resources, environmental monitoring and management research, and the combination of UAV and data mining methods provides more powerful technical support for research work, which is essential for the development of precision forestry (Berni et al. Citation2009; Sakamoto et al. Citation2012; Anderson and Gaston Citation2013; Colomina and Molina Citation2014; Elarab et al. Citation2015; Matese et al. Citation2015; Ruwaimana et al. Citation2018; Joyce et al. Citation2021). In the study of mangrove species classification using RF-RFE combined with multi-source remote sensing data, it was demonstrated that the classification accuracy of RF was better than that of support vector machine (SVM); in the study of protection forest species classification using UAV hyperspectral images, it was demonstrated that the classification accuracy of RF was better than that of SVM and maximum likelihood classification (MLC) and the SVM-RFE combined with cross-validation was more suitable for the wavelength selection of hyperspectral data; in the study on the classification of dominant tree species in mixed coniferous forests of Changbai Mountain based on UAV hyperspectral images combined with deep learning algorithms, it was demonstrated that the convolutional neural network has efficient classification capability (Jiang et al. Citation2021; Xu et al. Citation2021; Zhao et al. Citation2021; Zheng et al. Citation2022). From these numerous studies, it can be found that two commonly applied machine learning algorithms such as SVM and RF classifiers have shown excellent performance when facing remote sensing data with a small number of samples and high dimensionality, and some scholars have studied the effects of SVM and RF classifiers on the classification accuracy of tree species, which have shown different classification performance when facing different remote sensing data and different feature variables (Pal Citation2005; Zhang and Xie Citation2013; Maxwell et al. Citation2014; Citation2015; Liu et al. Citation2017; Wen et al. Citation2018; Li et al. Citation2019; Liu and Hui-Jun Citation2019). Compared with the commonly applied SVM and RF classification methods, the new machine learning method with both feature selection and classification functions, extreme gradient boosting (XGBoost), has better classification performance and is less susceptible to the quality of training data (Freeman et al. Citation2016; Maxwell et al. Citation2018; Cai et al. Citation2019; Li et al. Citation2019; Zhong et al. Citation2019). This method is an optimized version of the gradient boosting algorithm (Chen and Guestrin Citation2016), which is capable of processing hundreds of millions of samples simultaneously through non-core computing, and is especially suitable for UAV remote sensing data with large volume and high dimensional information. However, few studies have compared the effectiveness and applicability of multiple machine learning algorithms combined with RFE for the classification and identification of Moso bamboo resources. Meanwhile, compared with visible and multispectral data, hyperspectral data are informative and have guaranteed accuracy in feature classification, but extensive information leads to redundant information and processing difficulties, so there is a considerable necessity to further explore and mine the characteristics of UAV hyperspectral image data combined with machine learning.
The aims of this study are as follows:
Deeply mining the information characteristics of Moso bamboo forest in the hyperspectral image of UAV.
To design different optimized feature schemes based on different base classifiers of SVM, RF, XGBoost combined with RFE, respectively, and explore their diversities and effectiveness in the differentiation of Moso bamboo with other surface features.
To compare the nine types of Moso bamboo information classification and recognition results using SVM, RF and XGBoost classification algorithms respectively based on the three optimized feature subsets, find the most effective model of Moso bamboo information extraction, provide technical reference to manage and monitor Moso bamboo resources, and give full play to their ecological and economic benefits.
2. Materials and methods
2.1. Test area and data
The test area is located in Shunchang County (117°30′–118°14′E, 26°39′–27°12′N), Nanping City, Fujian Province, China (). The landscape is mainly mountainous and hilly, with a mild climate and distinctive dry and wet conditions (). Shunchang County is the first batch of ‘Bamboo Township’ in China, and has completed the first single bamboo forest carbon sink transaction in China. By the end of 2021, the county had a forested area of 1673.33 km2, including 440 km2 of bamboo forest.
Figure 1. Test area and field investigation: (a) Geographical location of Shunchang County; (b) Satellite image of Shunchang County; (c) UAV field investigation; (d) UAV hyperspectral image of the test area.
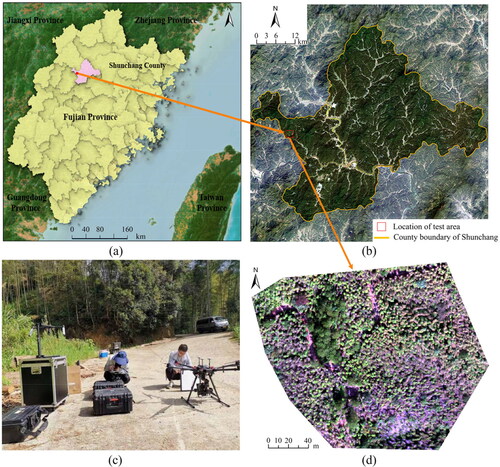
The field investigation team went to Dagan Town, Shunchang County, on 23 October 2021 to conduct field research, and selected a typical Moso bamboo pure forest (there were four typical surface features in this area including Moso babmboo, broadleaf, bare area and shadow) with an area of about 33,290.73 m2 in Shakeng Village as the experimental area for this study, and used a Risen UAV with HS-RPL hyperspectral sensor (https://www.ritu.cn) set at 90 m flight height to carry out aerial photography and collect field data (). After obtaining the UAV image, the image was preprocessed with radiometric correction, geographic correction, smooth denoising and image clipping with software SPECTRONON. The GPS positioning software G138BD with the RTK positioning function of UAV were combined to obtain the corresponding position information of the ground object, and then extracted the pixel boundary of the corresponding point on the image, so as to extract the information of four types of ground object samples. The UAV image and parameters are shown in .
Table 1. Main parameters of the UAV.
2.2. Study workflow
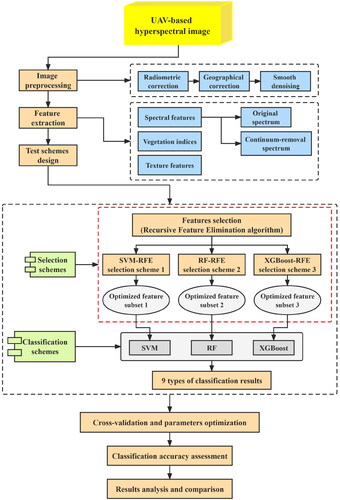
The workflow of this study is shown in and is as follows: (1) After obtained the UAV image, the image was preprocessed with radiometric correction, geographic correction, smooth denoising and image clipping; (2) 39 features of the UAV hyperspectral image were extracted, which included seven spectral features and their derived indices to be analyzed: the original spectra and its first-order, second-order and third-order derived spectra, the continuum removal (CR) spectra and its first-order and second-order derived spectra, 24 vegetation indices and eight texture features; (3) In order to avoid data redundancy, Pearson correlation analysis was conducted among the original spectra, CR spectra and their derived spectral features to be analyzed and 2741 groups of surface feature samples extracted from bamboo, broadleaf, bare area and shadow. Finally, the original spectra, CR spectra, vegetation indices and texture features with better correlation with surface features were used as the feature subsets for initial selection; (4) For feature optimization, this study designed SVM, RF and XGBoost to combine with RFE to obtain three sets of optimized feature subsets, respectively, finally, nine Moso bamboo information classification recognition results were obtained with using SVM, RF and XGBoost classification algorithms, respectively, based on the three optimized feature subsets.
Figure 2. Workflow for designing the schemes of feature optimization and Moso bamboo forest information extraction.
Features descriptions are as follows:
The original spectrum is the basic information of ground object recognition and classification. Extraction of reflectance of 300 bands corresponding to four types of surface features: Moso bamboo, broadleaf, bare area and shadow. Differential spectroscopy can provide reflectance variations that can remove the effect of partially linear or near-linear background noise spectra on the target spectrum. The CR spectrum is obtained by the ratio operation of the original spectral curve to the envelope curve, which enhances the spectral absorption characteristics of the sensitive bands of each biochemical parameter (Guo and Guo Citation2016).
Vegetation indices can differentiate vegetation from the surrounding terrain background effectively, which greatly enhances the potential of UAV image applications. In this study, 24 commonly used vegetation indices were extracted ().
Texture features contain information about the organization of the target surface and its relationship with the surrounding environment, and can be used as a useful complement to the original spectral information in remote sensing interpretation and the accuracy of image recognition and information extraction is successfully improved (Ozkan et al. Citation2016; Pargal et al. Citation2017). In this study, gray-level co-occurrence matrix (GLCM) was used to extract the texture features of the first principal component (contribution rate is 96.27%) in principal component analysis, which included 8 texture features, including mean, variance, homogeneity, contrast, dissimilarity, entropy, second moment and correlation. In this study, GLCM’s window processing size was 3 × 3 and the step was 1.
Table 2. Selected vegetation indices and texture features.
2.3. Construction and optimization of information extraction model for Moso bamboo
2.3.1. Machine learning algorithms selection
2.3.1.1. SVM
SVM is a machine learning algorithm using statistical theory, and its basic idea is to construct the optimal separating hyperplane (Xie et al. Citation2019). SVM’s core idea is using the kernel function to non-linearly map the data to a high-dimensional feature space, construct the optimal classification hyperplane with low penalty parameter C and polynomial kernel parameter (V, C) dimension, consider the empirical risk and confidence interval, and find the discriminant function with reference to the structural risk minimization (SRM). Different combinations of polynomial kernel parameters V and penalty parameters C (C, V) will achieve different classification results. Meanwhile, SVM has unique advantages in solving high-dimensional data classification problems and small-sample data classification problems. Not only can it accurately classify linearly divisible classification problems, but also will have excellent classification results for linearly indivisible classification problems. The principle of SVM feature importance ranking is: an embedded type of feature selection algorithm with the goal of function optimization, calculating the weights of each feature, and using the magnitude of the weights as the basis for the importance ranking of each feature.
2.3.1.2. RF
RF is a multi-decision classification tree algorithm based on classification and regression trees using the Bagging model (Breiman Citation2001; Zhang et al. Citation2019). Each decision tree of the random forest algorithm draws multiple training samples randomly with replacement (bootstrap resampling) from the training set as the training set of the tree, and each decision tree completes its individual classification, and then the final output is obtained by voting. Random forest can handle high-dimensional data and has the advantages of ranking the importance of features and avoiding overfitting. The principle of RF feature importance ranking is to determine how much each feature has contributed to each tree in the RF, then take its mean value, and finally compare the contribution size between features, where the calculation about the contribution can be impurity or out-of-bag data error rate.
2.3.1.3. XGBoost
XGBoost is a boosting model that improved on the basis of Gradient Boosting Decision Tree (GBDT), which has a profound influence in the field of machine learning and data mining by virtue of its scalability and fast running speed (Chen and Guestrin Citation2016). Unlike RF, the decision tree building process of XGBoost builds trees consequently based on the error of the prior tree, while RF trees are independent from each other, and each sub-tree is a weak classifier. The principle of feature importance ranking is that a feature is selected as a segmentation point based on the gain of the structure score, and the importance of the feature is the sum of its occurrences in all trees. The more a feature is used to build a decision tree in the model, the higher its importance.
2.3.2. Feature optimization scheme design and accuracy evaluation
In this study, the feature importance of the original spectra, CR spectra, vegetation indices and texture features in UAV hyperspectral image was optimized and analyzed by using SVM-RFE, RF-RFE and XGBoost-RFE, to seek the best model to improve the classification and recognition accuracy of Moso bamboo information by comparing accuracy and classification effect in each model. SVM-RFE, RF-RFE and XGBoost-RFE are effective feature selection methods (Zhou et al. Citation2021), which select features by the results obtained from the training base classifier, and the process is as follow: (1) Ranking the importance of features using SVM, RF and XGBoost, respectively; and (2) Removing the features with the lowest importance before each classification, and stopping iteratively until the feature set is empty. Therefore, this study used SVM-RFE, RF-RFE and XGBoost-RFE algorithms to select the optimal feature combinations. To further determine the number of feature parameters significant with each surface features, cross-validation method was combined with RFE, thus, the SVM-RFE, RF-RFE and XGBoost-RFE algorithms based on cross-validation are proposed, and different feature combinations were performed on the basis of RFE cross-validation, and finally determined the respective corresponding three optimized feature subsets.
For ensuring the dependability of the accuracy evaluations, enhance the stabilization and generalization ability of the model, and reduce the impact of sample data on the evaluations, 2741 groups of feature sample data were divided into a modeling set and a validation set at a ratio of 7:3, among which 1919 training samples were used for modelling and 822 validation samples were used for evaluation. Four indices, such as overall accuracy (OA), Kappa coefficient, recall and coefficient of determination (R2) of each classifier were counted to evaluate the effect of classification and Moso bamboo information of the four surface features, and the formulae are shown as follows:
(1)
(1)
(2)
(2)
(3)
(3)
(4)
(4)
where true positive (TP) denotes the positive sample that is predicted to be positive by the model; true negative (TN) denotes negative samples that are predicted to be negative by the model; false positive (FP) denotes the negative sample that is predicted to be positive by the model; false negative (FN) denotes a positive sample that is predicted to be negative by the model; R is the number of categories; xii is the number on the ith column of the ith row; xi+ is the total number of rows i; x+i is the total number of columns i; N is the total number of data sets; yi is the true value,
is the predicted value,
is the average of the true values.
3. Results
3.1. Primary selection and difference analysis of spectral characteristics
When selected the spectral features and their derived indicators, a total of seven indicators were first selected from the original and CR spectra and their derived spectra. Derived transform is a commonly used spectral feature analysis method, which is often used in research on feature identification, species classification and environmental monitoring, and has been highly effective (Erudel et al. Citation2017; Osco et al. Citation2020; Lin et al. Citation2021; Atmoko and Lin Citation2022); however, in the data priming process of this experiment, to avoid dimensionality caused by data redundancy, Pearson correlation analysis is conducted between the original spectra, CR spectra and their derived spectral features to be analyzed and 2741 groups of surface feature samples extracted from Moso bamboo, broadleaf, bare area and shadow surface feature samples, and the derived transform data’s p value of the derived transform data of the original spectra and CR spectra did not show better correlation with the four groups of surface feature samples, so they were excluded. The original and CR spectral features were extracted and analyzed as follows:
Analysis of original spectrum: The average reflectance of Moso bamboo, broadleaf, bare area and shadow were extracted (). It can be seen that both Moso bamboo and broadleaf had the ‘red valley’ and ‘green peak’ of vegetation spectral characteristics, and the reflectance of Moso bamboo was slightly higher than that of broadleaf overall. In addition, the spectral curves of bare area showed little variation overall, and the spectral curves of shadow were lower than those of other features in all wavelength ranges, and the spectral curves of both were also distinctive. In terms of the wavelength range of significant difference of the four surface features, in the wavelength range of 422–566 nm, the differentiation between shadow and broadleaf was better, but the confusion of reflectance between Moso bamboo and bare area was greater and the differentiability was poor; in the wavelength range of 568–728 nm, the spectral curves of the four surface features had the greatest difference and the best differentiability was reached; in the wavelength range of 728–860 nm, the spectral curves of two vegetation species, Moso bamboo and broadleaf, differed more from bare area and shadow, but the spectral curves between Moso bamboo and broadleaf were seriously confused and poorly distinguishable.
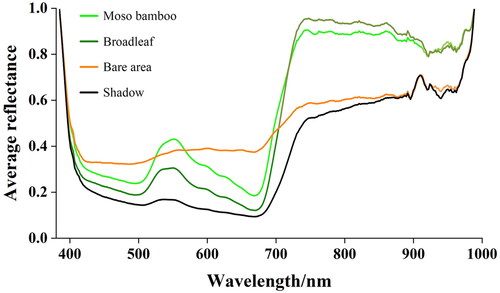
Analysis of CR spectrum: four surface features were generally superior in terms of separability, with the spectral curves of Moso bamboo and broadleaf following the same trend, both reaching troughs at 503 nm, 672 nm, peaking at 554 nm and reaching a maximum at 744 nm (). The reflectance of Moso bamboo was slightly higher than that of broadleaf in the wavelength less than 710 nm and slightly lower than that of broadleaf in the wavelength more than 710 nm. In addition, the spectral curves of bare area showed little overall variation, being slightly higher than those of Moso bamboo and broadleaf in the wavelength range less than 702 nm and slightly higher than those of Moso bamboo and broadleaf in the wavelength range greater than 702 nm. The spectral curves of the shadow were lower than those of the other features in all wavelength ranges and were more differentiable from the other features. In the wavelength range greater than 710 nm, although the spectral curves of two types of vegetation, Moso bamboo and broadleaf, differed more from bare area and shadow, there was some confusion and poor differentiation among the four surface features.
Figure 3. Workflow for feature optimization based on UAV hyperspectral image. The spectral curves of two vegetation species, Moso bamboo and broadleaf, differed more from bare area and shadow, but the spectral curves between Moso bamboo and broadleaf were seriously confused and poorly distinguishable.
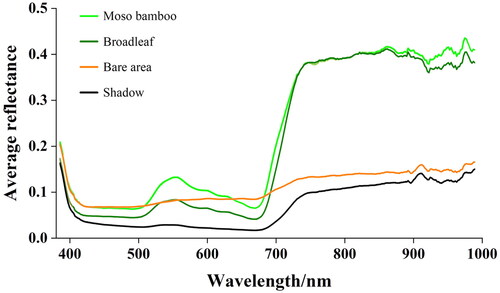
Figure 4. Spectral curves of CR spectrum. The spectral curves of two types of vegetation, Moso bamboo and broadleaf, differed more from bare area and shadow, but there was some confusion and poor differentiation between Moso bamboo and broadleaf.
In summary, both the original spectra and the CR spectra can identify the spectral range of the four surface features with better separability. Compared with the original spectra, the CR spectra had lower confusion and better separability, which provides an important reference for the construction of subsequent feature classification models.
3.2. Analysis of feature optimization
3.2.1. Analysis of RFE optimization results and feature contribution
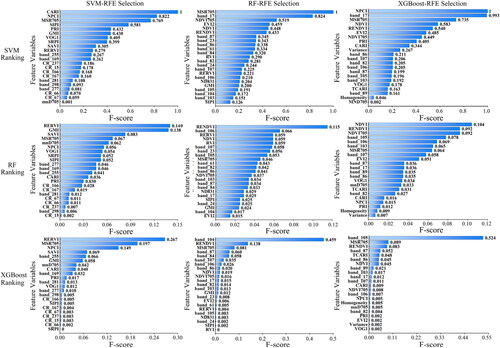
For determining the optimized feature subset, the SVM-RFE, RF-RFE and XGBoost-RFE algorithms were used to optimize the 289 primary features (). Obviously, the classification accuracy showed an obvious upward trend when the features’ number involved in the classification of the SVM-RFE feature optimization model increased from 1 to 22, and the classification accuracy did not change much when the features continue to be added, so the first 22 features were selected as the optimized feature subset, and similarly, the first 23 and 22 features were selected as the feature subsets of RF-RFE and XGBoost-RFE, respectively. While the importance ranking differed between algorithms, RF and XGBoost were the most similar ().
Figure 5. Results of feature selection. Red dots in the circles represent the highest accuracy corresponding to the optimized number of feature dimensions.
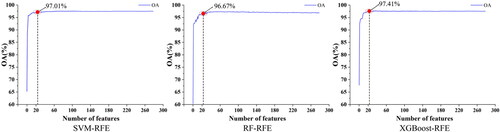
Figure 6. Importance scores for characteristic variables. The sorting of features selected based on the combination of SVM, RF, XGBoost and RFE is different in the three algorithms of SVM, RF and XGBoost. The importance ranking of vegetation indices was greater than that of spectral features and texture features in all models.
3.2.2. Surface features variability analysis of optimized features
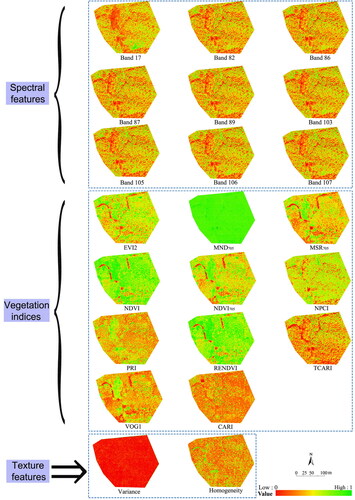
The values of each optimized feature were normalized, and the overall number of feature subsets selected based on SVM-RFE, RF-RFE and XGBoost-RFE was large. Since the feature subsets in each optimized model showed distinguishability of significant features, so the XGBoost-RFE model with the best classification accuracy was used as the representative in this study to show its optimized feature subsets (). Where the horizontal coordinates 1, 2, 3 and 4 represent the four surface features of Moso bamboo, broadleaf, bare area and shadow. All the optimized features showed significant surface feature differences: in the original spectra features, the differences in the order of reflectance of the four surface features showed that the mean value of reflectance of Moso bamboo was the highest, followed by bare area, broadleaf and shadow. In the vegetation index features, the mean value of the index of Moso bamboo was slightly higher than that of broadleaf in NPCI, TCARI and CARI, and slightly lower than that of broadleaf in other indices. The mean index values of bare area were slightly higher than those of Moso bamboo in PRI and NPCI and slightly lower than those of Moso bamboo in all of them. The mean index values of shadow were slightly higher than those of Moso bamboo in NDVI, NDVI705, RENDVI and slightly higher than those of Moso bamboo and broadleaf in PRI and VOG1, slightly lower than those of Moso bamboo and broadleaf in other indices, and slightly higher than those of bare area in most indices, but in MND705, the differences in index values of the four surface features were extremely small. In the texture features, the differences among the four surface features were slightly smaller in the variance values, and the order of magnitude was Moso bamboo, broadleaf, shadow and bare area, and the differences among the four surface features were more obvious in the uniformity values, and the order of magnitude was Moso bamboo, broadleaf, shadow and bare area (). A thematic map of each optimized feature was obtained, as shown in .
Figure 7. Variation characteristics of each feature in XGBoost-RFE selection. All the optimized features showed significant surface feature differences in general.
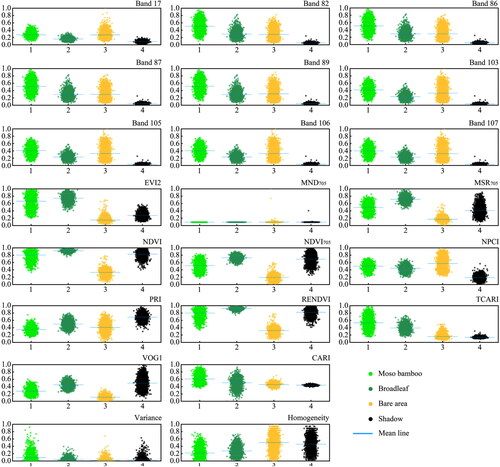
Figure 8. Thematic map of each optimized feature.
3.3. Information extraction model and effect evaluation of Moso bamboo forest
3.3.1. Construction and parameters optimization of nine models
Using the sample data in the experimental group, the Moso bamboo forest information extraction models based on SVM, RF and XGBoost were constructed with optimized features such as original spectra, CR spectra, vegetation index and texture features as independent variables and four surface feature types as dependent variables, respectively.
The learning curve and grid search were used to tune the parameters and improve the accuracy of each classification model. The main role of the learning curve is to observe the effect of the size of the data set on the model performance and select the appropriate parameters for the model, and the main role of grid search is to tune the parameters sequentially by step within the specified parameter range, train the learner with the adjusted parameters, and find the parameter with the highest accuracy in the validation set from all the parameters, which is actually a training and comparison process. For ensuring the models’ stabilities, five cross-validations were performed on the training set. The main parameters’ optimization of each model and the accuracy are shown in .
Table 3. Parameters of SVM, RF and XGBoost models.
It can be seen from the mean value of accuracy for five-fold cross-validation in that the classification ability of XGBoost is optimal in the three preferred feature subsets, but the difference is not much compared with SVM and RF, so a paired t-test is needed to test whether the advantage of XGB's classification ability is significant. All values of accuracy for five-fold cross-validation of the three algorithms for classification in the three optimized feature subsets were statistically counted separately and paired t-tests were performed as in .
Table 4. Paired t-test for all values of accuracy for five-fold cross-validation.
It can be seen that the difference of classification accuracy between RF and XGBoost is highly significant (p < 0.01) in the optimized feature subset of SVM-RFE; both the difference of classification accuracy between SVM and XGBoost, RF and XGBoost are highly significant (p < 0.01) in optimized feature subset of RF-RFE; the difference of classification accuracy between SVM and XGBoost is highly significant (p < 0.01), and the difference of classification accuracy between SVM and XGBoost is significant (p < 0.05) in optimized feature subset of XGBoost-RFE. Thus, XGBoost has significant classification advantages in three optimized feature subsets.
3.3.2. Comparison of classification results of nine models
3.3.2.1. Comparison and analysis of classification effect
The classification results of each model are shown in after parameter tuning and model effect enhancement by learning curve cross-validation and grid search cross-validation for each classification model. From the classification graph, all nine models had good effects on extracting information of Moso bamboo in the test area, although there was a certain confounding phenomenon between Moso bamboo and broadleaf in all nine models, in general, the prediction results of the nine models were not quite different from each other, among which, the prediction results based on four models, RF-RFE-RF, RF-RFE-XGBoost, XGBoost-RFE-RF and XGBoost-RFE-XGBoost, were closer, and the prediction effect of XGBoost was slightly better than that of RF.
Figure 9. Comprehensive prediction results of Moso bamboo of nine models. (a) Prediction results of Moso bamboo forest information distribution based on nine models; (b) The ratio of area occupied by each surface features of the nine models.
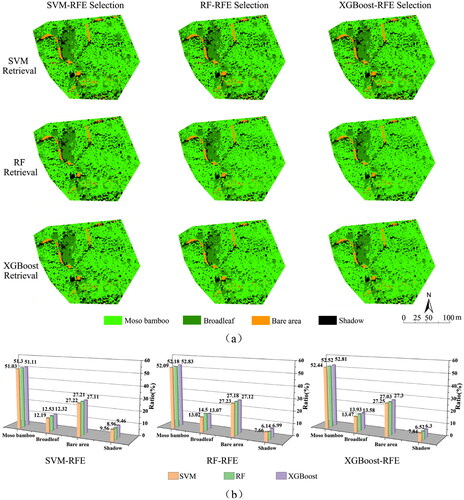
The sample data of the validation set were calculated into each feature classification model, and the OA, Kappa coefficient and R2 of the nine surface feature classification models were calculated, respectively, and the results of classification with the paired t-test are shown in . Obviously, all nine models had certain recognition abilities for the surface features, and the OA was above 97%, the Kappa coefficient was above 0.96, and the R2 was above 0.95. Among the surface feature subsets selected by the three algorithms combined with RFE, the feature classification models constructed by the feature subsets selected by XGBoost-RFE were slightly better overall. And XGBoost-RFE-XGBoost had the highest OA, Kappa coefficient and R2, 98.75%, 0.983 and 0.98, respectively; compared with XGBoost-RFE-SVM and XGBoost-RFE-RF. The OA of XGBoost-RFE-XGBoost surface feature classification model improved by 0.63 and 0.85%, and the Kappa coefficient improved by 1.38 and 0.85%. According to the R2 results, the prediction result of XGBoost was the best fit to the actual feature classification, which improved by 1.35 and 0.66% compared with the other two classifiers.
Table 5. Effect evaluation of different classify algorithms based on SVM-RFE.
Table 6. Effect evaluation of different classify algorithms based on RF-RFE.
Table 7. Effect evaluation of different classify algorithms based on XGBoost-RFE.
By further comparing the classification accuracy of SVM, RF and XGBoost algorithms for Moso bamboo, broadleaf, bare area and shadow in the nine models, it is easy to see that the classification accuracy of the nine models for various types of surface features showed certain differences. In general, the classification accuracy of the nine models for Moso bamboo and broadleaf was slightly lower than that of other features. Specifically, among the three SVM-RFE models, XGBoost was the best, SVM was the second and RF was the weakest; for the classification accuracy of Moso bamboo and broadleaf, XGBoost was the best, SVM was the second and RF was the weakest; for the classification accuracy of bare area, SVM was the best, RF was the second and XGBoost was the weakest; for the classification accuracy of shadow, XGBoost was the best, SVM was the second and RF was the weakest. Among the three models of RF-RFE, XGBoost was the best, SVM was the second and RF was the weakest; for the classification accuracy of Moso bamboo and broadleaf; XGBoost was the best, SVM was the second and RF was the weakest; for the classification accuracy of bare area, SVM was the best, RF was the second and XGBoost was the weakest; for the classification accuracy of shadow, XGBoost was the best, SVM was the second and RF was the weakest. Among the three models of XGBoost-RFE, XGBoost was the best, SVM was the second and RF was the weakest; for the classification accuracy of Moso bamboo, XGBoost was the best, SVM was the second and RF was the weakest; for the broadleaf classification accuracy, RF was the best, XGBoost was the second and SVM was the weakest; for the classification accuracy of bare area, SVM was the best, XGBoost was the second and RF was the weakest; for the classification accuracy of shadow, RF was the best, SVM was the second and XGBoost was the weakest.
3.3.2.2. Demonstration of significance of differences in classification accuracy
For the comparison results of the accuracy of the models, though XGBoost-RFE-XGBoost had better classification accuracy, there were few differences. However, it did not imply statistically insignificant differences, thus, five more classification tests were conducted and performed paired t-tests on the accuracy of surface features classification for all models as a method to judge the significance of their differences. Compared with RF and SVM, the classification advantages of XGB for broadleaf, bare area and shadow were not significant in the three optimized feature subsets, but the classification advantage for Moso bamboo is more significant (). Otherwise, the paired t-test was also performed for the classification differences of Moso bamboo in SVM-RFE-XGBoost, RF-RFE-XGBoost and XGBoost-RFE-XGBoost (). Obviously, the difference of classification accuracy between SVM-RFE-XGBoost and RF-RFE-XGBoost is not significant, the difference of classification accuracy between SVM-RFE-XGBoost and RF-RFE-XGBoost is significant (p < 0.05), and the difference of classification accuracy between RF-RFE-XGBoost and XGBoost-RFE-XGBoost is highly significant (p < 0.01), which demonstrated the statistically significant advantage of XGBoost-RFE-XGBoost in classifying Moso bamboo forest with far-reaching research implications.
Table 8. Paired t-test of classification accuracy based on SVM-RFE.
Table 9. Paired t-test of classification accuracy based on RF-RFE.
Table 10. Paired t-test of classification accuracy based on XGBoost-RFE.
Table 11. Paired t-test for the classification accuracy differences of Moso bamboo in SVM-RFE-XGBoost, RF-RFE-XGBoost and XGBoost-RFE-XGBoost.
3.3.2.3. Comparison of model generalization capability
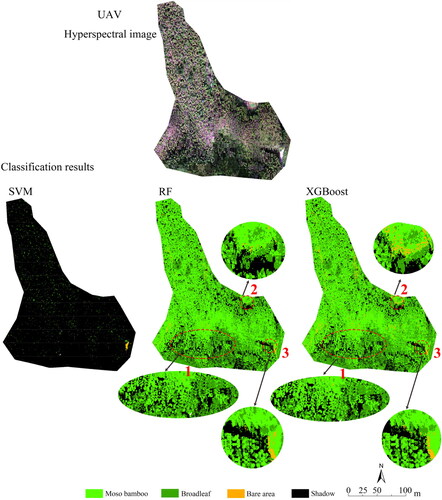
To further investigate the differences in the ability to extract information from Moso bamboo forest among models, the inversion test results ( and ) of the other two UAV hyperspectral images obtained near the test area were compared based on the optimized features of XGBoost-RFE. It can be seen that compared with the RF and XGBoost, the extraction effects of SVM were worse in two test results, which showed that SVM had limitations in generalization when dealt with multi-class classification problems (Lu and Pan Citation2019). From the inversion results of RF and XGBoost, the overall differences in the extraction effects of the two models on Moso bamboo forest were small, but there were still obvious areas of difference (the parts in the red dashed circle in and ). The areas of differences between the inversion results of the two algorithms are mainly in the identification of the information in shaded areas, and the XGBoost algorithm was slightly better than RF in the identification of the features in shaded areas, which is beneficial to the extraction of the Moso bamboo forest information in shaded areas.
Figure 10. Comparison test 1 of inversion results of different algorithms based on XGBoost-RFE. Positions 1 and 2 were the locations where the differences between RF and XGBoost models were significant, respectively.
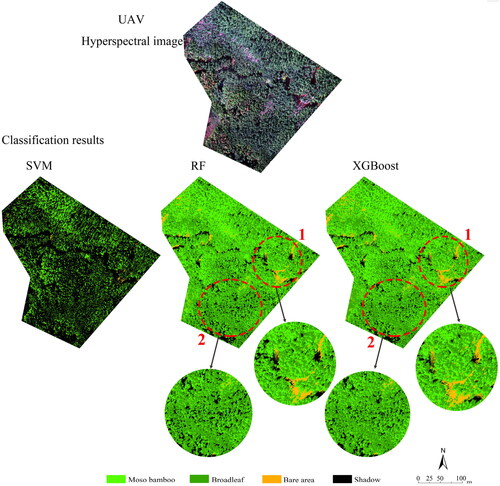
Figure 11. Comparison test 2 of inversion results of different algorithms based on XGBoost-RFE. Positions 1, 2 and 3 were the locations where the differences between RF and XGBoost models were significant, respectively.
4. Discussion
The existence of shaded areas in the hyperspectral images had caused a certain negative impact on the distinction of features (Karoui and Djerriri Citation2018). The shaded areas that existed in this study were small, the confusion with other features was less, and a certain number of the main research object—Moso bamboo samples were selected in the shaded areas, so the existence of shadow did not affect the overall classification accuracy of Moso bamboo. However, in subsequent studies, if there was a large area of shadow in the study area and the degree of confusion with features was more serious, it is recommended to perform shadow compensation and correction of images.
There were many variables including original spectra, CR spectra, vegetation indices and texture features in the modeling of this study, and feature redundancy is inevitable; therefore, a suitable method needs to be projected to conduct feature optimization. In this study, SVM, RF and XGBoost combined with RFE were used for feature optimization. For determining the number of various feature parameters further, cross-validation was combined with RFE, and SVM-RFE, RF-RFE and XGBoost-RFE algorithms based on cross-validation were proposed. The feature combinations were cross-validated to finally determine the optimal feature subset. However, SVM-RFE, RF-RFE and XGBoost-RFE are black box models, each of which selected a different subset of features and ranked the importance of features differently, making it difficult to explain the relationship between each of the optimized feature indicators and each type of surface feature, so it is important to perform variance analysis on the optimized feature indicators to manifest the effectiveness of optimized features to each type of surface features. In this study, the process of feature optimization by SVM-RFE, RF-RFE and XGBoost-RFE, followed by variance analysis" could objectively select the most optimal feature indicators and explain their usability.
The UAV data obtained in this study took an altitude of 90 m. However, it is easy to find from the research results that there was an improvement in the classification accuracy of the features, but the lower the altitude of the UAV is, the better it is. The lower the altitude of the UAV, the smaller its flight coverage and the higher the flight cost, and it is easy to crash into trees and blow up the aircraft; it is difficult to obtain effective spatial resolution when the flight altitude is too high. Related scholars have studied from this perspective, such as Zhang et al. (Citation2020) proved through experiments that the best accuracy of standing bamboo degree identification was achieved in Moso bamboo forest with 2100 plants/hm2 density at an altitude of 150 m; Fu et al. (Citation2021) used the combination of UAV technology and RGB vegetation index to prove that the suitable altitude of different vegetation indices varied at different ranks of grass cover, from which it can be seen that the research on the controlled application conditions of UAV aerial height needs to be further developed. Therefore, the follow-up research of this study can conduct from the perspective of the best detection altitude of UAV, explore the most suitable altitude of hyperspectral images for classification at different regional scales (e.g., fields or farms), and further explore the effective information in the images from the perspective of spatial location (especially in areas with large topographic relief) and long time series, etc.
5. Conclusions
In this study, Risen UAV with HS-RPL hyperspectral image acquisition platform was used to extract and analyze sensitive indicators of various surface features, and combined with machine learning algorithms to establish SVM, RF and XGBoost Moso bamboo information extraction models, respectively. The research results showed that:
The original and CR spectral curves of two vegetation species, Moso bamboo and broadleaf, differed more from bare area and shadow, but the spectral curves between Moso bamboo and broadleaf were seriously confused and poorly distinguishable to some extent. Although UAV hyperspectral image has many advantages, it is difficult to identify Moso bamboo forest only through spectral features to a certain extent. It is very necessary to extract Moso bamboo forest information by combining vegetation index and texture features.
SVM-RFE feature optimized model selected 22 features, including 5 original spectra, 6 CR spectra and 11 vegetation indices; RF-RFE feature optimized model selected 23 features, including 13 original spectra and 10 vegetation indices; XGBoost-RFE feature optimized model selected 22 features, including nine original spectra, 11 vegetation indices and 2 texture features. The optimized feature subset based on each feature optimized algorithm showed significant difference patterns of surface features.
The SVM-RFE, RF-RFE and XGBoost-RFE-based models all had the ability to identify and extract Moso bamboo information. A comprehensive comparison of classification accuracy and generalization capability of each model showed that the XGBoost-RFE-XGBoost-based Moso bamboo information extraction model is optimal in classifying Moso bamboo forests from other features and fully mining their information.
This study fully mined the original spectra, CR spectra, vegetation indices and texture feature information of the UAV hyperspectral image to obtain a high accuracy of Moso bamboo classification, explored the effectiveness and applicability of multiple machine learning algorithms combined with RFE for feature optimization, and then found the XGBoost-RFE-XGBoost was the best model of Moso bamboo information extraction using the paired t-test. The difference of model comparison results based on multiple machine learning algorithms is small but significant in the work of UAV information extraction in small areas, thus it has vital practical value for the study of Moso bamboo forest information extraction in larger and more complex terrain areas of multi-source remote sensing data, which is crucial for monitoring and managing the Moso bamboo resources as well as providing a reference for giving full play to its ecological and economic benefits.
Authors’ Contributions
Conceptualization, Y.L., Z.X. and Q.Z.; methodology and software, Y.L., Z.X. and Q.Z.; data collection and process, Y.L., Q.Z. and X.H.; validation and modification, B.L. and A.H.; writing—original draft preparation, Y.L.; writing—review and editing, Y.L., Z.X., Z.H., X.Y., Z.L. and X.G.; project administration, Z.X.; funding acquisition, Z.X. All authors have read and agreed to the published version of the manuscript.
Acknowledgements
The authors would like to thank the anonymous reviewers for their tremendous time, helpful suggestions, and insightful comments, which greatly improved our manuscript.
Disclosure Statement
No potential conflict of interest was reported by the authors.
Data Availability Statement
Data and associated codes are available from the corresponding author upon reasonable request.
Additional information
Funding
References
- Alharan AFH, Fatlawi HK, Ali NS. 2019. A cluster-based feature selection method for image texture classification. IJEECS. 14(3):1433–1442. doi: 10.11591/ijeecs.v14.i3.pp1433-1442.
- Anderson K, Gaston KJ. 2013. Lightweight unmanned aerial vehicles will revolutionize spatial ecology. Front Ecol Environ. 11(3):138–146. doi: 10.1890/120150.
- Aparicio N, Villegas D, Royo C, Casadesus J, Araus JL. 2004. Effect of sensor view angle on the assessment of agronomic traits by ground level hyper-spectral reflectance measurements in durum wheat under contrasting Mediterranean conditions. Int J Remote Sens. 25(6):1131–1152. doi: 10.1080/0143116031000116967.
- Atmoko D, Lin TH. 2022. Sea salt aerosol identification based on multispectral optical properties and its impact on radiative forcing over the ocean. Remote Sens. 14(13):3188. doi: 10.3390/rs14133188.
- Berni JAJ, Zarco-Tejada PJ, Suarez L, Fereres E. 2009. Thermal and narrowband multispectral remote sensing for vegetation monitoring from an unmanned aerial vehicle. IEEE Trans Geosci Remote Sens. 47(3):722–738. doi: 10.1109/TGRS.2008.2010457.
- Breiman L. 2001. Random forest. Mach Learn. 45(1):5–32. doi: 10.1023/A:1010933404324.
- Buschmann C, Nagel E. 1993. In vivo spectroscopy and internal optics of leaves as basis for remote sensing of vegetation. Int J Remote Sens. 14(4):711–722. doi: 10.1080/01431169308904370.
- Cai LF, Wu DS, Fang LM, Zheng XY. 2019. Tree species identification using XGBoost based on GF-2 images. Forest Resour Manag. (5):44–51.
- Cao J, Leng W, Liu K, Liu L, He Z, Zhu Y. 2018. Object-based mangrove species classification using unmanned aerial vehicle hyperspectral images and digital surface models. Remote Sens. 10(2):89. doi: 10.3390/rs10010089.
- Chen TQ, Guestrin C. 2016. XGBoost: a scalable tree boosting system. In Proceeding of 30th International Conference on Machine Learning. p. 13–17.
- Colomina I, Molina P. 2014. Unmanned aerial systems for photogrammetry and remote sensing: a review. ISPRS J Photogramm Remote Sens. 92:79–97. doi: 10.1016/j.isprsjprs.2014.02.013.
- Cui L, Du HQ, Zhou GM, Li XJ, Mao FJ, Xu XJ, Fan WL. 2019. Combination of decision tree and mixed pixel decomposition for extracting bamboo forest information in China. J Remote Sens. 23(1):166–176.
- Elarab M, Ticlavilca AM, Torres-Rua AF, Maslova I, McKee M. 2015. Estimating chlorophyll with thermal and broadband multispectral high resolution imagery from an unmanned aerial system using relevance vector machines for precision agriculture. Int J Appl Earth Observ Geoinf. 43:32–42. doi: 10.1016/j.jag.2015.03.017.
- Erudel T, Fabre S, Houet T, Mazier F, Briotte X. 2017. Criteria comparison for classifying peatland vegetation types using in situ hyperspectral measurements. Remote Sens. 9(7):748. doi: 10.3390/rs9070748.
- Fernández-Manso A, Fernández-Manso O, Quintano C. 2016. SENTINEL-2A red-edge spectral indices suitability for discriminating burn severity. Int J Appl Earth Observ Geoinf. 50:170–175. doi: 10.1016/j.jag.2016.03.005.
- Feyisa GL, Meilby H, Fensholt R, Proud SR. 2014. Automated water extraction index: a new technique for surface water mapping using landsat imagery. Remote Sens Environ. 140:23–35. doi: 10.1016/j.rse.2013.08.029.
- Freeman EA, Moisen GG, Coulston JW, Wilson BT. 2016. Random forests and stochastic gradient boosting for predicting tree canopy cover: comparing tuning processes and model performance. Can J For Res. 46(3):323–339.
- Fu S, Zhang YH, Li JY, Wang MZ, Peng L, Feng QS, Liang TG. 2021. Influence of different vegetation indices and heights of UAVs on the accuracy of grassland coverage estimation. Pratacult Sci. 38(1):11–19.
- Gitelson AA, Gritz Y, Merzlyak MN. 2003. Relationships between leaf chlorophyll content and spectral reflectance and algorithms for non-destructive chlorophyll assessment in higher plant leaves. J Plant Physiol. 160(3):271–282. doi: 10.1078/0176-1617-00887.
- Gitelson AA, Merzlyak MN. 1994. Quantitative estimation of chlorophyll-a using reflectance spectra: experiments with autumn chestnut and maple leaves. J Photochem Photobiol B Biol. 22(3):247–252. doi: 10.1016/1011-1344(93)06963-4.
- Gitelson AA, Merzlyak MN, Zur Y, Stark R, Gritz U. 2001. Non-destructive and remote sensing techniques for estimation of vegetation status. Pap Nat. 273:205–210.
- Gratani L, Crescente MF, Varone L, Fabrini G, Digiulio E. 2008. Growth pattern and photosynthetic activity of different bamboo species growing in the botanical garden of Rome. Flora. 203(1):77–84. doi: 10.1016/j.flora.2007.11.002.
- Griffiths F, Kuemmerle T, Baumann M, Radeloff VC, Abrudan IV, Lieskovsky J, Munteanu C, Ostapowicz K, Hostert P. 2014. Forest disturbances, forest recovery, and changes in forest types across the Carpathian Ecoregion from 1985 to 2010 based on landsat image composites. Remote Sens Environ. 151:72–88. doi: 10.1016/j.rse.2013.04.022.
- Guo CF, Guo XY. 2016. Estimation of wetland plant leaf chlorophyll content based on continuum removal in the visible domain. Acta Ecol Sin. 36(20):6538–6546.
- Haboudane D, Miller JR, Tremblay N, Zarco-Tejada PJ, Dextraze L. 2002. Integrated narrow-band vegetation indices for prediction of crop chlorophyll content for application to precision agriculture. Remote Sens Environ. 81(2–3):416–426. doi: 10.1016/S0034-4257(02)00018-4.
- Han N, Du HQ, Zhou GM, Sun XY, Ge HL, Xu XJ. 2014. Object-based classification using SPOT-5 imagery for moso bamboo forest mapping. Int J Remote Sens. 35(3):1126–1142. doi: 10.1080/01431161.2013.875634.
- Houdanon RD, Mensah S, Gnanglè C, Yorou NS, Houinato M. 2018. Ecosystem services and biomass stock from bamboo stands in central and southern Benin, West Africa. Energ Ecol Environ. 3(3):185–194. doi: 10.1007/s40974-018-0084-0.
- Huete AR. 1988. A soil-adjusted vegetation index (SAVI). Remote Sens Environ. 25(3):295–309. doi: 10.1016/0034-4257(88)90106-X.
- Jiang Z, Huete AR, Didan K, Miura T. 2008. Development of a two-band enhanced vegetation index without a blue band. Remote Sens Environ. 112(10):3833–3845. doi: 10.1016/j.rse.2008.06.006.
- Jiang YF, Zhang L, Yan M, Qi JG, Fu TM, Fan SX, Chen BW. 2021. High-resolution mangrove forests classification with machine learning using worldview and UAV hyperspectral data. Remote Sens. 13(8):1529. doi: 10.3390/rs13081529.
- Joyce KE, Anderson K, Bartolo RE. 2021. Of course we fly unmanned-we’re women!. Drones. 5(1):21. doi: 10.3390/drones5010021.
- Karoui MS, Djerriri KA. 2018. New unmixing-based approach for shadow correction of hyperspectral remote sensing data. In IEEE Geosci. Remote Sens. Symp. (IGARSS), p. 2725–2728.
- Li YG, Du HQ, Mao FJ, Li XJ, Cui L, Han N, Xu XJ. 2019. Information extracting and spatiotemporal evolution of bamboo forest based on landsat time series data in Zhejiang Province. Sci Silvae Sin. 55(3):88–96.
- Li Z, Kobayashi M. 2004. Plantation future of bamboo in China. J For Res. 15(3):233–242. doi: 10.1007/BF02911032.
- Li YC, Li CM, Li Y, Liu ZZ. 2019. Influence of variable selection and forest type on forest aboveground biomass estimation using machine learning algorithms. Forests. 10(12):1073. doi: 10.3390/f10121073.
- Lin TH, Tsay SC, Lien WH, Lin NH, Hsiao TC. 2021. Spectral derivatives of optical depth for partitioning aerosol type and loading. Remote Sens. 13(8):1544. doi: 10.3390/rs13081544.
- Liu HP, Hui-Jun AN. 2019. Analysis of T&N band advantage in tree species classification based on Worldview-2. J West China For Sci. 48(3):41–46.
- Liu S, Jiang QG, Ma Y, Xiao Y, Li YH, Cui C. 2017. Object-oriented wetland classification based on hybrid feature selection method combining with relief F, multi-objective genetic algorithm and random forest. Trans Chin Soc Agric Mach. 48(1):119–127.
- Li Z, Zhang QY, Qiu XC, Peng DL. 2019. Temporal stage and method selection of tree species classification based on GF-2 remote sensing image. Chin J Appl Ecol. 30(12):4059–4070.
- Li PH, Zhou GM, Du HQ, Lu DS, Mo LF, Xu XJ, Shi YJ, Zhou YG. 2015. Current and potential carbon stocks in moso bamboo forests in China. J Environ Manage. 156:89–96. doi: 10.1016/j.jenvman.2015.03.030.
- Lu XX, Pan LP. 2019. Comparing ELMs and SVMs generalization performance on multi-class classification problem. Comput Appl Softw. 36(10):262–267.
- Lu M, Pebesma E, Sanchez A, Verbesselt J. 2016. Spatio-temporal change detection from multidimensional arrays: detecting deforestation from MODIS Time Series. ISPRS J Photogramm Remote Sens. 117:227–236. doi: 10.1016/j.isprsjprs.2016.03.007.
- Lv WJ, Zhou GM, Chen GS, Zhou YF, Ge ZP, Niu ZW, Xu L, Shi YJ. 2020. Effects of different management practices on the increase in phytolith-occluded carbon in moso bamboo forests. Front Plant Sci. 11:591852. doi: 10.3389/fpls.2020.591852.
- Maschler J, Atzberger C, Immitzer M. 2018. Individual tree crown segmentation and classification of 13 tree species using airborne hyperspectral data. Remote Sensing. 10(8):1218–1247. doi: 10.3390/rs10081218.
- Matese A, Toscano P, Gennaro SF, Genesio L, Vaccari FP, Primicerio J, Belli C, Zaldei A, Bianconi R, Gioli B. 2015. Intercomparison of Uav, aircraft and satellite remote sensing platforms for precision viticulture. Remote Sens. 7(3):2971–2990. doi: 10.3390/rs70302971.
- Maxwell AE, Warner TA, Fang F. 2018. Implementation of machine-learning classification in remote sensing: an applied review. Int J Remote Sens. 39(9):2784–2817. doi: 10.1080/01431161.2018.1433343.
- Maxwell AE, Warner TA, Strager MP, Conley JF, Sharp AL. 2015. Assessing machine-learning algorithms and image-and Lidar-derived variables for GEOBIA classification of mining and mine reclamation. Int J Remote Sens. 36(4):954–978. doi: 10.1080/01431161.2014.1001086.
- Maxwell AE, Warner TA, Strager MP, Pal M. 2014. Combining RapidEye Satellite Imagery and LiDAR for mapping of mining and mine reclamation. Photogramm Eng Remote Sens. 80(2):179–189. doi: 10.14358/PERS.80.2.179-189.
- Milosevic M, Jankovic D, Peulic A. 2014. Thermography based breast cancer detection using texture features and minimum variance quantization. Excli J. 13:1204–1215.
- Osco LP, Ramos APM, Faita Pinheiro MM, Moriya ÉAS, Imai NN, Estrabis N, Ianczyk F, Araújo FFd, Liesenberg V, Jorge LAdC, et al. 2020. A machine learning framework to predict nutrient content in Valencia-orange leaf hyperspectral measurements. Remote Sens. 12(6):906. doi: 10.3390/rs12060906.
- Ozkan UY, Ozdemir I, Saglam S, Yesil A, Demirel T. 2016. Evaluating the woody species diversity by means of remotely sensed spectral and texture measures in the urban forests. J Indian Soc Remote Sens. 44(5):687–697. doi: 10.1007/s12524-016-0550-0.
- Pal M. 2005. Random forest classifier for remote sensing classification. Int J Remote Sens. 26(1):217–222. doi: 10.1080/01431160412331269698.
- Pargal S, Fararoda R, Rajashekar G, Balachandran N, Réjou-Méchain M, Barbier N, Jha C, Pélissier R, Dadhwal V, Couteron P. 2017. Inverting aboveground biomass-canopy texture relationships in a landscape of forest mosaic in the Western Ghats of India using very high resolution Cartosat imagery. Remote Sens. 9(3):228. doi: 10.3390/rs9030228.
- Peñuelas J, Gamon JA, Fredeen AL, Merino J, Field CB. 1994. Reflectance indices associated with physiological changes in nitrogen and water-limited sunflower leaves. Remote Sens Environ. 48(2):135–146. doi: 10.1016/0034-4257(94)90136-8.
- Qi SH, Song B, Liu C, Gong P, Luo J, Zhang MA, Xiong TW. 2022. Bamboo forest mapping in china using the dense Landsat 8 image archive and Google earth engine. Remote Sens. 14(3):762. doi: 10.3390/rs14030762.
- Ruwaimana M, Satyanarayana B, Otero V, Muslim AM, Syafiq AM, Ibrahim S, Raymaekers D, Koedam N, Dahdouh GF. 2018. The advantages of using drones over space-borne imagery in the mapping of mangrove forests. PLoS One. 13(7):e0200288. doi: 10.1371/journal.pone.0200288.
- Sakamoto T, Gitelson AA, Nguy-Robertson AL, Arkebauer TJ, Wardlow BD, Suyker AE, Verma SB, Shibayama M. 2012. An alternative method using digital cameras for continuous monitoring of crop status. Agric For Meteorol. 154–155:113–126. doi: 10.1016/j.agrformet.2011.10.014.
- Shang, Z. Z., G. M. Zhou, H. Q. Du, X. J. Xu, Y. J. Shi, Y. L. Lu, Y. F. Zhou and C. Y. Gu. 2013. Moso bamboo forest extraction and aboveground carbon storage estimation based on multi-source remotely sensed images. Int J Remote Sens 34 (15–16): 5351–5368. doi: 10.1080/01431161.2013.788260.
- Sims DA, Gamon JA. 2002. Relationships between leaf pigment content and spectral reflectance across a wide range of species, leaf structures and developmental stages. Remote Sens Environ. 81(2–3):337–354.
- Stagakis S, Vanikiotis T, Sykioti O. 2016. Estimating forest species abundance through linear unmixing of CHRIS/PROBA imagery. ISPRS J Photogramm Remote Sens. 119(9):79–89. doi: 10.1016/j.isprsjprs.2016.05.013.
- Tucker CJ. 1979. Red and photographic infrared linear combinations for monitoring vegetation. Remote Sens Environ. 8(2):127–150. doi: 10.1016/0034-4257(79)90013-0.
- Vincini M, Frazzi E. 2011. Comparing narrow and broad-band vegetation indices to estimate leaf chlorophyll content in Planophile crop canopies. Precision Agric. 12(3):334–344. doi: 10.1007/s11119-010-9204-3.
- Vogelmann JE, Rock BN, Moss DM. 1993. Red edge spectral measurements from sugar maple leaves. Int J Remote Sens. 14(8):1563–1575. doi: 10.1080/01431169308953986.
- Wang Q,Zhao Y,Yang F,Liu T,Xiao W,Sun H. 2021. Simulating heat stress of coal gangue spontaneous combustion on vegetation using alfalfa leaf water content spectral features as indicators. Remote Sens. 13(13):2634.
- Wang T, Zhang H, Lin H, Fang C. 2015. Textural-spectral feature-based species classification of mangroves in Mai Po nature reserve from worldview-3 imagery. Remote Sens. 8(1):24. doi: 10.3390/rs8010024.
- Wen XL, Zhong A, Hu XJ. 2018. The classification of urban greening tree species based on feature selection of random forest. J Geo-Inf Sci. 20(12):1777–1786.
- Xie ZL, Chen YL, Lu DS, Li GY, Chen EX. 2019. Classification of land cover, forest, and tree species classes with ZiYuan-3 multispectral and stereo data. Remote Sens. 11(2):164. doi: 10.3390/rs11020164.
- Xu ZH, Liu J, Yu KY, Gong CH, Xie WJ, Tang MY, Lai RW, Li ZL. 2013. Spectral features analysis of Pinus massoniana with Pest of Dendrolimus Punctatus walker and levels detection. Spectrosc Spectral Anal. 33(2):428–433.
- Xu Y, Zhen JN, Jiang XP, Wang JJ. 2021. Mangrove species classification with UAV-based remote sensing data and XGBoost. J Remote Sens. 25(3):737–752.
- Zhang L, Gong ZN, Wang QW, Jin DD, Wang X. 2019. Wetland mapping of Yellow River delta wetlands based on multi-feature optimization of sentinel-2 images. J Remote Sens. 23(2):313–326.
- Zhang CY, Xie ZX. 2013. Object-based vegetation mapping in the Kissimmee River watershed using HyMap Data and machine learning techniques. Wetlands. 33(2):233–244. doi: 10.1007/s13157-012-0373-x.
- Zhang CH, Yang ZP, Xie QY, Deng YB, Yu KY, Liu J. 2020. Study of effective height of the living bamboo density identification based on unmanned aerial vehicle (UAV) remote sensing. Remote Sens Technol Appl. 35(6):1436–1446.
- Zhao QZ, Jiang P, Wang XW, Zhang LH, Zhang JX. 2021. Classification of protection forest tree species based on UAV hyperspectral data. Trans Chin Soc Agric Mach. 52(11):190–199.
- Zheng D, Shen GC, Wang BJ, Dai GH, Lin F, Hu JR, Ye J, Fang S, Hao ZQ, Wang XG. 2022. Classification of dominant species in coniferous and broadleaf mixed forest on Changbai Mountain based on UAV-based hyperspectral image and deep learning algorithm. Trans Chin Soc Agric Mach. 41(5):1024–1032.
- Zhong LH, Hu LN, Zhou H. 2019. Deep learning based multi-temporal crop classification. Remote Sens Environ. 221:430–443. doi: 10.1016/j.rse.2018.11.032.
- Zhou GM, Meng CF, Jiang PK, Xu QF. 2011. Review of carbon fixation in bamboo forests in China. Bot Rev. 77(3):262–270. doi: 10.1007/s12229-011-9082-z.
- Zhou XC, Zheng L, Huang HY. 2021. Classification of forest stand based on multi-feature optimization of UAV visible light remote sensing. Sci Silvae Sin. 57(6):24–36.