
 ?Mathematical formulae have been encoded as MathML and are displayed in this HTML version using MathJax in order to improve their display. Uncheck the box to turn MathJax off. This feature requires Javascript. Click on a formula to zoom.
Abstract
Urbanization increases the proportion of non-agricultural workforce, and changes in land use land cover from agricultural to non-agricultural pattern continuously through time. This study designed to analyse land use land cover (LULC) dynamics in Dukem town using remote sensing & GIS techniques between 2003 and 2019 years. The Primary data sources were collected through observations and secondary data sources were collected using remotely sensed satellite images. The key results of this study revealed that built-up area augmented severely from 698.06 ha (16.45%) in 2003 to 3,091.67 hectare (72.81%) in 2019. Specifically, agricultural land extremely decreased in all years from 2,764.37 hectare (65.12%) in 2003 to 999.05 hectare (23.53%) in 2019. Hence, accordingly, this incident reduced agricultural land and increased built areas dramatically.
1. Introduction
Urbanization as a process of urban expansion is a worldwide phenomenon (UN-Habitat Citation2006). This process consists of rapid population growth, increase in the proportion of non-agricultural workforce, and changes in land use from agricultural to non-agricultural pattern (G/Hiwot Citation2006; UN-Habitat Citation2006; Beka Citation2016). Many reports and literature show that urban expansion is increasing at an alarming rate in developing countries when compared to developed countries. According to Marshall et al. (Citation2009), this rapid urban growth in developing nations is encouraged by different factors including rural urban migration, social, cultural, economic and technological change as well as rapid population growth. This global population growth increases the expansion of human settlement; principally the trends towards urbanization that contribute the conversion of agricultural farmland to urban land uses (UN-Habitat Citation2000; G/Hiwot Citation2006).
Recently, African urbanization is characterized by rapid and uncontrolled urban growth. This results in LULC changes and environmental problems (Shishay Citation2011). In Ethiopia, urban areas are growing at elevated rate than ever before. This rapid urbanization is accelerated by multi factors such as rural urban migration, natural population growth, economic growth, and favourable government policy (Leulsegged et al. Citation2011).
Moreover, urbanization and urban growth are considered as a modern way of life manifesting. However, urbanization and urban development in Ethiopia faced a number of problems due to unplanned settlement (Tegegne Citation2002). According to Adem (Citation2010), the internal political developments, the introduction of motor vehicles, the improvements of communications and the introduction of railway significantly impacted the process of urbanization. And the introduction of the Ethio-Djibouti railway was a major development of the period that stimulated the country’s foreign and domestic trade which resulted in the formulation of a number of towns along the line. The railway provided the first modern link between Ethiopia and the outside world. It became the main artery of foreign trade and gave birth along the railway line, to new towns such as Dire Dawa, Adama, Mojo, Bishoftu, Dukem and Aqaqi. Accordingly Dukem town was established around 1902 as a centre of posting for Ethio-Djibouti railway line (Bahiru Citation1991).
Dukem town is the fast growing urban centres in Oromia special zone surrounding the capital Addis Ababa. The town has practiced the highest level of land use land cover conversion for new residential settlements and industrial uses following its proposal as an ‘Industrial Hub’ or ‘Eastern Industry Zone (EIZ)’ of the country in 2005 (Diriba et al. Citation2016). Hence, the expansion of the town is becoming uncontrolled due to rapid growth of industry, manufacturing sector, service and its proximity to Addis Ababa. These opportunities have had increased local investment that reduced an agricultural land and increased built-up areas through time that damage existing ecosystem. This could be gaps to be filled out.
This study seeks to analyse land use land cover (LULC) change in Dukem town using remote sensing & GIS techniques between the years 2003 and 2019. In order to obtain the precise findings the following specific objectives are considered: i) to map the extent of horizontal expansion of Dukem town using GIS techniques ii) to analyse land use land cover (LULC) dynamics and iii) to estimate future expansion of the town for the coming ten years. The most silent hypothesis of this research is; there will be no more expansion in the Dukem town.
2. Materials and method
2.1. Study area description
Dukem town is located at 37 km South East of Addis Ababa along the main road to Adama as shown in ). Geographically, the study area located by latitude 8°45′25″N–8°50′30″N and longitude 38°51′55″E–38°56′5″E covering a total area of 9630.6 hectare. It is located at an average altitude of 2100 m above sea level. The town is bounded in the southeast by Bishoftu town but by Gelan town in most parts of north direction. The remaining eastern and western parts of the town are bounded by four neighbouring peasant associations of Akaki district (OUPI 2017).
Figure 1. Location map of Dukem town.
Source: Field survey, 2022.
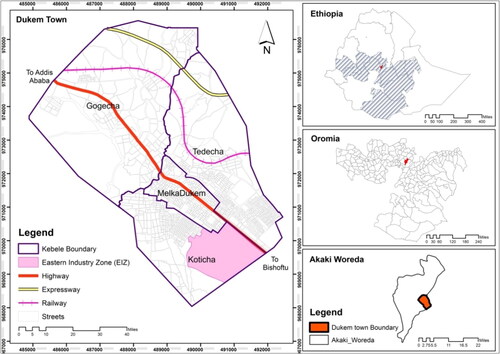
Besides, the town is located on the National Trade Route (NTR) line, bisected by the National highway road from Addis Ababa to Djibouti, making transportation access to all national, regional and district urban centres. Also, National Railway Line (NRL) crossing the town and Addis-Adama express was passing through the town. The town is also characterized by one of those towns with high concentration of industries due to its high proximity to the national market of Addis Ababa.
The elevation of the town ranges from 1890 to 2300 m above Mean Sea Level with an altitudinal range of 410 m. The north eastern, northern and eastern parts of the town are generally characterized by rugged topography. On the other hand, the southern and western parts of Dukem have monotonous flat topography (OUPI 2017).
2.2. Data type, sources of data and methods
The United States Geological Survey (USGS) is a gold mine of information and the known source of satellite image that covers wide areas (Sewunet Citation2017). In order to address the stated objectives of the study both qualitative and quantitative approach as well as primary and secondary data sources were used. The Primary data sources were collected using frequent observations of the town and the secondary data sources were collected using remote sensing and GIS techniques.
High-quality cloud free Satellite images were selected from row 54 and path 168, full scenes. The January season of the year is preferred to get cloud free images for ease of classification and facilitate comparison in classification activities. These data’s are used to produce the historical land use/land cover maps of the study area and urban expansion changes. The images were downloaded from Earth Explore USGS website and then finally processed and analysed using the GIS 10.2.2 software.
2.3. Specific method
In the Pre-processing, Satellite images were downloaded from the Earth Explorer website. Geometric rectifications, re-projection and clipping by the study area were performed for all images and classifications of images were done additionally. During the classification process, it is rare to find clearly defined classes that one would like. Therefore this study was established its own classification scheme based on visual interpretation of satellite images. Thus, five (5) LULC main categories were selected for the purpose as shown in .
Table 1. Land-use land-cover (LULC) categories.
2.4. Data analysis method
LULC change detection analysis is computed using equations adopted from Sewunet (Citation2017) to measure the changes of each category.
where T1 is earlier point of time and T2 is the later or recent point of time in the series.
Spatial expansion rate analysis is also computed using equations adopted from Sewunet (Citation2017) to measure the total areas covered by each class in each study year.
where: DC = dynamic change, T1 and T2 = years, BA1 = built-up area at T1, and BA2= built-up area at T2.
Future built-up area computation is computed using equations of exponential growth model adopted from Dean (Citation2013).
where Bf = current built up, Bo = initial built up, r = growth rate and t = Time (year).
where B = Built-up area, f = future year, o = initial/base year, % (r) = average growth rate per year and t = time in year.
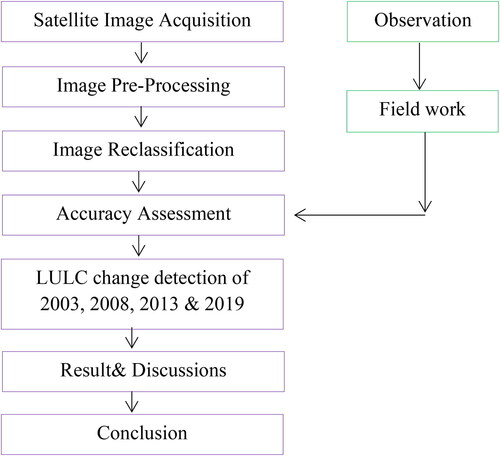
2.5. Study framework
In general the spatial analysis method was applied using RS, GIS and Satellite images of the town from 2003 to 2019 years using remote sensing and then finally processed and analysed using the GIS 10.2.2 software. The framework was validated by narrating primary data, jotting known variables, applying statistics, selecting samples, explaining the methods used, performing data analysis and explaining the results (see ). These all procedures were taken as validation steps. Hence, accordingly the overall procedures of the methods were presented as follows:
Figure 2. Flowchart of the study.
2.6. Tools and software programs
In this research, Arc GIS 10.2.2, Remote Sensing Techniques (RST) and USGS website were used to analyse and process the obtained data. Moreover the detail points were presented in and . However, Sentinel 2 images were not used because of accessibility.
Table 2. Satellite images and sources.
Table 3. Tools and software programs.
3. Results
Results obtained reveal that urban settlements usually emerge as the result of people’s permanent settlements around religious, political centres, trade, other economic activities and historical trends clearly specified that the foundation of Dukem town was connected with the construction of railway line from Dijoubuti to Addis Ababa in the late ninetieth century. Accordingly, Dukem began to mushroom beginning from 1914 (OUPI 2017). Thus, trend or change detection has been done first by image preprocessing (un-supervised) and then image processing (supervised) ( and ).
Figure 3. Un-supervised LULC conversion in 2003 and 2008.
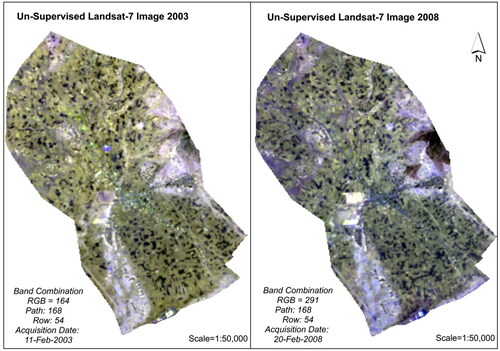
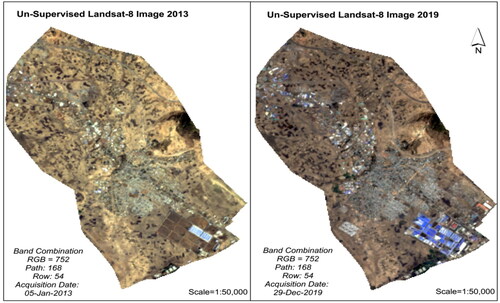
Figure 4. Un-supervised LULC conversion in 2013 and 2019.
The trend analysis of the study has shown that, the town stretch from the centre to the northern Addis Ababa and to the southern Bishoftu direction along the main road to the eastern region corridor. Dukem has emerged as one of an industrial urban centre in the region and the country at large since the beginning of 2000s and known as the Eastern Industrial Zone (EIZ). The town is expanding to a large extent encompassing the rural villages of Waajitu, Dibdibbe, Yaatu and Oda Nabe ().
Figure 5. Supervised LULC conversion in 2003 and 2008.
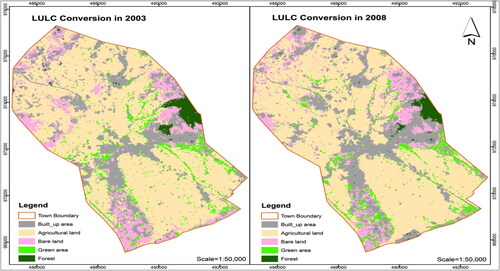
Figure 6. Supervised LULC conversion in 2013 and 2019.
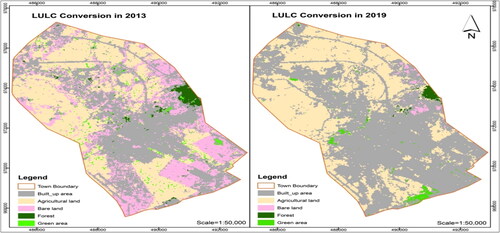
At the beginning in 2003, the town was occupied only small area at the centre and there was no much change in years between 2003 and 2008. But the town began to expand a little bit towards the north to Addis Ababa city and to the south Bishoftu town following the major asphalt road of eastern corridor. Then the growth of the town dramatically changed between the years 2008 and 2013 following the development of Eastern Industry Zone (EIZ) and this continued between the years 2013 and 2019.
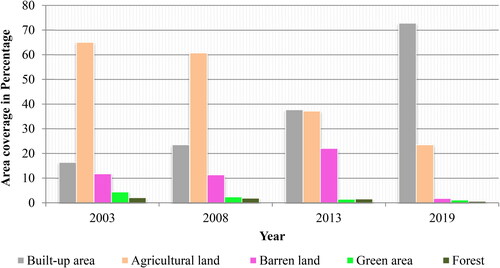
Similarly, studies revealed that land use and land cover (LULC) change analysis results were shown the rapid increase in built-up areas expansions characterized by horizontal physical expansion led to dramatic changes against fertile agricultural land. Moreover, as presented in , built-up area increased dramatically from 698.06 ha (16.45%) in 2003 to 3,091.67 hectare (72.81%) in 2019. This indicated that built areas consuming a considerable amount of other land use land cover (LULC) types while agricultural land extremely decreased in all years from 2,764.37 hectare (65.12%) in 2003 to 999.05 hectare (23.53%) in 2019 which indicating its highest contribution to built-up areas.
Table 4. Total amount of land in hectares for each category from 2003 to 2019.
The trend of other categories varies by increasing and decreasing at various times in the past ten years. The increase in barren land in 2013 was the result of land taken by investors but not developed yet and due to the existence of areas like rock and gully areas, which are unsuitable for agricultural areas. However, this decreased later dramatically in 2019, showing the utilization of these areas for agricultural land and its conversion into built-up areas. This is presented graphically (see and ). In addition rapid industrialization and manufacturing accompanied with rapid urban population growth and urban sprawling, leading to the incorporation of the fringe areas and significantly affect the size of fertile agricultural land and most of the converted lands for industrial establishments were underdeveloped or were not even developed at all.
Figure 7. Graph of total area for all land use land cover classes from 2003 to 2019.
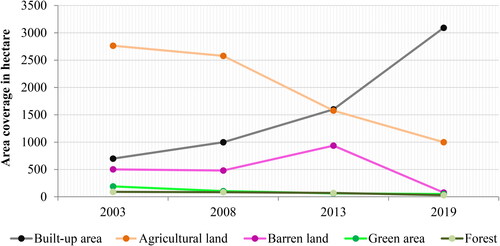
Figure 8. Percentage of each land-use types in the landscape from 2003 to 2019.
The change in built-up area between the year 2003 and 2019 were mapped and compared to find the changes in each year as shown on the map with the green colour representing the built-up area for 2003. The red colour for 2008, the yellow colour represents the growth of built-up area in 2013 and the orange colour represents the profound expansion of built-up area in 2019. The expansion of built-up area from 2013 to 2019 was very special in that it covered almost double growth of the town and increased by a large amount of land which indicated rapid and unprecedented urban growth of the town consuming the surrounding non-built-up areas ().
Figure 9. Overlaid built-up area of Dukem town from 2003 to 2019.
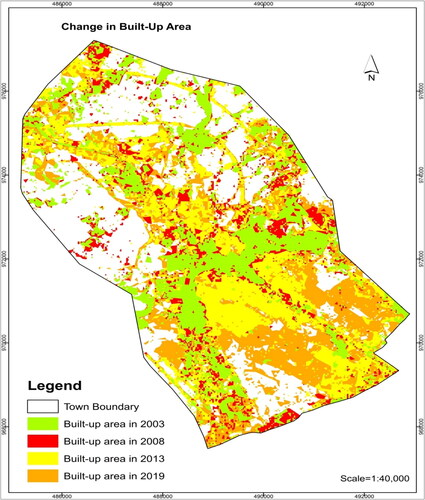
Besides, the built-up area of the town was increased in its spatial extent by 8.6% from 2003 to 2008, 12.1% from 2008 to 2013 and 15.5% from 2013 to 2019 per year. The dynamic change between 2003 and 2008 was lower than other periods. The rate of change for the two periods from 2008 to 2013 and 2013 to 2019 is among the highest. This indicated that the trend of urban expansion is more and more increasing, particularly in the past eleven years. It means that an agricultural land around the town was incorporated into urban areas and became much more valuable land for new housing and industrial uses.
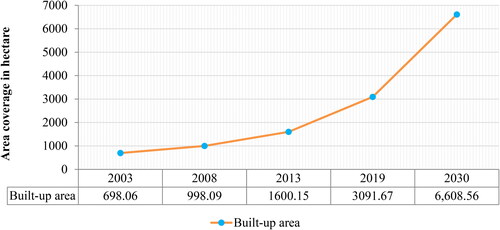
The rapid expansion of built-up area of the town increased in all direction but it was more pronounced along the major roads north to south, southwestern and southeastern part of the town. According to the built-up area estimation made on this study for the coming ten year in 2030, Dukem town will be expected to reach about an average of 6,608.56 hectare built area in the coming 2030 which is increased by 3516.89 hectare from 2019. It means 113.75% expansion. If local government prepared a structure plan for the town in 2017 for ten years, the new prepared structure plan demarcated a total of 9630.3 hectare of land.
4. Discussion
G/Hiwot (Citation2006), Marshall et al. (Citation2009), Aburas et al. (2017) and findings of this study revealed that urban settlements usually emerge as the result of people’s permanent settlements around religious, political centres, trade and other economic activities. Besides, the historical trends clearly specified the foundation of Dukem town is connected with the construction of railway line from Dijoubuti to Addis Ababa in the late ninetieth century and the town began to mushroom beginning from 1914.
Results indicated that the town has grown intensely in all directions between the years 2008 and 2019 in built-up areas expansion. Similarly, studies revealed that land use and land cover (LULC) change analysis results were shown the rapid increase in built-up areas expansions characterized by horizontal physical expansion led to dramatic changes against fertile agricultural land and sensitive environment (Leulsegged et al. Citation2011; Diriba et al. 2015; Parvaiz et al. Citation2017; Sewunet Citation2017). This study similarly showed that built-up area increased dramatically from 698.06 ha (16.45%) in 2003 to 3,091.67 ha (72.81%) in 2019. This indicated that built areas consuming a considerable amount of other land use land cover (LULC) types while agricultural land extremely decreased in all years from 2,764.37 ha (65.12%) in 2003 to 999.05 ha (23.53%) in 2019 which indicating its highest contribution to built-up areas.
Lastly, Handy et al. (Citation2003), Tilahun (Citation2016) and result of this study showed that from 2003 to 2008, the population size of Dukem town was increased by 11,335. From 2008 to 2013, it was increased by 10,193 which are 33.38%, and from 2013 to 2019, the population number of the town was raised by 55,588 which is 136.47%. Finally, the estimated number of population from 2019 to 2030 will be increased by 85,200, which will be 88.25%. On the other hand, the built-up area of the town was increased by 300.03 hectare which was 42.98% of the total land from 2003 to 2008, then the built up area of the town was increased by 602.06 hectare which was 60.32% of the total land from 2008 to 2013 and it was expanded to 1491.52 hectare which was 93.21% of the total land from 2013 to 2019 and the estimated expansion of built up area from 2019 to 2030 will be increased by 3516.89 hectare which will be 113.75% of the total land (see ).
Figure 10. Built-up area estimation.
5. Conclusion and recommendations
5.1. Conclusion
Dukem town has grown intensely in all directions particularly between the years 2008 and 2019. The trend analysis of LULC dynamics has shown that, built-up area increased dramatically from 698.06 hectares (16.45%) in 2003 to 3,091.67 hectares (72.81%) in 2019. This indicated that built areas consuming a considerable amount of other LULC types while agricultural land extremely decreased in all years from 2,764.37 hectare(65.12%) in 2003 to 999.05 hectare (23.53%) in 2019, which indicate its highest contribution to built-up areas and became much more valuable land for new housing and industrial uses. Similarly, land use and land cover change analysis results were shown the rapid increase in built-up areas expansions characterized by horizontal physical expansion led to dramatic changes against fertile agricultural land and sensitive environment.
Moreover, if the town’s expansion remained consistent, Dukem is predicted to reach an average built-up area of 6,608.56 hectares by the year 2030. It will grow by 3516.89 hectares starting in 2019, which is an expansion rate of 113.75%. A total of 9630.3 hectares of land were delimited by the newly drafted structure plan in the years 2027, which has ramifications for the town’s potential future growth. The town’s main growth directions are only to the east and west; it is already landlocked in the north with Gelan and the south with Bishoftu. Identifying the key actors and factors in Dukem expansion will be future research area for the researchers.
5.2. Recommendations
The following points recommended for local stakeholders:
All policy makers and planners have to consider the expected future expansion of the town, planning concepts of smart g city, compact city and high density of mixed-use and infill development for safeguarding the fertile agricultural land and natural environments. Additionally, applying strong efficient land management and monitoring tools through implementing and applying GIS and remote sensing techniques in supervision of urban land use change and its proper implementation according to the prepared plan.
References
- Adem K. 2010. Urban expansion and the neighbourhoods: the case of Bishoftu Town, East Shewa Zone, Oromia Regional State. M.A Thesis in Public Administration, Addis Ababa University.
- Bahiru Z. 1991. A history of modern Ethiopia. James Currey; Addis Ababa University Press; p. 1855–1974.
- Beka G. 2016. Urban expansion and its socio-economic impacts on the livelihood of the farming community in Sululta.
- Dean H. 2013. Modeling population growth: exponential and hyperbolic modeling. J Appl Math. 4:299–304. http://www.scirp.org/journal/am.
- Diriba D, Azadib H, Feyera S, Ketema A, Taherif F, Stellmacher T. 2016. Urban sprawl and its impacts on land use change in Central Ethiopia. J Urban Forest Urban Green. 16:132–141.
- G/Hiwot B. 2006. Urban growth and its impact on land use, the case of Mekelle [M.A. thesis]. Addis Ababa: Ethiopian Civil Service College.
- Handy S, Paterson R, Song J, Rajamani J, Jung J, Bhat C, Kockelman K. 2003. Techniques for mitigating urban sprawl: goals, characteristics, and suitability factors. Austin (TX): University of Texas; p. 120.
- Leulsegged K, Gete Z, Dawit A, Fitsum H, Heinimann A. 2011. Impact of urbanization of Addis Abeba city on peri-urban environment and livelihoods.
- Marshall F, Waldman L, MacGregor H, Mehta L, Randhawa P. 2009. On the edge of sustainability. Perspectives on peri-urban dynamics. STEPS Working Paper 35, Brighton.
- Oromia National Regional State Urban Planning Institute. 2017. Dukem town structure plan study report. Addis Ababa.
- Parvaiz AB, Miftaul S, Abaas AM, Pervez A. 2017. Urban sprawl and its impact on landuse/land cover dynamics of Dehradun City, India. Int J Sustain Built Environ. 6:513–521.
- Sewunet S. 2017. Urban sprawl mapping and landuse change detection using spatial metrics method: A case study of Addis Ababa city and its surrounding areas. Ethiopia: LAP LAMBERT Academic Publishing.
- Shishay M. 2011. The impacts of urban built-up area expansion on the livelihood of farm households in the peri-urban areas of Mekelle city: the capital of Tigray regional state.
- Tegegne G/E. 2002. Urban poverty and the environmental: illustration from Addis Ababa, in Ethiopia. Ethiopian Dev Forum. 1:76–84.
- Tilahun S. 2016. RS & GIS integrated study on urban sprawl with its effects on surrounding farming communities.
- UN-Habitat. 2000. Strategies to combat homelessness. Kenya, Nairobi: Blackwell.
- UN-Habitat. 2006. State of the worlds; the millennium development goals and urban sustainability. 30 years of shaping the habitat agenda. London: UN habitat.