
Abstract
Forest reserves play an important role in the provision of ecosystem goods and services; however, these reserves are facing increasing anthropogenic impacts primarily because of agricultural activities. In sub-Saharan Africa, studies on understanding the extent and impacts of agricultural expansion into forest reserves are generally lacking. Thus, this study aimed to assess the extent of agricultural expansion into forest reserves in Zambia on a national scale between 2000 and 2018 and explores the drivers. We used a remote sensing approach by employing Google Earth Engine (GEE) and Random Forests classifier to map land cover changes at five-time steps: 2000, 2005, 2010, 2015 and 2018. Landsat images were used to map six land cover classes (forest, cropland, wetland, grassland, settlement, and water body) determined by the Intergovernmental Panel on Climate Change (IPCC). A social survey was also undertaken to understand the drivers of agricultural expansion into forest reserves at two study sited located in eastern and north-western part of Zambia. Based on the land cover maps which were produced with high accuracies ranging from 82% to 94%, the results indicated a general decline of 10% in forest area and an increase of 25% in cropland. Almost 50% of the forest reserves in Zambia are experiencing some form of encroachment, and 10% of these are heavily encroached (>90% loss). Local communities indicated that population growth, loss of soil fertility, high market demand for crops, land tenure system, and lack of law enforcement are the major drivers of agricultural expansion into forest reserves. This study highlights the need for policy marker to consider trade-offs in agricultural expansion and conservation of forest reserves relation to population growth. Enhancing sustainable agricultural practices and strengthening the implementation of different legislative frameworks is key in addressing the challenges of conservation, while enhancing food security.
1. Introduction
The growing world population which is projected to reach about 9.7 billion by 2050 and peak at nearly 11 billion around 2100 (Tariq et al. Citation2022), is exerting pressure on the global demand for food which has led to an increasing demand for land (Ramankutty et al. Citation2002; DeFries et al. Citation2010; Ezeh et al. Citation2012; Schneibel et al. Citation2016). This increase in human population implies increasing agricultural production and establishing more housing units to support humans. Consequently, as contended in literature (Foley et al. Citation2011), one of the most pressing global concerns is meeting the rising human needs for higher amounts and quality food while preserving biodiversity and maintaining essential ecosystem services. Although agricultural practices have improved globally, especially with advancing mechanization and improved farming practices, the demand for suitable land which supports different agricultural activities still exists. According to Hussain et al. (Citation2022a), anthropogenic activities impacts are worsened by the impacts of climate change which contribute to crop failure. This challenge is more pronounced in sub-Saharan Africa where most of the farmers have limited financial resources for inputs and machinery hence practicing shifting cultivation by abandoning land after several years in search of fertile land (Jayne et al. Citation2010; Misaki et al. Citation2018). This scenario is worsened by low productivity with little application of science and technology, a situation that leaves farmers with no other option but to resort to increasing area under production through opening of new forest fields in a bid to increase production (Chauvin et al. Citation2012; IPCC 2019; FAOSTAT Citation2021). Due to this challenge of shifting from one place to the other, some farmers have expanded or opened agricultural fields in protected areas such as forest reserves and wildlife reserves (e.g. National Parks).
Rapid agricultural expansion into protected areas has become an important topic in the global environment because of biodiversity loss, climate change, and loss of soil resources (Li et al. Citation2016; Tariq et al. Citation2022). In sub-Saharan Africa, agricultural activities are classified as one of the top drivers of biodiversity loss (Kalaba et al. Citation2013; Handavu et al. Citation2019). With human impacts on the environment estimated to increase the global temperature by 1 to 2 °C (Feddema et al. Citation2005), biodiversity loss due to agricultural expansion is of global concern. Moreover, Tariq et al. (Citation2022) indicated that crop production is closely linked to the ecology and the general climate (i.e. temperature and rainfall) for a particular area. Population increase has already been a challenge for sub-Saharan Africa because the demographic changes create increasing pressure on existing natural resources (e.g. forests, water and wildlife) through agriculture and urbanization (DeFries et al. Citation2010). Recent agricultural expansions affect major protected areas and are mainly associated with human disturbances (e.g. deforestation). However, the extent of such expansions into forest reserves and associated impacts have not been addressed in many countries such as Zambia (Li et al. Citation2016). Furthermore, understanding the dynamics of agricultural food production within the context of agricultural expansion, is critical for the conservation of forest resources, and the future sustainability of agricultural production and development in sub-Saharan Africa.
Monitoring vegetation dynamics is essential in addressing risks of increasing forest loss and to maximise land productivity (Hu et al. Citation2021; Kamwi et al. Citation2018). Establishing the spatial extent of agricultural expansion and understanding the change drivers are major goals of current research, especially with increasing deforestation rates (Lambin et al. Citation2001; Feddema et al. Citation2005). Many past studies have focused on socio-economic, demographic, political, technological and biophysical factors of forest loss in the sub-Saharan region (Du et al. Citation2014; Handavu et al. Citation2019). For example, Kamwi et al. (Citation2018) included biophysical, neighbourhood, and socio-economic factors in investigating forest cover change in the mountainous area in Namibia between 1980 and 2000. Similarly, Kindu et al. (Citation2015) investigated the factors of forest change in Ethiopia between 1973 and 2012. These previous studies have two things in common: (1) similar groups of driving factors, and (2) long-term period of analysis (Quintero-Gallego et al. Citation2018). However, these studies did not focus on forest change in protected areas such as forest reserves. To effectively monitor forest resources and agricultural production, there is increasing need for accurate and reliable information, and geospatial technologies is one of the perfect options available (Ernst et al. Citation2013; Sharifi et al. Citation2022).
Google Earth Engine (GEE), a cloud-based computing platform, can solve the most significant problems with respect to land cover mapping of large areas (Phiri and Morgenroth Citation2017; Mutanga and Kumar Citation2019; Phan et al. Citation2020). Users can easily access, select and process large volumes of data for a large study area without downloading the data on the local computers. Another important aspect that makes GEE effective is the availability of algorithms simplifying access to remote sensing tools for both experts and non-experts (Turner et al. Citation2015; Phan et al. Citation2020; Phiri et al. Citation2020). Moreover, a remote sensing approach complemented with qualitative analysis (e.g. social survey) have shown to produce deep insights in various aspects of crop production and land cover change (McIver and Friedl Citation2001; Kotsiantis et al. Citation2006; Jucker et al. Citation2017; Handavu et al. Citation2019; Hussain et al. Citation2022b). Thus, in this study, we also test the effectiveness of applying GEE and a socioeconomic approach to understand the aspect of agricultural expansion into forest reserves, especially in sub-Saharan Africa.
In the Zambian context, land cover changes have been considerably high, with rates of forest loss of up to 453, 000 ha yr−1 (Phiri et al. Citation2019a). Past studies have assessed the causes of land cover change, especially deforestation (Vinya Citation2012; Handavu et al. Citation2019; Phiri et al. Citation2019b). These studies are mainly characterized by spatial and temporal limitations (Chomba et al. Citation2012; Handavu et al. Citation2019; Phiri et al. Citation2022). Consequently, no study has a spatial approach of reporting on the extent of agricultural expansion into protected areas (i.e. forest reserves) in Zambia at a national scale. This study aims to assess the extent of agricultural expansion into forest reserves and understand the factors driving these changes on a national scale. Here our hypothesis was that agricultural expansion into forest reserves has increased over the years due to increasing demand for land, mainly due to increasing population. To address this hypothesis, this study includes two aspects of agricultural expansion into forest areas: (1) temporal analysis using land cover maps for 2000 - 2018, and (2) factors of agricultural expansion into forest reserves.
This study makes two major contributions towards the scientific body of knowledge; (1) we used the contemporary geospatial tools to understand the expansion of agricultural activities into reserves, these tools can be used in other study areas; and (2) enhancing climate change mitigation by reducing and reversing the expansion of agricultural areas in forest reserves. Thus, new insights have been developed on how to improve agricultural policies that take into consideration of management of forest reserves. This knowledge will guide decision makers on how to develop policies that take into consideration the trade-off between agricultural expansion and sustainable forest management by considering issues of food security (Felegari et al. Citation2021; Tariq et al. Citation2022), conservation and climate change (Hussain et al. Citation2022a).
2. Materials and methods
2.1. Study area
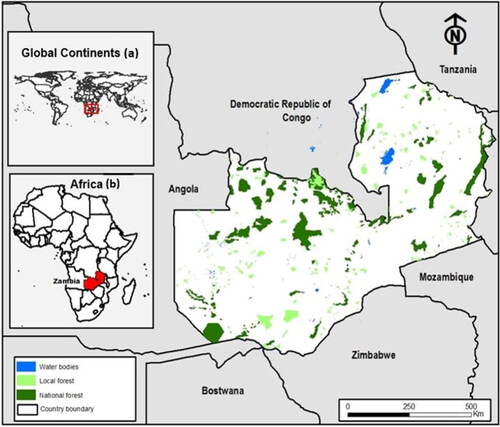
This study was conducted at a national level in Zambia which has a total surface area of 752, 617 km2. Zambia is a southern African country located between latitude 8°S and 18°S, and longitude 22°E to 34°S and bordering eight other countries (). The country has an elevation ranging from 350 m in the southern region to 2,888 m above sea level in the northern region. The climate is subtropical with temperatures ranging from 7 to 35 °C, and rainfall ranging from 400 mm in the southern part of the country to 1,500 mm in the north. The major land cover at present is the native forest which is under different dynamics because of disturbances, despite its contribution towards rural livelihood (Handavu et al. Citation2019).
Figure 1. Location of Zambia and its neighbouring countries. The map also shows the distribution of the study area - National and local forest reserves - across Zambia. The geographic location of the study areas at global continental level is shown in insertion (a), while the location of Zambia in African is presented in insertion (b).
Zambia has a population of about 20 million with 65% of the population located in rural areas (ZamStats Citation2010). Agriculture is an important source of livelihood for majority of the rural population. The national population is highly characterised by rural-urban migration as people migrate from rural to urban areas in search of employment, business opportunities and education (Zulu et al. Citation2019). Majority of the farmers are categorised as small-scale farmers cultivating areas of 1–5 ha annually. Major crops grown by small-scale farmers include maize, soya beans, groundnuts and other cash crops including tobacco and cotton. Due to soil fertility loss, especially for areas that is cultivated for more than five years, most farmers practise shifting cultivation in search of fertile soils.
2.2. Datasets
2.2.1. Remote sensing data
We used Landsat images to conduct land cover classification in this study. The classification was done in five-time steps between 2000 and 2018. The five-time steps included 2000, 2005, 2010, 2015 and 2018. It is important to note that our final year for analysis was 2018 because this work is part of the project which had a lifespan of three years which ended in 2018. In addition, we chose this time frame because during this period, the government of Zambia introduced strong policies for economic diversification through agriculture (e.g. National Agriculture Policy 2004–2015, Urban and Regional Planning Act 2015, National Agricultural Investment Plan 2014–2018), which largely affected the forest sector.
Landsat Enhanced Thematic Mapper Plus (ETM+), Landsat Thematic Mapper (TM), and Landsat Operational Land Image (OLI) images were used (). The original source for Landsat data is the United States Geological Survey (USGS) website (http://glovis.usgs.gov) (Woodcock et al. Citation2008; Phiri and Morgenroth Citation2017). When using Google Earth Engine (GEE), there is no need to download the data to local computers as the platform works based on cloud computing.
Table 1. Characteristics of remotely sensed images used in this study. The dates of acquisition are not specific because more than 40 images were used at each classification stage. However, all the images were acquired in September.
2.2.2. Auxillary data
We also used auxiliary spatial datasets such as administrative boundaries, and official forest area boundaries acquired from the Forest Department of Zambia. These datasets were used to understand the extent of forest cover change in protected areas, especially at post-classification level. We also used Shuttle Radar Topography Mission (STRM) DEM (http://glovis.usgs.gov) elevation to understand elevation issues across the study area. The datasets were projected to the common coordinate system – WGS 84, Zone 35S.
2.3. Methodology
2.3.1. Image preprocessing
The major challenge with land cover classification in the study area was the cloud cover. As an initial step for image classification, we selected a strategic time of the year when the study area did not have much cloud cover. Images for September were used since the rain season in Zambia ends in May and starts in November. Most of the prominent vegetation during this time of the year was predominately large trees as the grass would have been burnt by seasonal fires that occurred between May and October. Tariq et al. (Citation2022) highlighted the need of selecting images of a particular period when the parameters linked to vegetation phenology are clear. In addition to these seasons, we only selected images with less than 10% cloud cover. In cases where there were no clear images, we applied cloud masking. We used the Top of atmosphere (TOA) reflectance image and hence there was no need for atmospheric corrections as their images were already converted from digital values to reflectance. Since images at TOP correction level are still subject to effects of haze effect, we also conducted a dark object subtraction (DOS) procedure in order to improve the quality of the images.
2.3.2. Land cover classification in Google Earth Engine (GEE)
We employed Google Earth Engine (GEE) to conduct the land cover classification. In GEE, the analysis of all available remotely sensed images is done on the web-based code editor without downloading these datasets. In this study, we used six land cover classes () recommended by the Intergovernmental Panel on Climate Change (IPCC).
Table 2. The LULC classification scheme based on recommendations by the Intergovernmental Panel on Climate Change (IPCC).
2.3.3. Sample selection
We created 2000 random samples in form of points, for classification and validation using a 7 to 3 ratio, respectively. This means that 70% (1400 points) of the samples were used for training, while 30% (600 points) were used for validation. These samples were created in ArcMap10.7 (ESRI, Redlands, California, USA) using a tool called “Create Random Points”. By referring to past studies on land cover classification in Zambia (Phiri et al. Citation2019a) and expert knowledge, we approximated the ratio of the sampling points for each land cover. We then uploaded the sample points in GEE and employed visual inspection to assign a land cover class to each point by creating polygons around the point these polygons were used to extract pure pixel for each land cover. Our final step on training was to make sure that the samples assigned to each land cover class are matching with what was earlier established using the ratio. In cases where the assigned samples were over- or underestimated, we manually adjusted the training samples by adding or removing some samples. It is important to note that we only used polygons during training, while points were used during the validation process.
2.3.4. Random forest
We chose Random Forest algorithm, which is found in GEE by adopting codes from Maples (Citation2021). This classifier is one of the most used algorithms in land cover classification because of three major reasons: (1) good performance with high dimension dataset, (2) good handling of outliers and noise data, and (3) higher classification accuracy than other popular classifiers such as support vector machine (SVM), maximum-likelihood classification (MLC) and classification tree (CT). Based on the recommendations of previous studies (Kotsiantis et al. Citation2006; Duro et al. Citation2012), we selected 100 trees (ntree = 100), while mtry was set to the default value (square root of the total number of features).
2.3.5. Accuracy assessment
The 600 random points were used for accuracy assessment using the confusion matrix approach. The distribution of these points to each land cover was based on the spatial extent of the land cover from the thematic maps (see Supplementary Material for the allocation). This is a procedure similar to cart correction-a correction to error matrix which incorporated area proportion for each land cover. Thus, land cover maps such as forests had more validation points. For each classification year, we extracted measures such as the overall accuracy (OA), producer’s accuracy (PA) and user’s accuracy (UA). We also followed up on the classification errors for each map and conducted the classification after making the necessary adjustments.
2.3.6. Change detection
After achieving a classification accuracy of 80% and above, we then exported the classified maps into ArcMap for further analysis. After converting the thematic maps to vector format, the spatial analyst tools were used to conduct change detection. The information was then summarised in a transition metrics table. Specific land cover transitions were then recorded between time periods.
We also focused on the forest areas by clipping these areas by official forest boundaries which were sources from the Forestry Department. The changes within the forest reserves, especially the expansion due to agricultural practices were recorded.
2.3.7. Drivers of agriculture expansion in forest reserves
To complement the remote sensing-based analysis, we followed a similar approach to Hussain et al. (Citation2022b) who employed a qualitative analysis by atministering questionnaires to local farmers. Here the study was done based on cross-sectional data collection from farmers using a qualitative survey in which a semi-structured questionnaire was used as the survey instrument. The survey was conducted between September 2019 and March 2020. Two major sites were selected in two Agro-ecological zones: Zone II and III. Chitokoloki in Zambezi District, and Lukweta in Katete District of Zambia were selected and delineated on the basis of rainfall patterns and the soil characteristics. . Chitokoloki receives higher rainfall compared to Lukweta.
Targeted farming communities for the survey were those in close proximity to the forest reserves (with 10 Km radius). A total of 400 questionnaires were administered, 200 in each of the two sites based on farmers’ register provided by extension officers from the Ministry of Agriculture. The target respondents were selected at random from the village registers. The following were the major focus of the questionnaire.
Demographic attribute of respondents
Socio-economic attributes (e.g., income levels, employmenet)
Details of farming charcteristics (e.g., farming practices, farming inputs)
Natural resources utilisation (e.g tree, land in forest reserves).
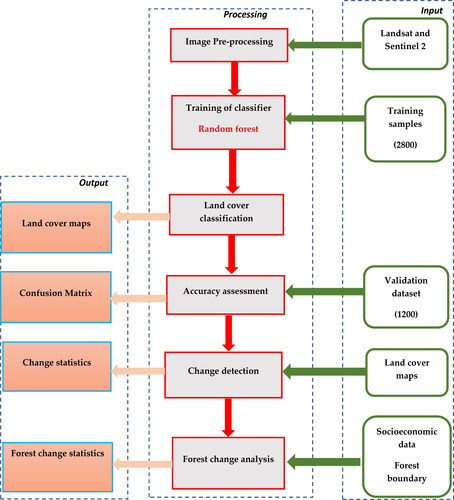
We focused on the drivers of agricultural expansion into forest reserves and the use of forest resources by the communities. Data was analysed using the Statistical Package for Social Sciences (SPSS) Version 18. shows a flowchart of the whole methodology used in this study.
Figure 2. A summary of the methodology followed in this study. The land cover analysis was mainly conducted in Google Earth Engine (GEE) by using the freely available Landsat images.
3. Results
3.1. Land use/land cover and accuracy assessment
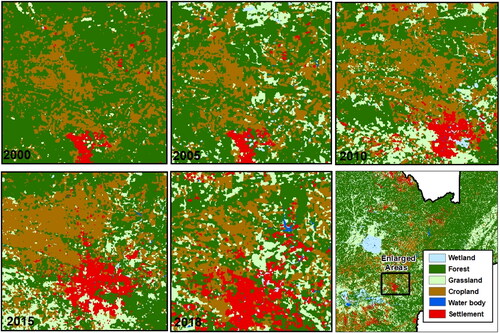
shows land cover classification maps of the five-time steps: 2000, 2005, 2010, 2015, and 2018. The maps generally show a declining trend in the number of forest resources from 2000 to 2018, while other land covers such as cropland and settlement showed increasing trends. The maps show that there were more changes in the southern part of the country, perhaps because of the major agricultural activities and increased urbanisation. Detailed changes illustrating increasing agricultural expation in forest reserves is preseneted in .
Figure 3. Land cover map for the period between 2000 and 2018. Land covers such as settlements are not clearly visible on the map because of the area they (<1%) occupy compared to the whole study area.
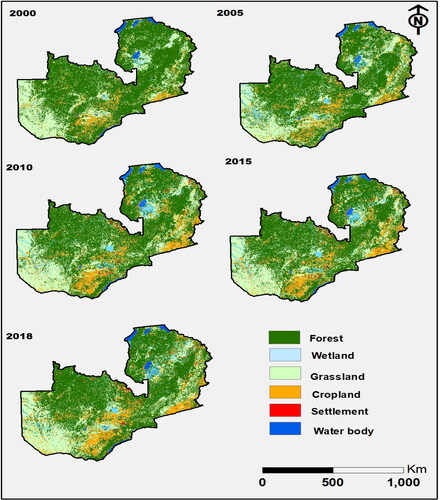
Figure 4. A detailed map showing increasing agricultural areas and settlements in central part of Zambia. Although the expansion is not in forest reserves, forest loss has occurred from impacts that have originated from outside the reserves.
summarizes the accuracy assessment for the five classification steps: 2000, 2005, 2010, 2015, and 2018. Overall accuracies ranging between 85 and 94% were achieved on these land cover maps. The maps for 2015 and 2018 had higher classification accuracy because of better characteristic on the Landsat OLI 8 images. The user’s and producer’s accuracies were also high (> 70%) indicating that the land cover classes were produced with high accuracy.
Table 3. Summary of the classification accuracy for the five classification steps (2000, 2005, 2010, 2015 and 2018) in percentage (%).
3.2. Land cover change for Zambia
It was observed from the analysis that Zambia has recorded a significant loss of about 3 million hectares of forest cover between 2000 and 2018 representing about 8%. This is not only limited to forests within the forest reserves and other gazetted areas but the entire forests across the country. Of the 3 million hectares of lost forest cover, about 2.8 million hectares were converted into cropland in both forest reserves and open areas. Cropland increased by 2.4 million hectares between 2000 and 2018 with the largest contribution to agricultural expansion being from the forest land. Grassland recorded an increase of about 3%, while wetland recorded a small increase of about 0.4%. Settlements on the other hand recorded the highest percentage increase of about 41%. Most of the transition to settlement came from grassland and forest areas ().
Table 4. Landcover change metrics across Zambia between 2000 and 2018.
3.3. Forest and cropland dynamics across Zambia
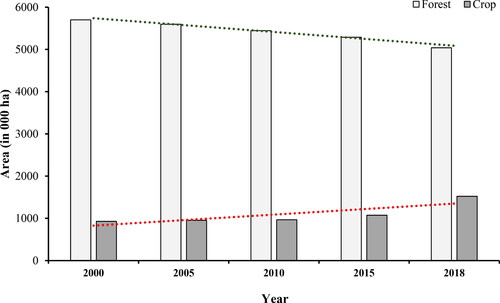
Overall, the results show a decreasing trend of forest cover in Zambia from 47.41 million ha in 2000 to 42.12 million ha in 2018. Cropland increased from 6.16 million in 2000 to 8.53 in 2018 (). Specifically, forest cover in forest reserves reduced by 8% (from 5.69 million ha in 2000 to 5.04 million ha in 2018), while cropland increased in the forest reserves by 22% (from 0.98 million ha in 2000 to 1.52 million ha in 2018 (). The decline in forest cover might also be associated with other land covers such as the expansion of settlement and creation of other facilities such as dams; however, this other expansion only contributed to up to 1%.
Figure 5. Area covered by forest reserves and cropland across the country between 2000 and 2018. Note that the statistics indicated here in the graph was derived from the land cover analysis from the current study.
3.4. Agricultural expansion in forest reserves
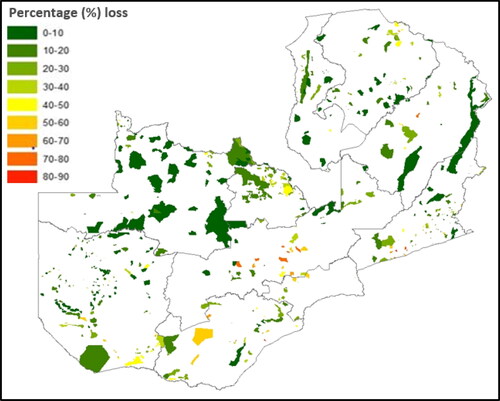
Of the official 480 existing forest reserves, we narrowed down to 347 reserves to understand the pattern of cropland expansion. We reduced the number of forest reserves in this study due to two major reasons: (1) some forest reserves only existed on record while they are under different land use/cover types such as settlement or water; and (2) other forest reserves are in the final stages of being degazetted (lawful declaration of not been protected areas), as such, there considered not to be forest reserves. About 41.5% (n = 144) of these reserves were under encroachment; 10% were heavily encroached, while 49% were still intact. These levels of forest expansion were verified by field visits to 104 forest reserves which indicated that some forest reserves only existed on paper.
shows the extent of agricultural expansion in forest reserves. Agricultural expansion in these areas ranged from less than 10% to forests reserves which were fully encroached (>90%). Most of the heavily encroached forests were in the southern part of the country, while most of the forests in the northern part of the country had less than 10% encroachment level. Generally, the forest reserves in the high rainfall belt (Region III), showed some signs of low encroachment than those in low rainfall regions. Perhaps this is because of their capabilities to recover after a period of disturbance.
Figure 6. The level of agricultural expansion in forest reserves across Zambia present in percentage.
Overall, cropland in forest reserves increased by about 172,000 ha. The period between 2010 and 2015 indicated the highest increase in cropland of 23, 500 ha, while the period between 2000 and 2005 had the lowest forest expansion of about 3, 500 ha. The high increase in forest area between 2010 and 2015 could be due to increasing demand for land for agriculture and settlements.
3.5. Drivers of agricultural expansion to forest reserves
3.5.1. Demography of respondents
The survey included exploring gender, age group, and socioeconomic attributes. The results show that 63% (n = 200) of the respondents were males, while 37% were females in Chitokoloki. For Lukweta, males were 66% (n = 200), while females 33% (). Most of the respondents where between the age of 30–35 years of age with primary levels of education.
Table 5. Gender distribution for Chitokoloki and Lukweta.
The type of livelihood activities being practiced in these areas was also investigated. Agriculture crop farming was cited to be the highest (88% for Chitokoloki and 91% for Lukweta), while other activities included livestock farming, trading, and employment. Thus, the income activities identified in both areas included crop farming (61%), trading (22%), charcoal production, (13%), and beekeeping (4%).
3.5.2. Factors driving agricultural expansion
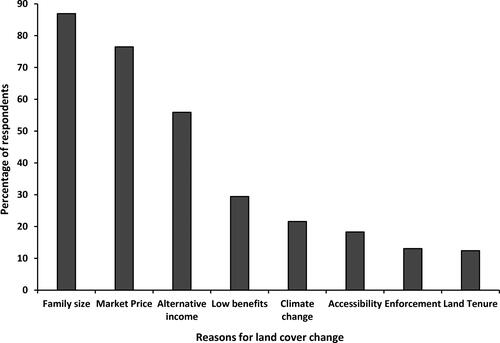
During the survey, community members indicated that the loss of forest cover in Zambia has been attributed to increased demand for land for agriculture, which is largely driven by population increase, soil fertility loss, lack of alternative sources of income, easy accessibility to forest reserves, and law enforcement (). It is important to note that agricultural expansion has also been exacerbated by the introduction of new technologies in farming practices (i.e. improved seed variety, access to agricultural inputs, mechanisation). It was also noted that crop failure due to changes in rainfall activities has been driving both drought and floods. As a result, farmers are forced to open forest areas for crop production. This was the main reason the respondents cited climate change as a driver of forest loss.
A larger proportion (83%) of the community indicated that expansion of agricultural area into forest reserves was largely driven by the increase in family size and other factors such as high poverty levels, loss of soil fertility in existing farmlands, and lack of forest management ().
Figure 7. Reasons for agricultural expansion into forest reserves based on a socio-economic survey conducted in two study sites. The highest percentage (87%) of respondents attributed the expansion to the increase in family size.
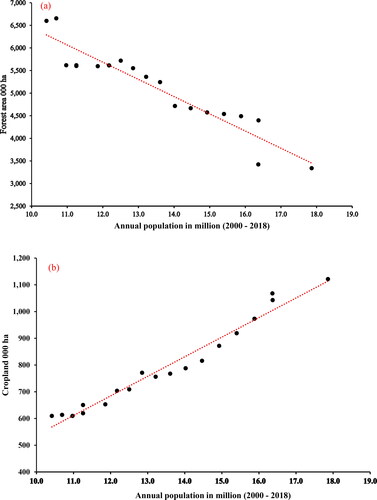
Community members indicated that the size of cultivated land had increased and expanded into forest reserves, communal forests, and other forests. They also perceived that this trend would continue in future because they would need more agricultural land. Projections based on the data gathered during the survey indicate that 11 million ha of land will be required to support the agriculture expansion by 2050. The actual future demand for land for agriculture will be higher than projected because the population is expected to double by 2050. shows the trends between population growth and major land cover (forest and cropland).
Figure 8. The relationship between the major land covers - (a) forest and (b) cropland - and the underlining driving factors of forest loss and agricultural expansion – population growth.
4. Discussion
This is the first study to document the national wide agricultural expansion in forest reserves in Zambia. The recent land cover maps of 2015 and 2018 had higher classification accuracy compared to the other maps. The high accuracy for all the maps can be attributed to the effectiveness of the random forest classifier and the better characteristics for the Landsat OLI images compared to the earlier Landsat images (Kindu et al. Citation2015; Turner et al. Citation2015). Although land cover maps were produced with high overall accuracy (82 to 94%), this can still translate in large marginal errors when these results are used in post classification change detection (Ghorbanian et al. Citation2020; Mukul & Herbohn Citation2016; Searchinger et al. Citation2015). These levels of accuracy are comparative to other studies which achieved high accuracies when Landsat images were employed in monitoring vegetation dynamics over a long period of time using classifiers such as Maximum Likelihood (Kamwi et al. Citation2018; Hussain et al. Citation2022a) and Random Forest (Tariq et al. Citation2022; Lebourgeois et al. Citation2017). Furthermore, the classification accuracy achieved in this study is in line with other studies which have shown that using the machine-learning random forest classifier results in higher classification accuracy (Juel et al. Citation2015; Lebourgeois et al. Citation2017; Phiri et al. Citation2019a). Apart from achieving high accuracy, this study demonstrates the effective of cloud computing in producing accurate information for large area land cover monitoring, and crop production (Tariq et al. Citation2022; Zamani et al. Citation2022).
Like other studies (Sharifi et al. Citation2022; Kamwi et al. Citation2018), this study showed that different land cover changes occurred between 2000 and 2018, with forest and cropland showing significant dynamics. Previous studies have also shown a general decline in areas covered by vegetation, while land covers such as settlements, bare land have shown signs of expansion (Mayes et al. Citation2015; Tariq et al. Citation2022; Hussain et al. Citation2022b). Land cover types such as cropland and settlements increased in spatial extent, while forest area decreased. Settlement increased by about 40%, while cropland increased by 25%. Although forests declined by about 9%, the area change was higher than the combined change for the other land covers. It is worth noting that wetlands and grasslands experienced less than 1% changes. The land cover dynamics across the country are mainly characterised by the changes in three land cover classes: forest, cropland and settlement. These findings are in line with Hu et al. (Citation2021) who indicated that forests and cropland are the major players because they have the largest magnitude of change in terms of area. Therefore, it can be said that forest losses and agricultural expansion mainly characterised land cover changes between 2000 and 2018. Mayes et al. (Citation2015) and Syampungani et al. (Citation2009) also reported that forest losses were mainly driven by agricultural expansion in the miombo woodlands of Southern Africa.
Although protected areas such as forest reserves have been the epitome of biodiversity in most countries (Ernst et al. Citation2013; Jucker et al. Citation2017), forest reserves in Zambia are experiencing excessive anthropogenic impacts (Kalaba et al. Citation2013; Handavu et al. Citation2019). This is evident from the findings of this study which indicate that forest reserves across Zambia have been highly encroached. More than 50% of the forest reserves have experienced some form of human disturbance, while 10% of these reserves are heavily (>90%) depleted. Agricultural areas have expanded by about 20% into forest reserves. Syampungani (Citation2008) indicated that most of the forest reserves in the central part of the country are depleted and this can be attributed to the low rainfall pattern in the country’s southern region, which limits the forest’s recovery after a disturbance. Phiri et al. (Citation2019a) and Vinya (Citation2012) found similar results and indicated that most of the intact forest reserves in Agroecological Regional III were among the most preserved forests because of the higher rainfall pattern.
With the observed increasing trend in population over the past years (ZamStats, 2022), the Zambian agricultural sector will require sustained growth in food production if food security is to be sustained. In this regard, agricultural production will largely depend on yield improvement, through intensification, and agricultural land expansion (Felegari et al. Citation2021). However, over the years, forest reserves have been a target to meet the demand for more agricultural land (Lindsey et al. Citation2014; McNicol et al. Citation2018). Forest reserves also face other competing needs such as being a source of wood fuel on which over 80 percent of the rural Zambians depend on their domestic energy supply. The outlook to 2050 suggests an increased demand for agricultural land that will be driven by high food demand for the projected two-fold increase in the population of Zambia (Pimentel and Pimentel Citation2006). Consequently, these demands will lead to overexploitation and the eventual depletion of forest reserves, should there be reluctance in the renewed aspirations to conserve them as carbon sinks (Lindsey et al. Citation2014).
Other reasons for agricultural expansion into forest reserves are related to economic benefits realised from the crops and other forest management activities. Where the market price is more favourable for certain crops, the farmers are expected to expand their production, thereby increasing the demand for land. Most of the agricultural practices do not promote soil conservation and enhancement of soil fertility (Kalaba et al. Citation2013). This implies that farmers tend to practice shifting cultivation by looking for land with fertile soils even in forest reserves. The agricultural expansion into forest reserves is also driven by the weak enforcement of different legislation such as the Forest Act (Vinya Citation2012; Lindsey et al. Citation2014). This is clear from the limited operation by the Forestry Department which cites challenges such as lack of funding and manpower to execute their duties. The expansion of agricultural areas into forest reserves is also indirectly driven by the increasing impacts of climate change such as droughts, new disease outbreak, and general crop failure among smallholder farmers. Moreover, Tariq et al. (Citation2022) and Hussan et al. (2022) cited climate change as one of the driving factors of reduced production in Pakistani. Thus, farmers are always moving from one point to another in search of new suitable land for crop production and similar cases were observed in Tanzania (Mayes et al. Citation2015; Molinario et al. Citation2015).
This study makes two major contributions towards the management and scientific body of knowledge on the management of forest reserves in developing countries such as Zambia. Firstly, it highlights the need to carefully consider the trade-off in agricultural expansion and management of forest reserves. According to Tariq et al. (Citation2022) mapping and monitoring the distribution of croplands and together with vegetation types support policymakers and international organizations by reducing the risks to food insecurity, notably from climate change and, for that purpose of enhancing food conservation. Although there are several drivers of encroachment into forest reserves, it is clear through this study that agricultural expansion is ranked high in Zambia. Thus, there is a need for a shift in scientific research towards finding solutions for increasing crop production, while promoting the conservation of these forest reserves. Therefore, developing policies which consider both agricultural expansion and conservation of forest reserves is inevitable. Secondly, most of the studies on the land cover change in Zambia have focused on charcoal production as one of the leading vices for deforestation; this study opens new avenues for researchers to focus on improved agricultural practices such as smart agriculture and agroforestry which enhance conservation of forest reserves.
The findings from this study need to be interpreted by considering the limitations of the current research. Firstly, although land cover maps were produced with high accuracies (>80%), there is still a chance for error. Thus, the figures for land cover dynamics might differ had it been that absolute accuracies (100%) were achieved on all the land cover maps. It is well known that during change analysis by post-classification comparison, the errors in each individual classification will be propagated into the results of change analysis. This creates uncertainty on the results of change analysis. Secondly, land cover maps were mapped in five steps with a spacing of 5 years; thus, other changes which occur at short time intervals might have not been observed. For example, land cover opening which might have happened in the first year of the five years might have recovered by the next classification stage. Thus, reducing the classification interval to annual classification can bring out other details that have not been reported in this study (Phiri et al. Citation2019a). Finally, the socio-economic assessment would have been more detailed if it was done in more than two sites. Thus, studies with country-level representative samples are needed to understand the drivers of agricultural expansion into forest reserves.
5. Conclusions
This study aimed to understand the extent of agricultural expansion into forest reserves and explore the drivers of this expansion between 2000 and 2015. The findings of this study indicate a general decline of 10% in forest area and an increase of 25% in cropland. Almost 50% of the forest reserves in Zambia are experiencing some form of encroachment, and 10% of these are heavily encroached (>90% forest loss). During the survey, communities indicated that agricultural expansion into forest reserves is driven by the ever-increasing demand for land due to population increase.
The findings from this study clearly indicate the need for enhanced efforts in the management of forest reserves by considering the trade-offs brought about by agricultural expansion. This study provides new insights in the management of forest reserves especially with the current expansion in agricultural areas. Thus, policies both in agriculture and forest management need to take into consideration the trade-off between forest reserves and agricultural expansion. Policies that promote sustainable agriculture, agroforestry and climate adaptability need to be the focus for the agricultural sector. As an avenue for future studies, we recommend a long-term study of agricultural expansion in forest reserves covering more than four decades and expanding the socio-economic analysis to more sites across the country.
Authors contribution statement
JM conceived the presented idea and secured funding. PN, KJ, DP and JMK performed the analysis. FC and PH verified the results through field work. SK and JK participated in drafting and editing the manuscript. All authors discussed the results and contributed to the final manuscript.
Supplemental Material
Download MS Word (652.4 KB)Disclosure statement
No potential conflict of interest was reported by the authors.
Data availability statement
Data available on request from the authors.
Additional information
Funding
References
- Chauvin ND, Mulangu F, Porto G. 2012. Food production and consumption trends in Sub-Saharan Africa: prospects for the transformation of the agricultural sector. New York, NY: UNDP Regional Bureau for Africa, Vol 2; p. 74.
- Chomba B, Tembo O, Mutandi K, Makano A. 2012. Drivers of deforestation, identification of threatened forests and forest cobenefits other than carbon from REDD + implementation in Zambia. A consultancy report prepared for the Forestry Department and the Food and Agriculture Organization of the United Nations under the national UN-REDD Programme. Ministry of Lands, Natural Resources and Environmental Protection. Lusaka, Zambia.
- DeFries RS, Rudel T, Uriarte M, Hansen M. 2010. Deforestation driven by urban population growth and agricultural trade in the twenty-first century. Nature Geosci. 3(3):178–181. http://www.nature.com/ngeo/journal/v3/n3/suppinfo/ngeo756_S1.html.
- Du S, Wang Q, Guo L. 2014. Spatially varying relationships between land-cover change and driving factors at multiple sampling scales. J Environ Manage. 137:101–110.
- Duro DC, Franklin SE, Dubé MG. 2012. A comparison of pixel-based and object-based image analysis with selected machine learning algorithms for the classification of agricultural landscapes using SPOT-5 HRG imagery. Remote Sens Environ. 118:259–272.
- Ernst C, Philippe M, Astrid V, Catherine B, Musampa C, Pierre D. 2013. National forest cover change in Congo Basin: deforestation, reforestation, degradation and regeneration for the years 1990, 2000 and 2005. Glob Chang Biol. 19(4):1173–1187.
- Ezeh AC, Bongaarts J, Mberu B. 2012. Global population trends and policy options. Lancet. 380(9837):142–148.
- FAOSTAT. 2021. [accessed 2022 June 21]. http://www.fao.org/faostat/en/.
- Feddema JJ, Oleson KW, Bonan GB, Mearns LO, Buja LE, Meehl GA, Washington WM. 2005. The importance of land-cover change in simulating future climates. Science. 310(5754):1674–1678.
- Felegari S, Sharifi A, Moravej K, Amin M, Golchin A, Muzirafuti A, Tariq A, Zhao N. 2021. Integration of Sentinel 1 and Sentinel 2 satellite images for crop mapping. Appl Sci. 11(21):10104.
- Foley J, Ramankutty N, Brauman K. 2011. Solutions for a cultivated planet. Nature 478:337–342.
- Ghorbanian A, Kakooei M, Amani M, Mahdavi S, Mohammadzadeh A, Hasanlou M. 2020. Improved land cover map of Iran using Sentinel imagery within Google Earth Engine and a novel automatic workflow for land cover classification using migrated training samples. ISPRS J Photogramm Remote Sens. 167:276–288.
- Handavu F, Chirwa PWC, Syampungani S. 2019. Socio-economic factors influencing land-use and land-cover changes in the miombo woodlands of the Copperbelt province in Zambia. Forest Policy and Econ. 100:75–94.
- Hu P, Sharifi A, Tahir MN, Tariq A, Zhang L, Mumtaz F, Shah SH. 2021. Evaluation of vegetation indices and phenological metrics using time-series MODIS data for monitoring vegetation change in Punjab, Pakistan. Water. 13(18):2550.
- Hussain S, Lu L, Mubeen M, Nasim W, Karuppannan S, Fahad S, Tariq A, Mousa BG, Mumtaz F, Aslam M. 2022a. Spatiotemporal variation in land use land cover in the response to local climate change using multispectral remote sensing data. Land. 11(5):595.
- Hussain S, Qin S, Nasim W, Bukhari MA, Mubeen M, Faha S, Raza A, Abdo HG, Tariq A, Mousa BG, et al. 2022b. Monitoring the dynamic changes in vegetation cover using spatio-temporal remote sensing data from 1984 to 2020. Atmosphere. 13(10):1609.
- Jayne TS, Mather D, Mghenyi E. 2010. Principal challenges confronting smallholder agriculture in sub-Saharan Africa. World Development. 38(10):1384–1398.
- Jucker T, Caspersen J, Chave J, Antin C, Barbier N, Bongers F, Dalponte M, van Ewijk KY, Forrester DI, Haeni M, et al. 2017. Allometric equations for integrating remote sensing imagery into forest monitoring programmes. Glob Chang Biol. 23(1):177–190.
- Juel A, Groom GB, Svenning JC, Ejrnæs R. 2015. Spatial application of Random Forest models for fine-scale coastal vegetation classification using object based analysis of aerial orthophoto and DEM data. Int J Appl Earth Obs Geoinf. 42:106–114.
- Kalaba FK, Quinn CH, Dougill AJ, Vinya R. 2013. Floristic composition, species diversity and carbon storage in charcoal and agriculture fallows and management implications in Miombo woodlands of Zambia. For Ecol Manage. 304:99–109.
- Kamwi J, Cho M, Kaetsch C, Manda S, Graz F, Chirwa PWC. 2018. Assessing the spatial drivers of land use and land cover change in the protected and communal areas of the Zambezi Region, Namibia. Land. 7(4):131.
- Kindu M, Schneider T, Teketay D, Knoke T. 2015. Drivers of land use/land cover changes in Munessa-Shashemene landscape of the south-central highlands of Ethiopia. Environ Monit Assess. 187(7):452.
- Kotsiantis SB, Zaharakis ID, Pintelas PE. 2006. Machine learning: a review of classification and combining techniques. Artif Intell Rev. 26(3):159–190.
- Lambin EF, Turner BL, Geist HJ, Agbola SB, Angelsen A, Bruce JW, Coomes OT, Dirzo R, Fischer G, Folke C, et al. 2001. The causes of land-use and land-cover change: moving beyond the myths. Global Environ Change. 11(4):261–269.
- Lebourgeois V, Dupuy S, Vintrou É, Ameline M, Butler S, Bégué A. 2017. A combined random forest and OBIA classification scheme for mapping smallholder agriculture at different nomenclature levels using multisource data (simulated Sentinel-2 time series, VHRS and DEM). Remote Sens. 9(3):259.
- Li X, Wang Y, Li J, Lei B. 2016. Physical and socio-economic driving forces of land-use and land-cover changes: a case study of Wuhan City, China. Discrete Dyn Nat Soc. 2016:1–11.
- Lindsey PA, Nyirenda VR, Barnes JI, Becker MS, McRobb R, Tambling CJ, Taylor WA, Watson FG, t‘Sas-Rolfes M. 2014. Underperformance of African protected area networks and the case for new conservation models: insights from Zambia. PLoS One. 9(5):e94109.
- Maples S. 2021. Google Earth Engine 101: an introduction for complete beginners. California, USA: Stanford Geospatial Center.
- Mayes MT, Mustard JF, Melillo JM. 2015. Forest cover change in Miombo Woodlands: modeling land cover of African dry tropical forests with linear spectral mixture analysis. Remote Sens Environ. 165:203–215.
- McIver DK, Friedl MA. 2001. Estimating pixel-scale land cover classification confidence using nonparametric machine learning methods. IEEE Trans Geosci Remote Sensing. 39(9):1959–1968.
- McNicol IM, Ryan CM, Mitchard ETA. 2018. Carbon losses from deforestation and widespread degradation offset by extensive growth in African woodlands. Nat Commun. 9(1):3045.
- Misaki E, Apiola M, Gaiani S, Tedre M. 2018. Challenges facing sub‐Saharan small‐scale farmers in accessing farming information through mobile phones: a systematic literature review. E J Info Sys Dev Countries. 84(4):e12034.
- Molinario G, Hansen MC, Potapov PV. 2015. Forest cover dynamics of shifting cultivation in the Democratic Republic of Congo: a remote sensing-based assessment for 2000-2010. Environ Res Lett. 10(9):094009.
- Mukul SA, Herbohn J. 2016. The impacts of shifting cultivation on secondary forests dynamics in tropics: a synthesis of the key findings and spatio temporal distribution of research. Environ Sci Policy. 55:167–177.
- Mutanga O, Kumar L. 2019. Google earth engine applications. Remote Sens. 11(5):591.
- Phan TN, Kuch V, Lehnert LW. 2020. Land cover classification using Google Earth Engine and random forest classifier—The role of image composition. Remote Sens. 12(15):2411.
- Phiri D, Chanda C, Nyirenda VR, Lwali CA. 2022. An assessment of forest loss and its drivers in protected areas on the Copperbelt province of Zambia: 1972–2016. Geomatics Nat Hazards Risk. 13(1):148–166.
- Phiri D, Morgenroth J. 2017. Developments in Landsat land cover classification methods: a review. Remote Sens. 9(9):967.
- Phiri D, Morgenroth J, Xu C. 2019a. Four decades of land cover and forest connectivity study in Zambia—An object-based image analysis approach. Int J Appl Earth Obs Geoinf. 79:97–109.
- Phiri D, Morgenroth J, Xu C. 2019b. Long-term land cover change in Zambia: an assessment of driving factors. Sci Total Environ. 697:134206.
- Phiri D, Simwanda M, Salekin S, Nyirenda VR, Murayama Y, Ranagalage M. 2020. Sentinel-2 data for land cover/use mapping: a review. Remote Sens. 12(14):2291.
- Pimentel D, Pimentel M. 2006. Global environmental resources versus world population growth. Ecol Econ. 59(2):195–198.
- Quintero-Gallego ME, Quintero-Angel M, Vila-Ortega JJ. 2018. Exploring land use/land cover change and drivers in Andean mountains in Colombia: a case in rural Quindío. Sci Total Environ. 634:1288–1299.
- Ramankutty N, Foley JA, Olejniczak NJ. 2002. People on the land: changes in global population and croplands during the 20th century. AMBIO: J Human Environ. 31(3):251–257.
- Schneibel A, Stellmes M, Röder A, Finckh M, Revermann R, Frantz D, Hill J. 2016. Evaluating the trade-off between food and timber resulting from the conversion of Miombo forests to agricultural land in Angola using multi-temporal Landsat data. Sci Total Environ. 548–549:390–401.
- Searchinger TD, Estes L, Thornton PK, Beringer T, Notenbaert A, Rubenstein D, Heimlich R, Licker R, Herrero M. 2015. High carbon and biodiversity costs from converting Africa’s wet savannahs to cropland. Nature Clim Change. 5(5):481–486.https://www.nature.com/articles/nclimate2584#supplementary-information.
- Sharifi A, Mahdipour H, Moradi E, Tariq A. 2022. Agricultural field extraction with deep learning algorithm and satellite imagery. J Indian Soc Remote Sens. 50(2):417–423.
- Syampungani S, Chirwa PW, Akinnifesi FK, Sileshi G, Ajayi OC. 2009. The miombo woodlands at the cross roads: potential threats, sustainable livelihoods, policy gaps and challenges. Paper presented at The Natural Resources Forum. 33(2):150–159.
- Syampungani S. 2008. Vegetation change analysis and ecological recovery of the Copperbelt miombo woodland of Zambia [PhD thesis]. Stellembosch University.
- Tariq A, Siddiqui S, Sharifi A, Shah SHIA. 2022. Impact of spatio-temporal land surface temperature on cropping pattern and land use and land cover changes using satellite imagery, Hafizabad District, Punjab, Province of Pakistan. Arab J Geosci. 15(11):1045–2021.
- Tariq A, Yan J, Gagnon AS, Riaz KM, Mumtaz F. 2022. Mapping of cropland, cropping patterns and crop types by combining optical remote sensing images with decision tree classifier and random forest. Geo-Spatial Information Sci. 13(2):1–19.
- Turner W, Rondinini C, Pettorelli N, Mora B, Leidner AK, Szantoi Z, Buchanan G, Dech S, Dwyer J, Herold M, et al. 2015. Free and open-access satellite data are key to biodiversity conservation. Biol Conserv. 182:173–176.
- Vinya R. 2012. Preliminary study on the drivers of deforestation and potential for REDD + in Zambia. A consultancy report prepared for Forestry Department and FAO under the national UN-REDD + Programme Ministry of Lands & Natural Resources. Lusaka Zambia.
- Woodcock CE, Allen R, Anderson M, Belward A, Bindschadler R, Cohen W, Gao F, Goward SN, Helder D, Helmer E, et al. 2008. Free access to landsat imagery. Science. 320(5879):1011–1011.
- Zamani A, Sharifi A, Felegari S, Tariq A, Zhao N. 2022. Agro-climatic zoning of saffron culture in Miyaneh City by using WLC method and remote sensing data. Agriculture. 12(1):118.
- ZamStats. 2010. Zambia 2010 Census of population and housing. GRZ, Lusaka, Zambia. Retrieved from Lusaka, Zambia.
- Zulu D, Ellis RH, Culham A. 2019. Collection, consumption, and sale of Lusala (Dioscorea hirtiflora)—a Wild Yam—by rural households in Southern Province, Zambia. Econ Bot. 73(1):47–63.