
 ?Mathematical formulae have been encoded as MathML and are displayed in this HTML version using MathJax in order to improve their display. Uncheck the box to turn MathJax off. This feature requires Javascript. Click on a formula to zoom.
Abstract
Aiming to provide a scientific basis for the prevention and control of soil erosion in the Huaihe region, this study uses the InVEST-SDR model to estimate the temporal and spatial changes of soil erosion and soil conservation in the Huaihe region in 2010, 2015 and 2020, and the driving factors are evaluated and quantified using Random Forest and Geodetector, respectively. The major findings are as follows: (1) From 2010 to 2020, soil loss and soil retention in the Huaihe region gradually intensified, while the spatial distribution trend was consistent from year to year. (2) The results from Random Forest and Geodetector show that changes in soil loss and soil retention are mainly influenced by slope and rainfall. (3) The steepness and length of slopes are the most influencing factors for soil erosion. Soil loss and soil retention vary widely between different land uses. Forests play an important role in soil conservation.
1. Introduction
Soil is one of the essential resources on earth. Soil provides important regulatory ecosystem services with major implications for human well-being and environmental protection; it helps protect the ecological environment and plays an important role in sustaining human survival (Pereira et al. Citation2018). However, soil erosion, in particular, jeopardizes the maintenance and existence of these services (Marques et al. Citation2021). Soil erosion not only leads to land degradation and decline in soil fertility, but also causes a series of ecological and environmental problems such as eutrophication of water bodies and increased drought and flood disasters. Therefore, it is crucial to analyze the spatial distribution characteristics of soil erosion and its influencing factors.
Soil loss has been the focus of human attention since ancient times (Dotterweich Citation2013). Direct field measurements of soil erosion can provide accurate runoff and net soil erosion, but are time-consuming and costly to estimate large-scale soil erosion (Girmay et al. Citation2020). Therefore, a number of soil erosion models have been proposed in recent years, among which the Universal Soil Loss Equation (USLE) (Wischmeier and Smith Citation1978) and the Revised Universal Soil Loss Equation (RUSLE) (Renard Citation1997) are the most widely used. Many scholars have studied and refined the calculation methods of each factor of the (R)USLE model (D. K. McCool et al. Citation1989; Renard and Freimund Citation1994; Yu and Rosewell Citation1996), making the (R)USLE model applicable worldwide and validated in most regions. Although the USLE model takes into account factors such as rainfall, topography, soil erodibility, soil conservation measures and vegetation cover, it does not consider the ability of the land mass itself to intercept upstream sediments. The USLE model can only estimate gross soil erosion per unit area per unit time and cannot directly calculate sediment export yield. (R)USLE models also have difficulty in predicting export sediment from a given watershed (de Vente et al. Citation2013). However, as observation data accuracy improves and computer technology continues to advance, research on models that simulate the soil erosion process has been promoted. Some of these physical models can simulate the process of erosion and sedimentation, such as the Water Erosion Prediction Project (WEPP) of the United States Department of Agriculture (Laflen et al. Citation1991), and the LISEM (Takken et al. Citation1999), among others. However, the parameters used in the physics-based models are difficult to obtain and calibrate, whereas the (R)USLE models are simple, easy to obtain data, widely documented and applicable to most areas (Merritt et al. Citation2003). Hence, the different forms of the model belonging to the (R)USLE family are still the most widely used soil erosion models worldwide (Alewell et al. Citation2019; Borrelli et al. Citation2021).
The (R)USLE model has gained new developments in recent years. The concept of sediment delivery ratio (SDR), the ratio of the amount of sediment transported at a certain section of the watershed to the total erosion of the watershed, has been introduced with the concept of runoff and sediment transport, making it possible to use (R)USLE to estimate sediment export and sediment retention (Jain and Das Citation2010; Thomas et al. Citation2018a). Some example models are (R)USLE-SDR (Kaffas et al. Citation2021), WaTEM/SEDEM (Winterová et al. Citation2022) and SEDD (Mirakhorlo and Rahimzadegan Citation2020). Different methods for estimating SDR have been studied by many scholars. Marques et al. (Citation2019) used the USLE-SDR model to calculate the total soil erosion and sediment yield in the west-central Brazilian catchment, while Thomas et al. (Citation2018b) estimated the gross soil erosion and net erosion of a rain shadow river basin in the southern Western Ghats based on RUSLE-TLSD.
The sediment delivery ratio (SDR) of the InVEST (Integrated Valuation of Ecosystem Services and Tradeoffs) model integrates the USLE equation and the studies of Borselli et al. (Citation2008) and Vigiak et al. (Citation2012) to obtain the spatial distribution of sand production in the watershed by calculating the ratio of soil erosion and sediment transport (Hamel et al. Citation2015). Many scholars have used the InVEST-SDR model to estimate soil erosion and sediment transport at different geographical scales with good results (Aneseyee et al. Citation2020; Gashaw et al. Citation2021).
Previously, logistic regression (Conoscenti et al. Citation2014), analytic hierarchy process (Rahman et al. Citation2009), weighted overlay (Magliulo Citation2012), decision tree (Ghosh and Maiti Citation2021), and random forest (Paul et al. Citation2021) were commonly used in the study of soil erosion driving factors. Traditional statistical methods are difficult to analyze multidimensional ecological data with complex relationships between nonlinear variables (De’ath and Fabricius Citation2000). Random forest is a compositional supervised learning algorithm (Breiman Citation2001), which can effectively compensate the deficiencies of traditional analysis methods and can also predict the occurrence of soil erosion based on the constructed model. Geodetectors are good at assessing the influence of multiple factors for a specific phenomenon, not only detecting the explanatory power of spatial variability of a single factor, but also detecting interactions between different factors (Wang and Xu Citation2017), which is useful for heterogeneous spatial data. For example, Han Jing et al. used geodetectors to detect factors influencing the layout of a key town (Han et al. Citation2020), and Matomela et al. (Citation2022) assessed the importance of factors affecting soil erosion in Dongsheng City, Inner Mongolia, China. Geodetectors are built upon statistical relationships and discrete data are required, so the method of data discretization and classification affects the accuracy of geodetectors (Cao et al. Citation2013). For random forests, the amount of data and the setting of parameters will affect the accuracy of the model, and both have their own advantages and disadvantages.
Soil erosion and sediment export are essential for identifying soil erosion hotspots to inform specific watershed conservation efforts and planning (Aneseyee et al. Citation2020; Ganasri and Ramesh Citation2016). Soil conservation is one of the important regulating service functions of ecosystems, and plays an important role in mitigating regional soil erosion, accumulating sediment, and maintaining ecological security (Costanza et al. Citation1997). The Huaihe region is an important grain production base in China, and soil erosion in agricultural areas results in reduced soil fertility and quality (Helmi Citation2022). Soil loss caused by erosion poses a threat to the sustainability of grain production in the region, and the large amount of exported sediment from the numerous tributary lake systems in the area increases the cost of domestic water treatment. Thus, it is crucial to assess soil loss and identify hotspot areas in the Huaihe region. Although similar watershed studies have been conducted across provinces, most have been at small and medium scales, and severe soil erosion in the densely-populated Huaihe region, affected by human activities and deforestation, has been poorly studied. This paper aims to identify hotspots of soil erosion, explore the primary factors affecting soil erosion and soil conservation capacity, apply the SDR module of the InVEST model to assess soil erosion in the Huaihe region in 2010, 2015 and 2020, evaluate the significance of its drivers using random forest and geodetector, respectively, and provide scientific recommendations for erosion control, soil conservation, and ecosystem security management in the Huaihe region.
2. Study area and data sources
2.1. Study area
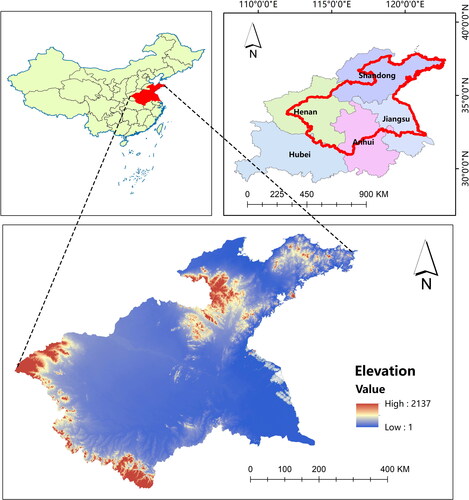
The Huaihe region, including the Huaihe River Basin and the Shandong Peninsula, a large agricultural region, is located in the hinterland of central and eastern China (), spanning five provinces of Anhui, Jiangsu, Henan, Shandong, and Hubei, and bordering the Tongbai Mountains and the Funiu Mountains in the west and the Yellow Sea in the east (Wei et al. Citation2022). The Huaihe region is an important commodity grain production base in China, known for its superior conditions for agricultural development. It holds a crucial role in the overall economic and social development of China. Located at latitude 30°57′∼37°49′N and longitude 111°56′∼122°42′E, the Huaihe region has a complex, diverse and layered landscape. The northeastern part of the region is the mountainous area in central and southern Shandong, rugged terrain borders the basin on the south and west, and the central part of the region is alluvial, consisting of floodplains, lakes, and marine plains between the Yellow and Huai Rivers. Between hills and plains, there are alluvial fans, alluvial plains and flood plains, and the landforms are divided into four types: mountains, hills, terraces and depressions. The Huaihe region is located at the junction of the second and third terrains in China, and the overall topography is high in the west and low in the east. The terrain to the north of the Huaihe River slopes from northwest to southeast, while the Huainan Mountains and the Yishu, Shushi and Si Mountains slope to the north and south respectively, with an elevation of 1 to 2,137 meters. The Huaihe region is located in the north-south climate transition zone of China. The north of the Huaihe River is a warm temperate semi-humid region, and the south of the Huaihe River is a subtropical humid region. The temperature increases from north to south, from the coast to the inland, and the rainfall also increases from north to south.
Figure 1. Panorama of the Huaihe region, where elevations are in meters. China map vector boundary from the Ministry of Natural Resources: GS(2020)4619, no modification from the base map boundary.
2.2. Data sources
The rainfall data in 2010, 2015, and 2020 came from NOAA (https://gis.ncdc.noaa.gov) and rainfall raster maps of total of 30 stations in the study area were obtained using Kriging interpolation. DEM data came from SRTM30 with regional cropping using GEE. 30-meter annual maximum NDVI data from 2000 to 2020 were obtained from the National Ecosystem Science Data Center belonging to the National Science & Technology Infrastructure of China (http://www.nesdc.org.cn/) (Dong et al. Citation2021). The Huaihe region’s vector boundaries and tertiary watershed vector boundaries came from the Geographic remote sensing ecological network platform (http://www.gisrs.cn/). Finally soil data came from the National Cryosphere Desert Data Center (http://www.ncdc.ac.cn) based on the Harmonized World Soil Database (HWSD) (Lu and Chao Citation2019), and land use/land cover (LULC) data from a dataset produced by Jie Yang and Xin Huang of Wuhan University (Yang and Huang Citation2021). Data sources are summarized in .
Table 1. Data sources.
3. Research method
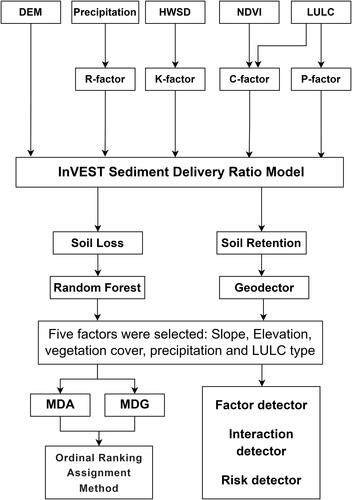
In this study, the InVEST-SDR model was used to estimate soil erosion and soil retention in the Huaihe region in 2010, 2015 and 2020, and the driving factors were evaluated and quantified using random forest and geographic probes, respectively. The technical flowchart of this study is shown in .
Figure 2. Technical flow chart.
3.1. Universal Soil Loss Equation
where USLE is soil erosion modulus [t/ha/yr], LS is topographic factor, P is erosion control practice factor, R is rainfall erosivity factor [(MJ·mm)/(ha·h·a)], K is soil erodibility factor [(t·ha·h)/(MJ·ha·mm)], and C is vegetation cover factor. In this study, the intensity of gross soil erosion based on the criterion for soil erosion classification specified by the Ministry of Water Resources of China (SL190-2007), is divided into six classes: slight erosion [<5 t/ha/yr], light erosion [5–25 t/ha/yr], moderate erosion [25–50 t/ha/yr], strong erosion [50–80 t/ha/yr], very strong erosion [80–150 t/ha/yr], and severe erosion [>150 t/ha/yr].
3.2. Rainfall erosivity factor (R)
The R-factor represents the potential soil erosion capacity caused by rainfall, and is a dynamic indicator to evaluate the condition of soil erosion. The formula proposed by Wischmeier and Smith (Citation1978) is often used to calculate the R-factor. In this paper, the annual rainfall data from the 30 meteorological stations in the Huaihe region are Kriged interpolated and the rainfall algorithm proposed by Zhang and Fu (Citation2003) is used to estimate the rainfall erosion factor as follows,
(2)
(2)
where Ra is the precipitation erosion force in year a, Pa is the precipitation in year a, α is 0.0534, β is 1.6548, and the unit of R is [(MJ·mm)/(ha·h·a)].
3.3. Soil erodibility factor (K)
The soil erodibility factor responds to the soil sensitivity to denudation and transport, and is influenced by soil physical and chemical properties such as soil texture and soil organic matter content. In this study, the EPIC equation proposed by Williams et al. (Citation1983) is used as follows and the results are multiplied by 0.1317 to convert to the international units.
(3)
(3)
(4)
(4)
where K is the soil erodibility factor [t·ha·h/(MJ·mm·ha)], Sd, Si, Cl, and C are the percentages of sand, powder, clay and organic carbon content in the soil, respectively.
3.4. Vegetation cover factor (C)
The vegetation cover factor is an important factor reflecting the ability of plants to inhibit sediment transport and soil erosion. The C-factor of LULC is calculated from the annual maximum NDVI, a standardized index used to generate images showing the amount of vegetation, as follows,
(5)
(5)
where α = 2 and β = 1.
3.5. Erosion support practice factor (P)
p, ranging from 0 to 1, is the ratio of the amout of soil erosion under soil and water conservation measures to the amount of soil erosion when planting on the downhill. The higher the value, the worse the soil and water conservation measures. p = 0 means no erosion occurs under soil and water conservation measures, and p = 1 means no soil and water conservation measures have been taken. The p values in this study are assigned 0.5 for cropland, 0.9 for forest, 0.9 for shrub, 0.9 for grassland, 0 for water, 0 for barren land, and 0 for impervious area for each LULC.
3.6. InVEST model
Based on the Universal Soil Erosion Equation (USLE), the sediment delivery ratio (SDR) in the InVEST model describes the spatial process of soil erosion and sediment migration in watersheds through image metrics (Sharp et al. Citation2014).
(6)
(6)
(7)
(7)
(8)
(8)
where SDRi is the sediment transport ratio in the presence of vegetation cover and soil conservation measures for any grid i; SDRmax is the maximum theoretical SDR value, which is set to 0.8 in this paper; IC0 (the ratio of sediment entering the valley to the amount of erosion on the slope) and kb (the degree of spatial connectivity of a given site to runoff) are calibration parameters for determining the shape of the relationship between spatial connectivity and sediment transport ratio of hydrological processes in a small watershed. The ICi indicates the probability that a unit of sediment on grid i in the watershed reaches the river. kb is set to 2 and IC0 is set to 0.5 in this paper. SEi is the sediment export from grid i. SEDRENi is the soil retention of raster i, which does not take into account upwelling sedimentation and the amount of sediment exported, that is, it is the amount of soil erosion avoided by the current soil and water conservation measures relative to the barren land, and the difference is used as an estimate of soil retention.
3.7. LULC transfer matrix
The LULC transfer matrix can comprehensively characterize the structural features and change directions of various land use types over a period of time. Its response to the metastable system state change process guided by human activities within a certain time interval can better reveal the spatiotemporal evolution of land use patterns. The commonly used vectors in the land transfer matrix can be the area of land use type or the probability of land use type transfer, and the former is used in this paper. The application of the land use transfer matrix will be mentioned in the section ‘LULC variation’ of this paper, and the mathematical expression is as follows
(9)
(9)
where n denotes the number of land use types, i and j represent the land use types before and after the transfer, respectively, and Sij denotes the area in km2 of land use types transferred from category i to category j during the study time period.
3.8. Random forest
The random forest algorithm (RF) is a compositional supervised learning algorithm proposed by Breiman (Citation2001), which generates a large number of decision trees by sampling sample units and variables, and then classifies the decision trees sequentially to evaluate the importance of indicators.Random forest is considered as a gray box or black box model, but compared with high-precision classifiers such as SVM (Support Vector Machine) and ANN (Artificial Neural Network), random forest can estimate the importance of variables, which can be subjectively used to identify important influencing factors and their explanations, and has important applications in classification. Given the advantages of random forest algorithm in dealing with complex ecological data, this paper decided to use random forest to assess the importance of soil erosion impact factors in the Huaihe region.
The importance of the variables is evaluated by two parameters, MDA (mean decrease accuracy) and MDG (mean decrease Gini), provided that the optimal solution is found for the parameters mtry and ntree. MDA is the increase in the error rate of the random forest result after disturbing the value of a certain factor. The higher the MDA value, the greater the error rate of the result, and the more important the factor that causes the phenomenon; MDG is the effect of each factor on the impurity of all decision tree nodes in the forest, and important factors reduce the impurity of all nodes. MDA and MDG have their own advantages and disadvantages in the correctness of the importance analysis and anti-interference ability, so this paper chooses Han’s method to add the values of MDA and MDG. The importance of the driving factors is assessed by assigning MDA and MDG to each of the K variables in the order of K, K-1 ……2, 1, summing the two assignments, and then re-ranking the factors to determine their relative importance.
3.9. Geodetector
The geodetector is a set of statistical methods proposed by Wang et al. (Citation2010) that can detect spatial heterogeneity and identify key driving factors of variation. The model exploits spatial heterogeneity to detect the consistency of the spatial distribution patterns between the dependent and independent variable and thereby measure the extent to which the independent variable explains the dependent variable. In addition, the method can also detect the interaction between any two factors.
The geodetector consists of four modules: factor detector, ecological detector, risk detector, and interaction detector (Song et al. Citation2020). The factor detector is mainly applied to detect the strength of the independent variable to explain the spatial divergence of the dependent variable. The strength of the independent variable can be calculated using the q value and the relevant equations are as follows. Theinteraction detector is used to detect the interaction between different soil retention impact factors, i.e. calculate and compare the individual q value of any two impact factors and the q value of their interactionto assess whether these factors jointly enhance or weaken the explanatory power of the dependent variable. The risk detector calculates the mean value of the explanatory variables in each layer of explanatory variables, and the larger the mean value, the stronger the association between the layer and the soil retention.
This paper uses the factor detector to identify the main environmental factors affecting the spatial transition of soil retention in watersheds, then uses the interaction detector and risk detector to detect the interactions of different soil retention factors and the association intervals of soil retention.
(10)
(10)
(11)
(11)
(12)
(12)
where L is the stratification of variable Y or factor X; h denotes the ith layer, i = 1,2,…,L; Nh and N are the number of cells in layer h and the whole area, respectively; σh2 and σ2 are the variance of Y values in layer h and the whole area, respectively. SSW and SST are the sum of variance within a layer and the total variance of the whole area, respectively. q is the explanatory power of the influencing factor on the spatial variation of soil erosion, q∈[0, 1], with larger q indicating stronger explanatory power of a factor.
4. Results and discussions
4.1. LULC variation
Cropland is the main land use type in the Huaihe region except for the northwest and southwest, accounting for more than 70% of the total area ( and ), followed by impervious area and forest. From 2010 to 2020, the Huaihe region was greatly affected by human activities. The area of cultivated land, shrubs, grassland and bare land gradually decreased from 2010 to 2020, among which the bare land decreased by 68.62%. The area of forest increased first and then leveled off. The area of impervious ground increased by 13.59% in the first five years and 7.47% in the next five years. All these change are related to the rapid development of cities in the basin from 2010 to 2020.
Figure 3. LULC chart for 2010–2020.
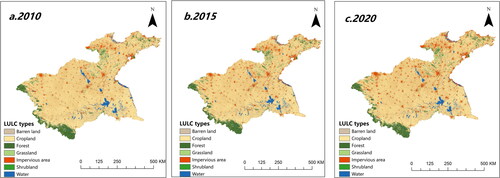
Table 2. Different land use types in the Huaihe region, 2010–2020.
is the LULC transfer matrix for the Huaihe region from 2010 to 2020, reflecting the internal conversion of land use types in the past 10 years. 13,765.63 km2 of cropland, acccounting for 4.15% of the total area, were converted to impervious area (9866.25 km2), forest area (2022.59 km2) and water area (1325.41 km2). 10796.63 km2 of impervious area, accounting for 3.25% of the total area, were converted mainly from cropland (9866.25 km2), water (610.77 km2) and barren land (198.04 km2). About 450 km2 of barren land were converted to impervious area, which is the most drastic change of land use type (). Converting cropland and grassland to forests reflects the effectiveness of ecological projects such as returning farmland to forests.
Figure 4. Change in LULC areas from 2010 to 2020 (unit km2).
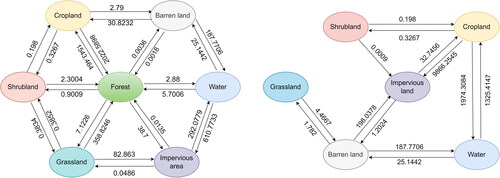
Table 3. LULC transfer matrix from 2010 to 2020 (unit km2).
4.2. Soil erosion variation
The total amount of soil erosion in the study area increased from 470,735,998 tons in 2010 to 498,748,291 tons in 2015, and reached 613,659,793 tons in 2020. However, the change in land use from 2010 to 2020 did not seem to be consistent with the change in soil erosion. The contradictory observations may be attributed to the increase in annual rainfall from 2010 to 2020. The spatial distribution of soil erosion from 2010 to 2020 was almost identical, and there was no large-scale change in vegetation, but the increase in rainfall exacerbated soil erosion. The results will be further discussed in the subsequent sections.
In this research, soil erosion is divided into six categories from slight erosion (0–5 t/ha/yr) to severe erosion (>150t/ha/yr), and the statistics of the six categories of erosion are shown in . It is noted that the area of slight erosion accounts for more than 80% of the total area in 2010, the area of light and moderate erosions increases from 13.95% in 2010 to 16.08% in 2020, and the area of soil erosion greater than 50t/ha/yr is very small, but accounts for 79.04–81.82% of the erosion (2010–2020). The areas with the most serious soil erosion are SW-13 and SW-5 ( and ), while the area with the least soil erosion is SW-9. Soil erosion is particularly severe in SW-13, with the erosion rate rising from 37.27% in 2010 to 40.09% in 2020, which may be related to topography and rainfall. The worst erosion is in the southern area of Liu’an City, Anhui Province. The southwest of Liu’an City is adjacent to the Dabie Mountains with abundant precipitation. The heavy rainfall in the south of Liu’an City in July 2020 led to severe flooding in many areas, resulting in large economic losses, which explained the sharp increase in soil erosion in Liu’an City in 2020.
Figure 5. Soil erosion from 2010–2020, where SW-13 is the most severely eroded area.
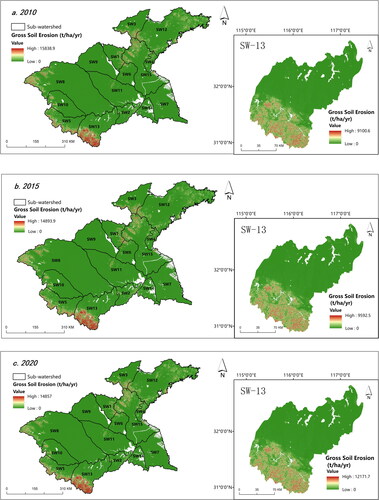
Table 4. Area ratio and total erosion ratio for different erosion categories.
Table 5. Where soil erosion and soil retention are in thousands of tonnes.
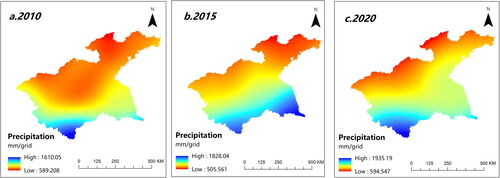
The annual rainfall in the Huaihe region has been increasing from 2010 to 2020 (), from 0.974 mm/m2 in 2010 to 1.127 mm/m2 in 2015 and 1.217 mm/m2 in 2020, which is consistent with the trend of total soil erosion. Severe soil erosion usually occurs in areas with high elevation, steep slope, heavy rainfall and low vegetation coverage. The total soil retention rate in SW-13 has increased from 53.29% in 2010 to 54.96% in 2020. Soil retention has been strengthened and relatively stable, which is related to the large area of forest cover in SW-13.
Figure 6. Annual rainfall in the Huaihe region, 2010–2020.
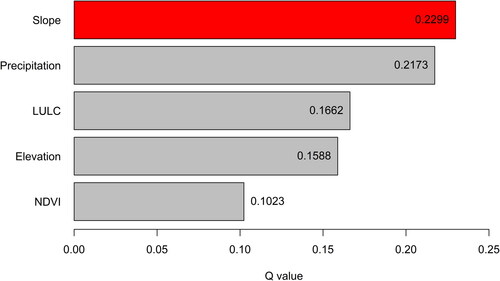
4.3. Random-forest-based assessment of soil driving factors
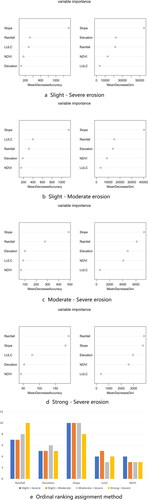
In this study, five important driving factors of soil erosion, namely slope, land use type, elevation, vegetation coverage (NDVI), and annual rainfall, are selected, and 2020 is taken as the study year for evaluation. The importance parameters MDA and MDG are obtained, and the order of importance of different factors is determined by the ranking assignment summation method. Four categories are introduced to represent different degrees of erosion caused by influencing factors.
The top three factors that have the greatest impact on slight-severe erosion and slight-moderate erosion are slope, rainfall and vegetation coverage, and slope is significantly more important than other factors. The impact of rainfall increases with soil erosion severity, and rainfall is more important than slope in strong-severe erosion, corresponding to an increase in erosion from 2010 to 2020 (). It can be seen that rainfall and topography factors are the most important factors affecting soil erosion in the Huaihe region, and the rainfall factor has a strong correlation with the severity of soil erosion.
Figure 7. (a) Slight – Severe erosion; (b) Slight – Moderate erosion; (c) Moderate – Severe erosion; (d) Strong – Severe erosion; (e) Ordinal ranking assignment method.
4.4. Soil erosion and slope
Slope is an important contributor to soil erosion, and areas with steep slopes are more prone to soil erosion. In this study, slope is divided into micro slope (0°–5°), gentle slope (5°–8°), moderate slope (8°–15°), steep slope (15°–25°), steeper slope (25°–35°), and steepest slope (>35°). 85.28% of the region is micro sloped, and the steepest slopes only account for 0.25% of the area. The soil erosion areas of different slope categories in the watershed from 2010 to 2020 are shown in .
Table 6. Areas with different degrees of soil erosion on different slopes.
8° can be regarded as the dividing line for whether soil erosion is prone to occur, and the probability of more severe soil erosion in areas above 8° increases significantly. Strong, very strong and severe erosion within the 5°–8° range accounted for only 14.4% of the area, while increased to 40.4% within the range of 8°–15°. In 2010, the largest severe soil erosion area was located within the slope range of 15°–25°, and the slight erosion area was concentrated within the slope range of 0°–5°. The likelihood of slight erosion decreases as the slope increases. Compared with other slope classes, steepest slopes are most prone to severe erosion, with more than half of the area being severely eroded, while the area of microslopes is at most 0.15% severely eroded. The more unstable the area, the greater the risk of soil erosion.
4.5. Soil loss, soil retention and sediment export in different LULC
From 2010 to 2020, the average soil loss of each land use type showed an upward trend (), The top four land use types with severe soil loss are shrubland, grassland, forest land and cropland. In 2020 the shrubland in the Huaihe region accounted for only 0.0009% of the area, and is constantly being transformed into cropland and forest.
Table 7. Where TSE is the total soil erosion, ASE is the average soil erosion, TSR is the total soil retention, ASR is the average soil retention, TES is the total exported sediment, AES is the average exported sediment. The units of TSE, TSR, TES are thousand tons, and the units of ASE, ASR, AES are t/ha/yr.
Sediment accumulation increases with soil loss. From 2010 to 2015, the average sediment yield of each land use type remained basically unchanged, but the total sediment export increased significantly from 44,721,987 tons in 2015 to 54,875,451 tons in 2020. Sediment export is approximately one tenth of soil erosion.
The cropland in the Huaihe region, covering more than 70% of the entire region, is widely distributed on low-altitude, gentle-slope plains. The average soil erosion modulus of cropland is low, but the erosion area and erosion volume are relatively large, which needs to be paid attention to.
There are significant differences in the average soil retention of different land use types in the Huaihe region. The average soil and water retention of forest land, shrubland and grassland is much higher than that of cropland, and the average soil and water retention of shrubland is the highest, followed by forest land and grassland. Cropland and barren land have similar soil retention. Affected by vegetation coverage, forest land has higher soil and water retention capacity. Compared with forests, cropland has smaller soil retention but larger area, so the potential risk of soil erosion is greater. Appropriate soil and water conservation measures should be taken to improve the soil retention of cropland.
4.6. Soil retention variation
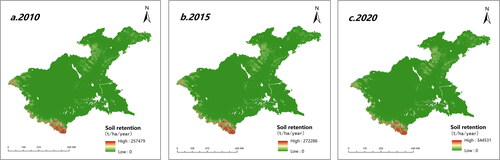
Soil retention in the Huaihe region continued to increase from 2010 to 2020. The total amount of soil retention increased slightly from 6,441,514,013 tons in 2010 to 6,756,093,500 tons in 2015, and then drastically increased by 27.77% to 8,632,401,857 tons in 2020. The soil retention intensity is consistently increasing from 2015 to 2020 (). The spatial distribution pattern of soil retention is stable, high in the southwest and northeast and low in the central region. The central region is dominated by arable land and impervious areas, with relatively low vegetation coverage, small terrain fluctuations, dense population, and intense human activities, which is not conducive to soil retention. On the other hand, areas with high terrain, high vegetation coverage, and less human activities have better soil conservation conditions, but may still suffer serious soil erosion caused by rainfall and topography, which means that areas like this can cause greater soil loss if soil conservation measures are not taken.
Figure 8. Soil retention in the Huaihe region, 2010–2020.
4.7. Analysis of factors influencing soil retention by Geodetectors
To further analyze the influence mechanism of soil conservation in the Huaihe region, this paper takes natural factors such as rainfall, slope, elevation, land use type, and vegetation coverage (NDVI) as the main independent variables, and soil conservation amount as the dependent variable to study the data of 2020. The main influencing factors of soil conservation function are measured and analyzed by geographic probes.
4.8. Factor detector
The factor detector can detect the spatial heterogeneity of the soil retention function and the extent to which each factor explains the spatial variability of soil retention capbility. The statistical value is expressed as the q value. The higher the q value, the stronger the explanatory power of the analyzed variable. After sorting the factors by the q values: slope > rainfall > land use type > elevation > vegetation coverage (), it is observed that slope has the strongest explanatory power for the spatial variability of soil conservation ability and is the most important factor to reveal the variability of soil conservation.
Figure 9. Results of factor detector (all passed the significance test).
4.9. Interaction detector
Interaction detector can identify whether the interaction between different factors increases or decreases the explanatory power of the analyzed variables. The interaction between any two factors has a greater impact on the spatial variation of soil conservation function than a single factor. It can be seen that the interaction between rainfall and slope is the strongest, with a contribution of 40.92%, while the contribution of elevation and land use type is the lowest, only 21.14%. The relatively high contributions of rainfall and slope when interacting with other factors reflect the importance of rainfall and slope ( and ).
Figure 10. Interaction detector.
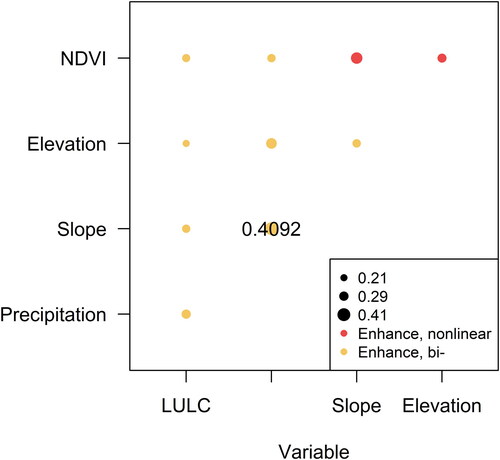
Table 8. Results of interaction detector.
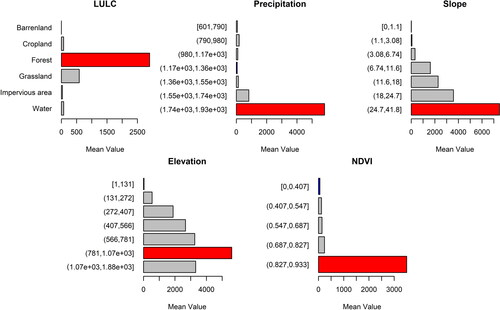
4.10. Risk detector
Risk detectors explain significant differences in factors affecting soil retention between sub-regions of different terrain (). Significant differences are detected at elevations between 781 to 1070 m and slopes of (24.7°∼41.8°). The southern part of the study area with heavy rainfall, mild climate and thick vegetation coverage has abundant soil retention. Matching with the risk detection results, it can be concluded that forest areas with medium to high altitudes, large terrain fluctuations, and thick vegetation coverage have greater soil retention. To prevent and control soil erosion, one is to protect the virgin forests in the southern part of the Dabie Mountains, and the other is to return farmland to forest and grassland, restore vegetation, and take appropriate soil and water conservation measures for cropland.
Figure 11. Results of risk detector.
5. Conclusion
Gross soil erosion in the Huaihe region in 2010, 2015 and 2020 are 470,735,998 tons, 498,748,291 tons and 613,659,793 tons respectively, showing intensified erosion, while the spatial distribution of erosion is basically the same. There is almost no soil loss in most areas, but soil loss is particularly serious in the southern part of the Huaihe region. Slope has the greatest impact on soil loss, and as slope increases, the probability of soil erosion increases. Precipitation also has a key influence on soil loss, and the sharp increase in soil loss in the southern region is closely related to the heavy rainfall in 2020.
The total amounts of soil retention in the Huaihe region in 2010, 2015 and 2020 are 6,441,514,013 tons, 6,756,093,500 tons and 8,632,401,857 tons, respectively. The spatial distribution pattern of soil retention is stable, high in the southwest and northeast and low in the central region. Moreover, soil retention and soil loss intensity vary by land use type. Shrubland and grassland are prone to soil loss. Forest land and shrubland have high soil retention, but shrubland is very small, so forest land has the greatest influence on soil retention.
Protecting existing forests and returning cropland to forests are the most important measures to enhance soil retention. Areas located at median to high latitudes with high vegetation coverage, humid climate, and less human activities have large soil conservation capacity. Most of the Huaihe region is cropland, while forests in areas with steep slopes and heavy rainfall are also susceptible to soil erosion. The InVEST model in this study overestimated the soil loss but still has an important role in monitoring soil loss (Matomela et al. Citation2022). Due to uncontrollable factors such as precipitation and topography, the application of ecological engineering, such as increasing vegetation coverage and reforestation is the most important means to prevent soil erosion and enhance soil retention.
Preventing soil erosion is a long-term and complex task that must consider both economic development and food security. Although the cultivated land in the Huaihe region is mainly located in the plain area, where the risk of soil erosion is comparatively lower than that of steep slope farming, the risk of soil erosion is still significant. Given the huge size of the Huaihe region, managing it as a whole is challenging. Therefore, dividing the region into small watersheds and managing them individually, while promoting agriculture, forestry, and animal husbandry economy to incentivize residents, and increasing public awareness of ecological and environmental protection through publicity, will help reduce the damage and pollution caused by human activities, thus protecting the ecological security of the Huaihe region more effectively.
Despite our efforts, there remain some limitations in our study, particularly in the use of the InVEST-SDR model and related research results. Due to constraints such as data accuracy, the predicted soil erosion amount may deviate from the actual values. Soil erosion involves various processes, including separation, transport, and deposition of soil particles (Batista et al. Citation2019). Investigating the spatial distribution characteristics of sedimentation can provide scientific insights for the layout of soil and water conservation facilities. This study, however, did not include an estimation of sediment deposition. In future studies, it would be crucial to account for soil deposition, choose reliable methods to estimate each factor of soil erosion, enhance the accuracy of data, and predict potential changes in soil erosion.
Data availability statement
The data are available from the authors upon reasonable request.
Disclosure statement
The authors declare that they have no known competing financial interests or personal relationships that could have appeared to influence the work reported in this paper.
Additional information
Funding
References
- Alewell C, Borrelli P, Meusburger K, Panagos P. 2019. Using the USLE: chances, challenges and limitations of soil erosion modelling. Int Soil Water Conserv Res. 7(3):203–225.
- Aneseyee AB, Elias E, Soromessa T, Feyisa GL. 2020. Land use/land cover change effect on soil erosion and sediment delivery in the Winike watershed, Omo Gibe Basin, Ethiopia. Sci Total Environ. 728:138776.
- Batista PVG, Davies J, Silva MLN, Quinton JN. 2019. On the evaluation of soil erosion models: are we doing enough? Earth Sci Rev. 197:102898.
- Borrelli P, Alewell C, Alvarez P, Anache JAA, Baartman J, Ballabio C, Bezak N, Biddoccu M, Cerdà A, Chalise D, et al. 2021. Soil erosion modelling: a global review and statistical analysis. Sci Total Environ. 780:146494.
- Borselli L, Cassi P, Torri D. 2008. Prolegomena to sediment and flow connectivity in the landscape: a GIS and field numerical assessment. Catena. 75(3):268–277.
- Breiman L. 2001. Random forests. Mach Learn. 45(1):5–32.
- Cao F, Ge Y, Wang JF. 2013. Optimal discretization for geographical detectors-based risk assessment. GISci Remote Sens. 50(1):78–92.
- Conoscenti C, Angileri S, Cappadonia C, Rotigliano E, Agnesi V, Märker M. 2014. Gully erosion susceptibility assessment by means of GIS-based logistic regression: a case of Sicily (Italy). Geomorphology. 204:399–411.
- Costanza R, d‘Arge R, de Groot R, Farber S, Grasso M, Hannon B, Limburg K, Naeem S, O'Neill RV, Paruelo J, et al. 1997. The value of the world’s ecosystem services and natural capital. Nature. 387(6630):253–260.
- de Vente J, Poesen J, Verstraeten G, Govers G, Vanmaercke M, Van Rompaey A, Arabkhedri M, Boix-Fayos C. 2013. Predicting soil erosion and sediment yield at regional scales: where do we stand? Earth Sci Rev. 127:16–29.
- De’ath G, Fabricius KE. 2000. Classification and regression trees: a powerful yet simple technique for ecological data analysis. Ecol. 81(11):3178–3192.2.0.CO;2]
- Dong J, Zhou Y, You N. 2021. The 30 m annual maximum NDVI dataset for China from 2000 to 2020 [DB/OL]. National Ecosystem Science Data Center.
- Dotterweich M. 2013. The history of human-induced soil erosion: geomorphic legacies, early descriptions and research, and the development of soil conservation—A global synopsis. Geomorphology. 201:1–34.
- Ganasri BP, Ramesh H. 2016. Assessment of soil erosion by RUSLE model using remote sensing and GIS-A case study of Nethravathi Basin. Geosci Front. 7(6):953–961.
- Gashaw T, Bantider A, Zeleke G, Alamirew T, Jemberu W, Worqlul AW, Dile YT, Bewket W, Meshesha DT, Adem AA, et al. 2021. Evaluating InVEST model for estimating soil loss and sediment export in data scarce regions of the Abbay (Upper Blue Nile) Basin: implications for land managers. Environ Challenges. 5:100381.
- Ghosh A, Maiti R. 2021. Soil erosion susceptibility assessment using logistic regression, decision tree and random forest: study on the Mayurakshi river basin of Eastern India. Environ Earth Sci. 80(8):1–16.
- Girmay G, Moges A, Muluneh A. 2020. Estimation of soil loss rate using the USLE model for Agewmariayam Watershed, northern Ethiopia. Agric & Food Secur. 9(1):9.
- Hamel P, Chaplin-Kramer R, Sim S, Mueller C. 2015. A new approach to modeling the sediment retention service (InVEST 3.0): case study of the Cape Fear catchment, North Carolina, USA. Sci Total Environ. 524–525:166–177.
- Han J, Rui Y, Yang K, Liu W, Ma T. 2020. Quantitative attribution of national key town layout based on geodetector and the geographically weighted regression model. Prog. Geogr. 39(10):1687–1697.
- Helmi AM. 2022. Quantifying catchments sediment release in arid regions using GIS-based Universal Soil Loss Equation (USLE). Ain Shams Eng J. 102038. Doi: 10.1016/j.asej.2022.102038.
- Jain MK, Das D. 2010. Estimation of sediment yield and areas of soil erosion and deposition for watershed prioritization using GIS and remote sensing. Water Resour Manage. 24(10):2091–2112.
- Yang J, Huang X. 2021. The 30 m annual land cover datasets and its dynamics in China from 1990 to 2020 (1.0.0) [Data set]. Zenodo.
- Kaffas K, Pisinaras V, Al Sayah MJ, Santopietro S, Righetti M. 2021. A USLE-based model with modified LS-factor combined with sediment delivery module for Alpine basins. Catena. 207:105655.
- Laflen JM, Lane LJ, Foster GR. 1991. WEPP: a new generation of erosion prediction technology. J Soil Water Conserv. 46(1):34.
- Lu L, Chao L. 2019. Soil dataset of China based on the Harmonized World Soil Database (HWSD) (v1.1). National Cryosphere Desert Data Center. www.ncdc.ac.cn.
- Magliulo P. 2012. Assessing the susceptibility to water-induced soil erosion using a geomorphological, bivariate statistics-based approach. Environ Earth Sci. 67(6):1801–1820.
- Marques SM, Campos FS, David J, Cabral P. 2021. Modelling sediment retention services and soil erosion changes in Portugal: a spatio-temporal approach. IJGI. 10(4):262.
- Marques V, Ceddia M, Antunes M, Carvalho D, Anache J, Rodrigues D, Oliveira P. 2019. USLE K-factor method selection for a tropical catchment. Sustainability. 11(7):1840.
- Matomela N, Li T, Ikhumhen HO, Raimundo Lopes ND, Meng L. 2022. Soil erosion spatio-temporal exploration and geodetection of driving factors using InVEST-sediment delivery ratio and geodetector models in Dongsheng, China. Geocarto Int. 37(26):13039–13056.
- McCool DK, Foster GR, Mutchler CK, Meyer LD. 1989. Revised slope length factor for the Universal Soil Loss Equation. Trans ASAE. 32(5):1571–1576.
- Merritt WS, Letcher RA, Jakeman AJ. 2003. A review of erosion and sediment transport models. Environ Model Softw. 18(8–9):761–799.
- Mirakhorlo MS, Rahimzadegan M. 2020. Evaluating estimated sediment delivery by Revised Universal Soil Loss Equation (RUSLE) and Sediment Delivery Distributed (SEDD) in the Talar Watershed, Iran. Front Earth Sci. 14(1):50–62.
- Paul SS, Li J, Li Y, Shen L. 2021. Assessing land use–land cover change and soil erosion potential using a combined approach through remote sensing, RUSLE and random forest algorithm. Geocarto Int. 36(4):361–375.
- Pereira P, Bogunovic I, Muñoz-Rojas M, Brevik EC. 2018. Soil ecosystem services, sustainability, valuation and management. Curr Opin Environ Sci Health. 5:7–13.
- Rahman MR, Shi ZH, Chongfa C. 2009. Soil erosion hazard evaluation—an integrated use of remote sensing, GIS and statistical approaches with biophysical parameters towards management strategies. Ecol Modell. 220(13–14):1724–1734.
- Renard KG, 1997. Predicting soil erosion by water: a guide to conservation planning with the Revised Universal Soil Loss Equation (RUSLE). United States: USA Agricultural Research Service.
- Renard KG, Freimund JR. 1994. Using monthly precipitation data to estimate the R-factor in the revised USLE. J Hydrol. 157(1–4):287–306.
- Sharp R, Tallis HT, Ricketts T, Guerry AD, Wood SA, Chaplin-Kramer R, Nelson E, Ennaanay D, Wolny S, Vogl AL, et al. 2014. InVEST user’s guide. Stanford, CA, USA: The Natural Capital Project.
- Song Y, Wang J, Ge Y, Xu C. 2020. An optimal parameters-based geographical detector model enhances geographic characteristics of explanatory variables for spatial heterogeneity analysis: Cases with different types of spatial data. GISci Remote Sens. 57(5):593–610.
- Takken I, Beuselinck L, Nachtergaele J, Govers G, Poesen J, Degraer G. 1999. Spatial evaluation of a physically-based distributed erosion model (LISEM). Catena. 37(3–4):431–447.
- Thomas J, Joseph S, Thrivikramji KP. 2018a. Assessment of soil erosion in a tropical mountain river basin of the southern Western Ghats, India using RUSLE and GIS. Geosci Front. 9(3):893–906.
- Thomas J, Joseph S, Thrivikramji KP. 2018b. Estimation of soil erosion in a rain shadow river basin in the southern Western Ghats, India using RUSLE and transport limited sediment delivery function. Int Soil Water Conserv Res. 6(2):111–122.
- Vigiak O, Borselli L, Newham LTH, McInnes J, Roberts AM. 2012. Comparison of conceptual landscape metrics to define hillslope-scale sediment delivery ratio. Geomorphology. 138(1):74–88.
- Wang JF, Xu CD. 2017. Geodetector: principle and prospective. Acta Geogr Sin. 72(1):116–134. (In Chinese).
- Wang JF, Li XH, Christakos G, Liao YL, Zhang T, Gu X, Zheng XY. 2010. Geographical detectors‐based health risk assessment and its application in the neural tube defects study of the Heshun Region, China. Int J Geographic Info Sci. 24(1):107–127.
- Wei C, Dong X, Yu D, Zhang T, Zhao W, Ma Y, Su B. 2022. Spatio-temporal variations of rainfall erosivity, correlation of climatic indices and influence on human activities in the Huaihe River Basin, China. Catena. 217:106486.
- Williams JR, Renard KG, Dyke PT. 1983. EPIC: a new method for assessing erosion’s effect on soil productivity. J Soil Water Conserv. 38(5):381–383.
- Winterová J, Krása J, Bauer M, Noreika N, Dostál T. 2022. Using WaTEM/SEDEM to model the effects of crop rotation and changes in land use on sediment transport in the Vrchlice watershed. Sustainability. 14(10):5748.
- Wischmeier WH, Smith DD. 1978. Predicting rainfall erosion losses: a guide to conservation planning (No. 537). Department of Agriculture, Science and Education Administration.
- Yu B, Rosewell CJ. 1996. An assessment of a daily rainfall erosivity model for New South Wales. Soil Res. 34(1):139–152.
- Zhang WB, Fu JS. 2003. Rainfall erosivity estimation under different rainfall amount. Res Sci. 25(1):35–41.