
 ?Mathematical formulae have been encoded as MathML and are displayed in this HTML version using MathJax in order to improve their display. Uncheck the box to turn MathJax off. This feature requires Javascript. Click on a formula to zoom.
Abstract
Urban green space (UGS) is crucial in providing ecosystem services and optimizing the health of urban residents. This study aimed at identifying suitable sites for UGS development using geospatial techniques in Addis Ababa City. In the present study, an analytical hierarchical process with Geographic Information Systems based multi-criteria evaluation process was used for identifying suitable sites for UGS development. Eight parameters namely land use land cover types, Normalized Difference Vegetation Index, population density, soil types, slope, elevation, road and rivers were used. Results show that about 1 km2 (0.2%) and 67.4 km2 (12.8%) are categorized as highly suitable and moderately suitable sites for UGS, respectively. About 247.2 km2 (46.9%) of the area was marginally suitable and 205.2 km2(38.9%) was currently not suitable, while 6.2 km2(1.2%) was permanently not suitable. The evaluation of UGS development support policy makers to identify the importance of open green space for environmental quality and quality of life in urban center.
1. Introduction
Urban green space (UGS) is considered as a lung for city dwellers and essential for promoting sustainable development and enhancing the quality of life of residents (Cicea and Pirlogea Citation2011; Yang et al. Citation2022; Anteneh et al. Citation2023). The UGS have a huge potential to regulate the city microclimate (Alkama and Cescatti Citation2016; Li et al. Citation2021; Pamukcu-Albers et al. Citation2021), minimize the risk of urban flooding (Kim et al. Citation2016; Liu et al. Citation2023; Pei et al. Citation2023), absorbs pollutants and release oxygen (Haq Citation2011; Li et al. Citation2018). Other studies highlight the importance of UGS for quality life and behavior in cities (M’lkiugu et al. 2012; Orsi Citation2018; Gelan Citation2021; Li et al. Citation2021). The UGS is crucial to minimize the problem of heat waves, floods, waste water pollution, landslides, coastal erosion, and air pollution (Contesse et al. Citation2018; Yin et al. Citation2022; Zhao et al. Citation2022; Zhu et al. Citation2022). It is clear that UGS can make a significant contribution to carbon sequestration and improves sustainable conservation of biodiversity. By increasing urban green infrastructure can mitigate urban heat island effects and heat wave, and improve urban comfort for the residents (Hansen et al. Citation2015; De Haas et al. Citation2021; Li et al. Citation2023; Yang et al. Citation2023; Yin et al. Citation2023). Due to human activity, the urban heat island effect manifests in towns and cities. A study by Li et al. (Citation2023) documented that the urban heat island effect can be mitigated by green spaces in cities, which also reduce the effects of pollution. Despite the role of UGS in climate change mitigation and environmental health, little attention was given in most of sub-Saharan African countries (Mensah Citation2014; Yang et al. Citation2022a).
In developing countries like Ethiopia, there is a tendency of increasing trend of environmental pollutions and climate change in large cities due to the increasing number of constructions and expansions of small-scale industries (Tarekegn and Gulilat Citation2018). In spite of the role of green space for urban thermal comfort level, the share of UGS that can moderate the urban microclimate is remain limited in big city like Addis Ababa. In addition, the availability of green space in the city has significantly declined due to the need for more space for different factories, construction of large buildings for commercial and residential purposes as well as the construction of illegal houses. These problems hinder the city administrations to meet the minimum standard of urban green area components per person is (9 m2), which proposed by World Health Organization (Girma et al. Citation2019; Yang et al. Citation2022b; Li et al. Citation2023).
Land suitability analysis is vital in UGS planning as it gives room for choosing the most suitable site (Sahabo and Mohammed Citation2016; Guo and Zhong Citation2022). Multi-criteria analysis integrated with the Geographical Information System (GIS) have been increasingly used for site suitability analysis (Uy and Nakagoshi Citation2008; Van Berkel et al. Citation2014; Ustaoglu and Aydınoglu Citation2020). The analytical hierarchical process (AHP) method is one of the most widely used multi-criteria decision-making (MCDM) techniques (Kordi and Brandt Citation2012). It is the best and efficient method methods to extract weights of different factors.
The structural land use plan of Addis Ababa city indicates that the minimum standard for urban green space area is 30% of the total land area (Azagew and Worku Citation2020). A study by Gebeyehu (Citation2014) at Gulele sub city of Addis Ababa indicates the UGS is below standard. The low standard of UGS is the cumulative impacts of the declining of urban green areas and the increasing of built-up area and expansion of transportation infrastructures. Lack of reserved areas for green space, weak urban policy, limited number of parks, and lack of urban agroforestry contributes for the declining of urban green space (Mao et al. Citation2022; Wang et al. Citation2022). Recent studies by Woldesemayat and Genovese (Citation2021) indicate that public access to greenspace in Addis Ababa city was substantial declined as a result of city expansions and road infrastructures. Moreover, the ecological, educational, economic and social roles of urban green areas are getting less attention.
Urban green space development policies are clearly stated and have a strong constitutional foundation. Nevertheless, it is considered that the Growth and Transformation Program 2010–2015 (GTPI), Growth and Transformation Program 2016–2020 (GTPII), and Climate Resilient Green Economy (CRGE) are some of the initiatives promoting the importance’s of UGS (Gebrehiwot et al. Citation2014). These initiatives lack a comprehensive understanding of urban green development and implementation, focusing instead on broad green development and conservation (Eshetu et al. Citation2021). To provide shading, reduce runoff, mitigate the urban heat island effect, and sequester carbon, street tree plantings are recommended in the Green Infrastructure Based Landscape Design Supporting Manual, which was developed in 2011 (Ayele et al. Citation2022). The regulations and rules created by the relevant organizations are ambiguous, and law enforcement rarely applies to green environments.
The UGS played a crucial role in maintaining a health urban environment. A significant warming has been observed in Addis Ababa city as vegetation cover declines (Warkaye et al. Citation2018). In spite of this problem, little efforts have been conducted to minimize the potential impacts of UGS depletion. Previous studies have been conducted on UGS development in Ethiopia (Abebe and Megento Citation2017; Teferi and Abraha Citation2018; Gelan Citation2021; Worku et al. Citation2021). Other scholars investigate the impacts of urban LULC change on heat island and Urban thermal comfort level Addis Ababa city (Moisa and Gemeda Citation2021; Moisa and Gemeda Citation2022; Moisa et al. Citation2022a). Even though UGS plays a crucial role to minimize the impacts of urban land use and land cover (LULC) changes on urban heat island, the importance of UGS to mitigate urban climate change is less emphasized. Therefore, this study is aimed to fill the existing research gap by evaluating UGS suitability in Addis Ababa city by using geospatial techniques. The findings of this study are crucial for city land use planning and decision support for the development of UGS development.
2. Methods and materials
2.1. Descriptions of the study area
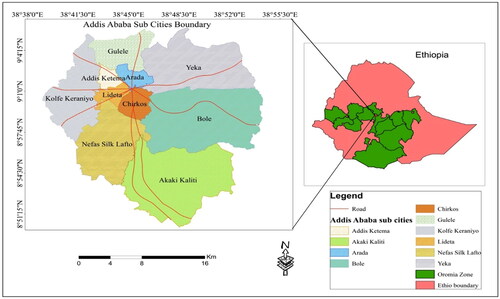
Addis Ababa is the capital of Ethiopia. It is located in the heart of the country surrounded by Oromia Special Zones and covers an area about 527 km2. The city lies to the north of the equator between 8°51′15″and 9°4′15″N latitude and 38°38′0″ and 38°55′30″E longitude (). The city has been considered as the center of social, economic and political for the country. Addis Ababa city has an estimated population of 4, 592,000 with annual growth rate of 4% [Central Statistical Agency (CSA)), Citation2019)]. The city population is projected to reach seven million population by the year 2039 (Arsiso et al. Citation2017).
Figure 1. Map of the study area.
“Source: Author’s own conception.”
The mean minimum and maximum temperature at Bole Sub-city of Addis Ababa varied between 7.66 °C to 11.61 °C, and 22.65 °C to 24.54 °C, respectively (Alemu and Dioha Citation2020). The city of Addis Ababa experienced flash floods as a result of poor drainage system, rapid housing development along the river banks (Birhanu et al. Citation2016). Due to the declining of UGS and increasing of impervious surfaces the land surface temperature and urban heat islands are significantly increasing over the past decades (Moisa and Gemeda Citation2022).
2.1.1. Land use land cover change of Addis Ababa
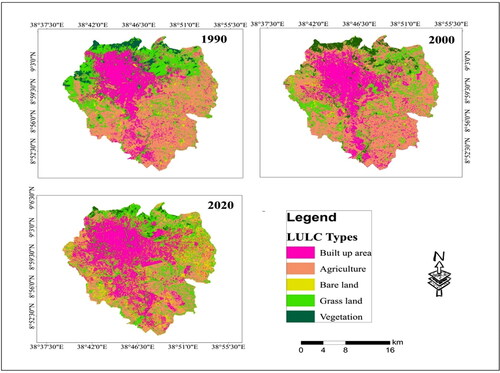
The LULC of Addis Ababa city was classified into five major classes. From the calculated Landsat images results show that the built-up area was the most dominant LULC classes over the past three decades. Due to rapid human population growth and growing demands for residential and commercial buildings aggravated the conversion of LULC around the periphery of the city. The built-up area increased substantial, while agriculture, vegetation and grassland were dramatically decreased between the 1990 and 2020 (). A study by Nor et al. (Citation2017) confirmed that rapid urbanization has had a significant impact on UGS development. To overcome such problems, effective strategies are required to achieve the sustainable development.
Figure 2. Map of land cover changes in last few decades.
“Source: Author’s own conception.”
2.2. Data sources
Landsat 8 OLI/TIRS of 30-meter resolution, DEM were downloaded from the USGS website (https://www.usgs.gov/ accessed on July 1,2021). Soil types, population density, road networks and drainage network of the study area were obtained from Ministry of agriculture, CSA and Addis Ababa city land administration (). The LULC types, Normalized Difference Vegetation Index (NDVI), population density, soil types, slope, elevation, road and rivers were identified as the main attributes for the evaluation of UGS development suitability analysis, which was selected based on the existing scientific literatures.
Table 1. Data types and sources and purpose.
2.3. Data analysis
Suitability analysis of UGS of the study area was determined by using GIS and multi criteria evaluation (MCE). For this study, eight parameters mainly slope, LULC types, NDVI, population density, soil types, altitude (elevation), river and road data were produced in ArcGIS environment to evaluate land suitability for UGS development (). All parameters were reclassified and weighted based on the relative importance and degree of influence () using a pairwise comparison matrix (Saaty Citation1980; Kordi and Brandt Citation2012; Girma et al. Citation2020). Finally, the relative importance of each parameter was calculated by normalizing the eigenvector of the factors (Camiz and Pillar Citation2018). With the support of a pairwise comparison matrix, each factor was compared with the other factors, relative to its importance, on a scale from 1/9 to 9 as proposed by Saaty (Citation2002) (). The pairwise comparison matrix method uses people and expert preferences (Morales and de Vries Citation2021) for comparing the classes and make matrix table. The consistency ratio (CR) and consistency index (CI) for criteria are calculates as shown in Eq. 1 and Equation 2.
Figure 3. Methodological flow chart of the study.
“Source: Author’s own conception.”
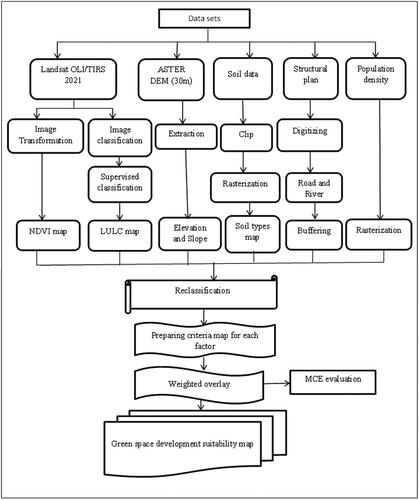
Table 2. Relative importance factors value (Adapted from Saat’s 1980).
Table 3. Pair wise comparison matrix of parameter selected for this study.
The consistency check formula is:
(Eq 1)
(Eq 1)
where: λmax is the largest Eigen value of the pairwise comparison matrix and n is the number of classes.
Then, CR taken by the following formula (Eq 2) (Saaty Citation1980)
(Eq 2)
(Eq 2)
where: RI is the ratio index/average value of CI for random matrices.
2.3.1. Weighted overlay analysis
After weighing of criteria regarding their importance for green space suitability analysis, all criteria maps were overlaid using suitability index (Gelan Citation2021). Overall urban green area was generated by aggregating the output from AHP following Kahsay et al. (Citation2018) using equation (Eq 3).
(Eq 3)
(Eq 3)
where SI = Suitability Index, Wi = weight of factor I, and Xi = normalized criterion score of factors. Finally, the weight was assigned based on their degree of influence.
3. Result and discussions
3.1. Parameters used for urban green space development suitability analysis
The determinant evaluation for UGS suitability analysis was performed based on eight factors. These factors include slope, LULC, elevation, NDVI, population density, soil type, roads, and streams. Taking all these factors into consideration, we have been able to evaluate land suitability for UGS development. Based on geographical location and other parameters we used eight factors to evaluate the suitability of UGS. The results of this study are important not only for city administration, but also for citizens to enjoy fresh air. The UGS make the city residents more resilient to climate extremes like drought, flood and heat waves. The provision of UGS indicates the accessibility to fresh air that can support city administration and planners to improve the well-being of the city population and maintaining the urban thermal comfort level. Orsi (Citation2018) conclude that the distribution and accessibility of urban green areas can determine the quality of life in cities.
3.1.1. Slope
Slope is one the key parameters that determine UGS suitability analysis. For instance, growth and development of green vegetation can affect by slope. The slope factor reveals the amount to which the ground is sloped. The areas captured with gentle (low) slopes are highly suitable for UGS development. Slope based land suitability for UGS was classified into highly suitable, moderately suitable, marginally suitable, currently not suitable and permanently not suitable. Increasing the slope related with decreasing land suitability for UGS and vice versa (Teferi and Abraha Citation2018, Gelan Citation2021). The slope area less than 5% is, considered as flat and it is highly suitable, slope 5–10% is gentle slopes and these slopes are, considered as suitable for the UGS development (). The results show that 29.3% of slope is highly suitable, while 3.3% of slope is permanently not suitable for UGS ().
Figure 4. Slope map of the study area.
“Source: Author’s own conception.”
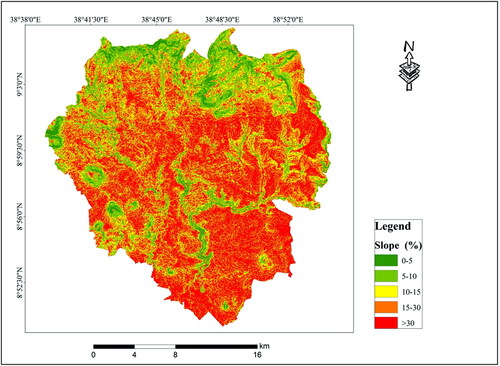
Table 4. Slope category and their suitability level.
3.1.2. Land use and land cover
Since Addis Ababa city is experiencing rapid urbanization with high population growth rate. There is a mismatch between demand of land and supply for house construction, which may force some people to buys and sells land illegally in and around the periphery of the city. This illegal land sales remains the key problems not only in urban centers but also in the countryside (Holden and Bezu Citation2016). A study conducted by Abebe et al. (Citation2019) at Jimma city found that the low economic class was more involved in illegal house construction than the wealthy. The LULC is another factor used for UGS development. The LULC of the Addis Ababa city were produced from Landsat images of the study area and classified into five classes. These classes are agriculture, bare land, built up area, grassland and vegetation (; ). According to Abebe and Megento (Citation2017) and Girma et al. (Citation2019) suggested that vegetation, bare land and grassland are the best area for UGS development. This is because it does not take much to turn a barren and grassy area into a green space. It is too costly to covert the built-up area into UGS. In addition, urban land with vegetation cover was more appropriate for UGS development in the study area (Azagew and Worku Citation2020). Besides, costly it may result to conflict between the city administration and residents. Therefore, it is better if the city administration considers the issue of UGS development in urban planning.
Figure 5. LULC map of the study area.
“Source: Author’s own conception.”
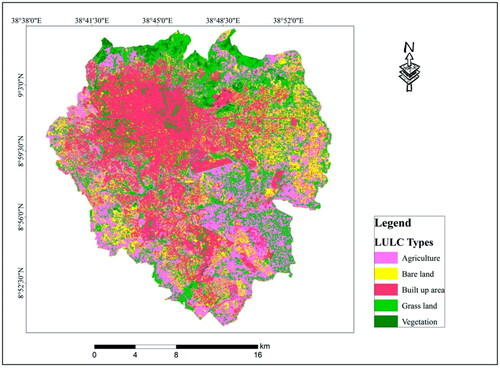
Table 5. LULC types and areal coverage of the study area.
3.1.3. Elevation
Elevation is the key factors to determine UGS development (Mahmoud and El-Sayed Citation2011). According to Gelan (Citation2021) confirmed that the area of low elevation was more suitable for UGS development. The green space area has the capacity to minimize susceptible to storm water accumulation and flooding. Kim et al. (Citation2016) highlights the importance of UGS in flood risk minimization and management. In the present study, we classified elevation of the study area as highly suitable (<2600 m), moderately suitable (2600–2650 m), marginally suitable (2650–2700 m), currently not suitable (2700–2800 m), and permanently not suitable (>2800 m) for UGS development (; ). This classification of elevation for UGS development was more consistence with previous studies (Girma et al. Citation2019).
Figure 6. Elevation map of the study area.
“Source: Author’s own conception.”
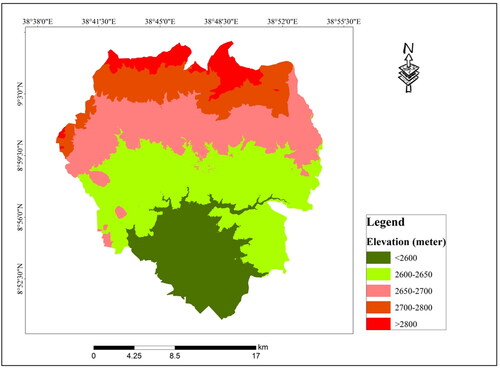
Table 6. Elevation and their suitability level.
3.1.4. Normalized difference vegetation Index (NDVI)
Normalized Difference Vegetation Index (NDVI) is other parameters to determine the green space suitable area and can inform the current environmental conditions, as well as future opportunities of UGS development suitable area (Wang et al. Citation2022). From the calculated data, NDVI greater than 0.3 is highly suitable for UGS development, whereas, NDVI values less than 0 is permanently not suitable for suitability analysis of UGS development (; ). The UGS can improve urban resiliency to climate extremes like heat waves and maintain sustainability of cities in addition to ecological and economic contributions (Kim et al. Citation2016). Study by Moisa et al. (Citation2022b) over Jimma city in southwestern parts of Ethiopia confirmed that vegetation coverage, open and green space area played a crucial role in urban thermal environment. The classification of NDVI for this study was based the classification of (Abebe and Megento Citation2017) which have been conducted in Bole sub city of Addis Ababa.
Figure 7. NDVI map of the study area.
“Source: Author’s own conception.”
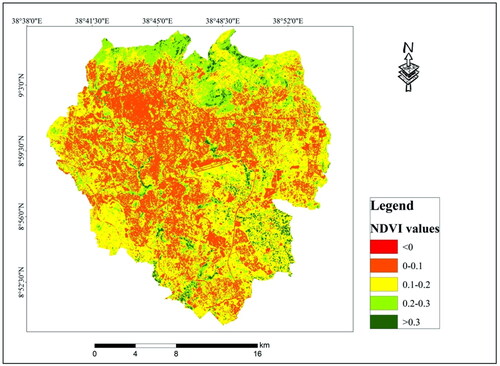
Table 7. NDVI Values and their suitability.
3.1.5. Population density
Population density is another crucial factor for the analysis of green space development (Gelan Citation2021). Highly populated area was more related with dense built-up area with highly vulnerable for heat stress from urban heat island and heat wave in the study area (Li et al. Citation2020). Hence, highly populated areas are highly suitable for HGS development and vice versa (Abebe and Megento Citation2017). From the calculated result, population density >300pop/ha highly suitable and <50 pop/ha permanently not suitable for UGS development (; ). Previous study by Tarekegn and Gulilat (Citation2018) reported that the city of Addis Ababa experiencing a higher population growth driven by rural to urban migration. According to Central Statistical Agency (CSA)) (Citation2007) report the population growth rate of Addis Ababa city was about 2.1%.
Figure 8. Population density of the study area.
“Source: Author’s own conception.”
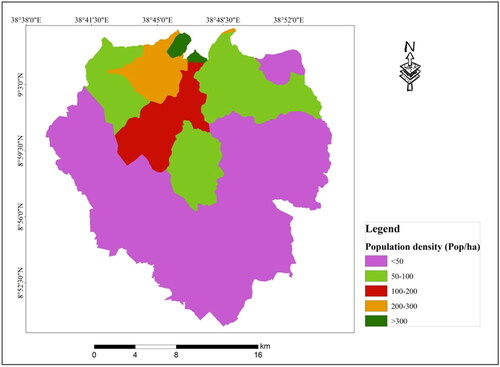
Table 8. Population density and suitability level.
3.1.6. Soil types
According to Abebe and Megento (Citation2017) suggested that, chromic vertisols and chromic luvisols are considered as suitable soil as it is deep soil and contain 45% clay or more clay which is high natural fertility. Moreover, the black or dark colors of soils as indicators of good soils (fertile soils) are reflections of the high amounts of organic matter contents in the soils (FAO Citation1984; He et al. Citation2021; Zhang et al. Citation2021). Orthic solonchaks consider unsuitable compared to clay soil (Cheng and Fu Citation2022). About 56.3 km2 captured by chromic vertisols and chromic luvisols were highly suitable for urban green development (; ).
Figure 9. Soil types of the study area.
“Source: Author’s own conception.”
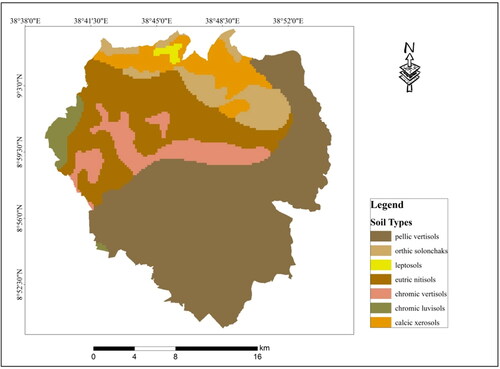
Table 9. Soil types and suitability level.
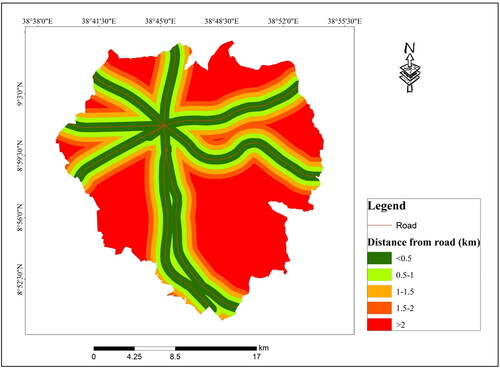
3.1.7. Roads
Proximity the roads to green space is one of the key parameters that determine the effectiveness and the likelihood of monitoring and maintenance of UGS development. As distance of UGS away from the road, acceptability of urban land for urban green space becomes decreased. Accessibility as an important factor for suitability urban green space analysis (Yang et al. Citation2009; Kumar and Biswas Citation2013). Tahmasebi et al. (Citation2014) and Chandio et al. (Citation2011) confirmed that the green space area is better when it is located at a suitable distance from roads. Accordingly, the green space site is unsuitable if distance from roads is greater than 2 km. The distance starting from 0.5–1 km is considered as moderately suitable and distance less than 0.5 km, is highly suitable (). Several studies have demonstrated the important influence that green spaces have on human health. Green spaces help individuals live longer, enhance air quality, and reduce traffic noise and city temperatures (Schindler et al. Citation2022).
Figure 10. Distance from roads map.
“Source: Author’s own conception.”
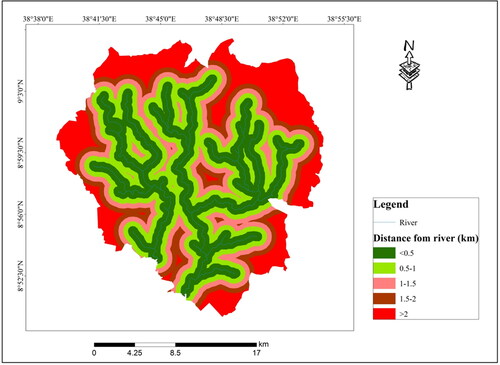
3.1.8. Stream (Rivers)
Water body was more suitable for vegetation growth, flourished with denser oxygen levels, fewer contents of carbon dioxide and conducive environments for human recreational site. The urban area closer to streams/rivers is more suitable UGS development and used to maintain the environmental health of the area (Pareta Citation2013). Lands closest to water resources like rivers, lakes and reservoirs are highly suitable for green space development. Therefore, from calculated data, the distance from the river is < 0.5 km, the area is highly suitable and in between 0.5 km-1 km moderately suitable ().
Figure 11. Distance from River map.
“Source: Author’s own conception.”
3.2. Suitable area for urban green space development of Addis Ababa city
The result of this study, combined from eight (8) factors, UGS development of Addis Ababa city was analyzed. Final land suitability map of urban green development of the study area was produced. The Northern part of the study area, Gulele and Yeka, sub cities were highly suitable and moderately suitable are available, respectively. Eastern and central parts of the area were dominated by marginally suitable, currently not suitable and permanently not suitable (). The results show that about 1 km2 (0.2%) occupied by high suitable and 67.4 km2 (12.8%) was dominated by moderately suitable in the study area. In addition, marginally suitable occupies about 247.2 km2 (46.9%), lastly, currently not suitable and permanently not suitable occupies about 38.9% and 1.2%, respectively (). The results of this finding it in line with the goal of Ethiopia’s Environmental Policy, established in 1997, is to plan and develop green spaces inside metropolitan areas that offer recreational opportunities for cities dwellers and improve urban microclimates. In addition, the goal of the 2015-developed urban greenery and beautification policy is to provide green spaces that combat environmental degradation, pollution, and urban flooding while also promoting environmental sustainability (Girma et al. Citation2019). Similarly, establishing ecologically sound, aesthetically pleasing, and socially beneficial green spaces in cities is one of the goals of Ethiopia’s national urban green infrastructure standard, which was developed in 2015. Another goal is to provide suitable, sufficient, and ecologically viable green spaces to meet the community’s recreational, social, economic, and environmental needs (Eshetu et al. Citation2021). The results of this research paper provide direction for the community in Addis Ababa to organize them to planting and maintaining trees to earn personal income from the city administration office and improve their own livelihoods. Consequently, urban planners used this result to create effective design for effective UGS development strategies.
Figure 12. Suitable area for urban green space development map.
“Source: Author’s own conception.”
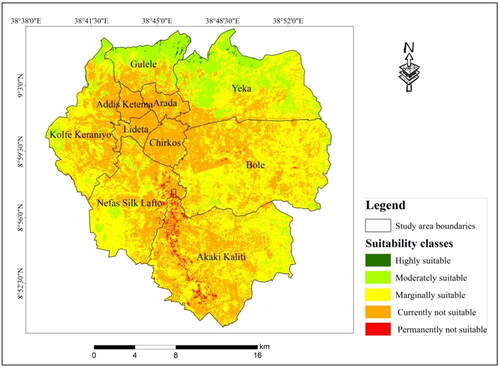
Table 10. Suitability classes and the corresponding area coverage.
4. Conclusion
The UGS are crucial elements of the city’s framework that improve the welfare and lifestyles of its residents. Beside this importance, the status of UGS is being decreased and eradicated due to rapid human population development, native and exotic trees that were planted to beautify the urban environment and required urgent scientific investigation for the future management action. This study evaluates UGS suitability of Addis Ababa city by using the integration of analytical hierarchical process and GIS based multi-criteria evaluation. The LULC types, NDVI, population density, soil type, slope, elevation, road and rivers were used as the key parameters determining UGS development. The UGS suitability analysis is crucial for city administration to design effective strategies to maintain the urban thermal environmental in one hand, and minimizing the possible occurrence of climate extremes in the other hand. Green urban area can enhance the quality of urban residents through providing social, economic aesthetics values beside climate change regulations. The vast majority of the urban residents have less access to nearby public urban green open space due to lack of sufficient information about the advantage of green space development for their livelihoods. Urban green spaces are important to provide multiple benefits through acting as a lung of cities, improve the physical, psychological stress relief center and improve social harmony through social interaction and recreation. Thus, UGS development is an essential not optional for mega cities like Addis Ababa. The UGS are considered as an important natural donor that supplies numerous ecosystem services and thus stakeholders should give high priority for this sector.
An integrated analytical hierarchical process and GIS might be an effective tool for evaluation of UGS suitability analysis. These integrated approaches allow considering multi factors to understand the importance of different factors for suitability analysis. From the final result of land suitability classes for UGS development, marginally suitable and currently not suitable classes were dominating than highly suitable and moderately suitable classes in the study area. This implies that, rapid urban expansion from informal urban settlement with a little attention of UGS in the Addis Ababa city. Urban planners, decision makers, environment and climate change resilience specialists, natural resource managers and others concerned bodies must provide a crucial responsibility for the conservation and protection of UGS to ensure sustainable urban development in the city. Furthers studies which considers socio economic data, high resolution satellite images like aerial photography and quick bird are required to forward feasible policymakers for UGS development of Addis Ababa city.
Consent for publication
The authors agreed to publish this manuscript for publication.
Author contributions
MBM involved in conceptualization, data collection, software, visualization, data analysis and developing original draft of the manuscript. BBO, KTD and MEF participated in methodology, data analysis and manuscript edition. MMG and DOG contributed in conceptualization, validation of results, review and edition of the final manuscript. All authors read and approved the final manuscript.
Acknowledgments
The authors would like to acknowledge Wollega University Shambu Campus Faculty of Technology and Faculty of Agriculture, Oda Bultum University, Raya University, Wollega University Nekemte campus and Jimma University College of Agriculture and Veterinary Medicine for the existing facilities to conduct this research.
Disclosure statement
No potential conflict of interest was reported by the authors.
Availability of data
Available in this manuscript.
References
- Abebe MS, Derebew KT, Gemeda DO. 2019. Exploiting temporal-spatial patterns of informal settlement using GIS and remote sensing technique: a case study of Jimma city, Southwestern Ethiopia. Environ Syst Res. 8(1). https://doi.org/10.1186/s40068-019-0133-5
- Abebe MT, Megento TL. 2017. Urban green space development using GIS-based multi-criteria analysis in Addis Ababa metropolis. Appl Geomat. 9(4):247–261.
- Alemu ZA, Dioha MO. 2020. Climate change and trend analysis of temperature: the case of Addis Ababa, Ethiopia. Environ Syst Res. 9(1). https://doi.org/10.1186/s40068-020-00190-5
- Alkama R, Cescatti A. 2016. Biophysical climate impacts of recent changes in global forest cover. Science. 351(6273):600–604.
- Anteneh MB, Damte DS, Abate SG, Gedefaw AA. 2023. Geospatial assessment of urban green space using multi-criteria decision analysis in Debre Markos City, Ethiopia. Environ Syst Res. 12(1).
- Arsiso BK, Tsidu GM, Stoffberg GH, Tadesse T. 2017. Climate change and population growth impacts on surface water supply and demand of Addis Ababa, Ethiopia. Clim Risk Manage. 18:21–33.
- Ayele BY, Megento TL, Habetemariam KY. 2022. The governance and management of green spaces in Addis Ababa, Ethiopia. Heliyon. 8(5):e09413.
- Azagew S, Worku H. 2020. Accessibility of urban green infrastructure in Addis-Ababa city, Ethiopia: current status and future challenge. Environ Syst Res. 9(1):26.
- Birhanu D, Kim H, Jang C, Park S. 2016. Flood risk and vulnerability of Addis Ababa City due to climate change and urbanization. Procedia Eng. 154:696–702.
- Camiz S, Pillar VD. 2018. Identifying the information/signal dimension in principal component analysis. Mathematics. 6(11):269.
- Central Statistical Agency (CSA). 2007. [accessed 2022 Jan 10]. http://www.csa.gov.et/censusreport/complete-report/census-2007?start=5.
- Central Statistical Agency (CSA). 2019. Population and housing census annual report of Ethiopia, Central Statistic Authority of Ethiopia, Addis Ababa. https://dhsprogram.com/pubs/pdf/FR363/FR363.pdf
- Chandio IA, Matori AN, Lawal DU, Sabri S. 2011. GIS- based land suitability analysis using AHP for public parks planning in Larkana City. MAS. 5(4):178–184.
- Cheng Y, Fu L. 2022. Nonlinear seismic inversion by physics-informed Caianiello convolutional neural networks for overpressure prediction of source rocks in the offshore Xihu depression, East China. J Petroleum Sci Engin. 215:110654.
- Cicea C, Pirlogea C. 2011. Green spaces and public health in urban areas. Theor Empir Res Urban Manage. 6(1):83–92.
- Contesse M, van Vliet BJM, Lenhart J. 2018. Is urban agriculture urban green space? A comparison of policy arrangements for urban green space and urban agriculture in Santiago de Chile. Land Use Policy. 71:566–577.
- De Haas W, Hassink J, Stuiver M. 2021. The role of urban green space in promoting inclusion: experiences from the Netherlands. Front Environ Sci. 9:618198.
- Eshetu SB, Yeshitela K, Sieber S. 2021. Urban green space planning, policy implementation, and challenges: the case of Addis Ababa. Sustainability. 13(20):11344.
- FAO. 1984. Degradation processes in the Ethiopian highlands, their impacts and hazards. Rome: Food and Agriculture Organization.
- Gebeyehu A. 2014. Assessment of urban green area development in Addis Ababa with particular reference to Gullelle Sub city. [MA thesis]. Addis Ababa University.
- Gebrehiwot BA, Gebre-Eyesus M, Bekele F. 2014. Alleviating the barriers to domestic investment in Addis Ababa: underlying causes and proposed solutions. https://mpra.ub.uni-muenchen.de/id/eprint/80112.
- Gelan E. 2021. GIS-based multi‐criteria analysis for sustainable urban green spaces planning In emerging towns of Ethiopia: the case of Sululta town. Environ Syst Res. 10(1):1–14.
- Girma R, Gebre E, Tadesse T. 2020. Land suitability evaluation for surface irrigation using spatial information technology in Omo-Gibe River Basin, Southern Ethiopia. Irrigat Drainage Sys Eng. 9(2).
- Girma Y, Terefe H, Pauleit S, Kindu M. 2019. Urban green infrastructure planning in Ethiopia: the case of emerging towns of Oromia Special Zone surrounding Finfinne. J Urban Manage. 8(1):75–88.
- Guo Q, Zhong J. 2022. The effect of urban innovation performance of smart city construction policies: evaluate by using a multiple period difference-in-differences model. Technol Forecasting Social Change. 184:122003.
- Hansen R, Frantzeskaki N, McPhearson T, Rall E, Kabisch N, Kaczorowska A, Kain J-H, Artmann M, Pauleit S. 2015. The uptake of the ecosystem services concept in planning discourses of European and American cities. Ecosyst Serv. 12:228–246.
- Haq SMA. 2011. Urban green spaces and an integrative approach to sustainable environment. JEP. 2(5):601–608.
- He M-Y, Dong J-B, Jin Z, Liu C-Y, Xiao J, Zhang F, Sun H, Zhao Z-Q, Gou L-F, Liu W-G, et al. 2021. Pedogenic processes in loess-paleosol sediments: clues from Li isotopes of leachate in Luochuan loess. Geochim Cosmochim Acta. 299:151–162.
- Holden ST, Bezu S. 2016. Preferences for land sales legalization and land values in Ethiopia. Land Use Policy. 52:410–421.
- Kahsay A, Haile M, Gebresamuel G, Mohammed M. 2018. GIS-based multi-criteria Model for land suitability evaluation of rain fed teff crop production in degraded semi-Arid highlands of Northern Ethiopia. Model Earth Syst Environ. 4(4):1467–1486.
- Kim H, Lee DK, Sung S. 2016. Effect of urban green spaces and flood area type on flooding probability. Sustainability. 8(2):134.
- Kordi M, Brandt SA. 2012. Effects of increasing fuzziness on analytic hierarchy process for Spatial multi criteria decision analysis. Comput Environ Urban Syst. 36(1):43–53.
- Kumar M, Biswas V. 2013. Identification of potential sites for urban development using GIS based multi criteria evaluation technique. A case study of Shimla Municipal Area, Shimla District, Himachal Pradesh, India. J Settl Spat Plan. 4(1):45–51.
- Li Z, Fan Z, Shen S. 2018. Urban green space suitability evaluation based on the AHP-CV combined weight method: a case study of Fuping Country, China. Sustainability. 10(8):2656.
- Li M, Li X, Song D, Zhai H. 2021. Evaluation and monitoring of urban public greenspace planning using landscape metrics in Kunming. Sustainability. 13(7):3704.
- Liu Z, Xu J, Liu M, Yin Z, Liu X, Yin L, Zheng W. 2023. Remote sensing and geostatistics in urban water-resource monitoring: a review. Mar Freshwater Res.
- Li J, Wang Z, Wu X, Xu C, Guo S, Chen X. 2020. Toward monitoring short-term droughts using a novel daily scale, standardized antecedent precipitation evapotranspiration index. J Hydrometeorol. 21(5):891–908.
- Li X, Zhang X, Jia T. 2023. Humanization of nature: testing the influences of urban park characteristics and psychological factors on collegers’ perceived restoration. Urban Forestry & Urban Greening. 79:127806. https://doi.org/10.1007/s10668-022-02175-z
- Li L, Zheng Y, Ma S. 2023. Links of urban green space on environmental satisfaction: a spatial and temporarily varying approach. Environ Dev Sustain. 25(4):3469–3501.
- M’Ikiugu MM, Kinoshita I, Tashiro Y. 2012. Urban green space analysis and identification of its potential expansion areas. Proc-Soc Behav Sci. 35:449–458.
- Mahmoud AHA, El-Sayed MA. 2011. Development of sustainable urban green areas in Egyptian New cities: the case of El-Sadat City. Landscape Urban Plann. 101(2):157–170.
- Mao Y, Sun R, Wang J, Cheng Q, Kiong LC, Ochieng WY. 2022. New time-differenced carrier phase approach to GNSS/INS integration. GPS Solut. 26(4):122.
- Mensah CA. 2014. Urban green spaces in Africa: nature and challenges. Int J Ecosyst. 4(1):1–11.
- Moisa MB, Dejene IN, Roba ZR, Gemeda DO. 2022a. Impact of urban land use and land cover change on urban heat island and urban thermal comfort level: a case study of Addis Ababa City, Ethiopia. Environ Monit Assess. 194(10):736.
- Moisa MB, Gemeda DO. 2021. Analysis of urban expansion and land use/land cover changes using geospatial techniques: a case of Addis Ababa City, Ethiopia. Appl Geomat. 13(4):853–861.
- Moisa MB, Gemeda DO. 2022. Assessment of urban thermal field variance index and thermal comfort level of Addis Ababa Metropolitan City, Ethiopia. Heliyon. 8(8):e10185.
- Moisa MB, Merga BB, Gemeda DO. 2022. Urban heat island dynamics in response to land use land cover change: a case of Jimma city, southwestern Ethiopia. Theor Appl Climatol. 149(1–2):413–423.
- Morales F, de Vries WT. 2021. Establishment of land use suitability mapping criteria using Analytic Hierarchy Process (AHP) with practitioners and beneficiaries. Land. 10(3):235.
- Nor ANM, Corstanje R, Harris JA, Brewer T. 2017. Impact of rapid urban expansion on green space structure. Ecol Indic. 81:274–284.
- Orsi F. 2018. How densely populated and green are the places we live in? A study of the ten largest US cities. Land Use Policy. 76:300–316.
- Pamukcu-Albers P, Ugolini F, La Rosa D, Grădinaru SR, Azevedo JC, Wu J. 2021. Building green infrastructure to enhance urban resilience to climate change and pandemics. Landsc Ecol. 36(3):665–673.
- Pareta K. 2013. Remote sensing and GIS based site suitability analysis for tourism development. Int J Adv Res Sci Eng Technol. 2(5):43–56.
- Pei Y, Qiu H, Zhu Y, Wang J, Yang D, Tang B, Wang F, Cao M. 2023. Elevation dependence of landslide activity induced by climate change in the eastern Pamirs. Landslides. 20(6):1115–1133.
- Saaty TL. 1980. The analytic hierarchy process: planning, priority setting, resources allocation. New York: McGraw, p. 281.
- Saaty TL. 2002. Decision making with the analytic hierarchy process. Scientia Iranica. 9(3):215–229.
- Sahabo AA, Mohammed AB. 2016. A GIS based multi-criteria analysis for siting recreational parks in Yola-North local government. Int J Appl Sc Eng Res. 5(1):20–29.
- Schindler M, Le Texier M, Caruso G. 2022. How far do people travel to use urban green space? A comparison of three European cities. Appl Geogr. 141:102673.
- Tahmasebi E, Jalali M, Gharehghashlo M, Nicknamfar M, Bahmanpour H. 2014. Urban Park site selection at local scale by using geographic information system (GIS) and analytic hierarchy process (AHP). Eur. J. Exp. Biol. 4(3):357–365.
- Tarekegn MM, Gulilat TY. 2018. Trends of ambient air pollution and the corresponding respiratory diseases in Addis Ababa. Clin Pharmacol Toxicol J. 2(1):5.
- Teferi E, Abraha H. 2018. Urban heat island effect of Addis Ababa City: implications of urban green spaces for climate change adaptation. Climate Change Adaptation in Africa; pp. 539–552. https://doi.org/10.1007/978-3-319-49520-0_33
- Ustaoglu E, Aydınoglu AC. 2020. Site suitability analysis for green space development of Pendik district (Turkey). Urban Forestry Urban Greening. 47:126542.
- Uy PD, Nakagoshi N. 2008. Application of land suitability analysis and landscape ecology to urban greenspace planning in Hanoi, Vietnam. Urban Forestry Urban Greening. 7(1):25–40.
- Van Berkel DB, Munroe DK, Gallemore C. 2014. Spatial analysis of land suitability, hot-tub cabins and forest tourism in Appalachian Ohio. Appl Geogr. 54:139–148.
- Wang P, Yu P, Lu J, Zhang Y. 2022. The mediation effect of land surface temperature in the relationship between land use-cover change and energy consumption under seasonal variations. J Cleaner Prod. 340:130804.
- Wang G, Zhao B, Wu B, Wang M, Liu W, Zhou H, Zhang C, Wang Y, Han Y. 2022. Research on the macro-mesoscopic response mechanism of multisphere approximated heteromorphic tailing particles. Lithosphere. 2022(Special 10):1977890.
- Warkaye S, Suryabhagavan KV, Satishkumar B. 2018. Urban green areas to mitigate urban heat island effect: the case of Addis Ababa. Ethiopia. Int J Ecol Environ. 44(4):353–367.
- Woldesemayat EM, Genovese PV. 2021. Monitoring urban expansion and urban green spaces change in Addis Ababa: directional and zonal analysis integrated with landscape expansion index. Forests. 12(4):389.
- Woldesemayat EM, Genovese PV. 2021. Urban green space composition and configuration in functional land use areas in Addis Ababa, Ethiopia, and their relationship with urban form. Land. 10(1):85.
- Worku G, Teferi E, Bantider A. 2021. Assessing the effects of vegetation change on urban land surface temperature using remote sensing data: the case of Addis Ababa city, Ethiopia. Remote Sens Appl: Soc Environ. 22:100520.
- Yang J, Fu L, Fu B, Deng W, Han T. 2022a. Third-order padé thermoelastic constants of solid rocks. JGR Solid Earth. 127(9):e2022J–e24517J.
- Yang J, Fu L-Y, Zhang Y, Han T. 2022b. Temperature- and pressure-dependent pore microstructures using static and dynamic moduli and their correlation. Rock Mech Rock Eng. 55(7):4073–4092.
- Yang Z, Xu J, Feng Q, Liu W, He P, Fu S. 2022. Elastoplastic analytical solution for the stress and deformation of the surrounding rock in cold region tunnels considering the influence of the temperature field. Int J Geomech. 22(8):4022118.
- Yang M, Zhao A, Ke H, Chen H. 2023. Geo-environmental factors & rsquo; Influence on the prevalence and distribution of dental fluorosis: evidence from Dali County, Northwest China. Sustainability. 15(3):1871.
- Yang J, Zhao L, Mcbride J, Gong P. 2009. Can you see green? Assessing the visibility of urban forest in cities. Landscape Urban Plann. 91(2):97–104.
- Yin L, Wang L, Keim BD, Konsoer K, Zheng W. 2022. Wavelet analysis of dam injection and discharge in three gorges dam and reservoir with precipitation and river discharge. Water. 14(4):567.
- Yin L, Wang L, Tian J, Yin Z, Liu M, Zheng W. 2023. Atmospheric density inversion based on swarm-C satellite accelerometer. Appl Sci. 13(6):3610.
- Zhang S, Bai X, Zhao C, Tan Q, Luo G, Wang J, Li Q, Wu L, Chen F, Li C, et al. 2021. Global CO2 consumption by silicate rock chemical weathering: its past and future. Earth’s Future. 9(5):e1938E–e2020E.
- Zhao L, Du M, Du W, Guo J, Liao Z, Kang X, Liu Q. 2022. Evaluation of the carbon sink capacity of the proposed Kunlun Mountain National Park. IJERPH. 19(16):9887.
- Zhu X, Xu Z, Liu Z, Liu M, Yin Z, Yin L, Zheng W. 2022. Impact of dam construction on precipitation: a regional perspective. Mar Freshwater Res. https://doi.org/10.1071/MF22135