
 ?Mathematical formulae have been encoded as MathML and are displayed in this HTML version using MathJax in order to improve their display. Uncheck the box to turn MathJax off. This feature requires Javascript. Click on a formula to zoom.
Abstract
Monitoring the subsidence at different periods in high underground water level coal mine areas can provide a data basis for land reclamation. For the purpose of monitoring subsidence in I working face located in Guotun Coal Mine, 22 Sentinel-1 images were processed by using differential interferometric synthetic aperture radar (D-InSAR). After dividing subsidence periods, the characteristics and monitoring accuracy at different subsidence periods were explored. The results showed that: (1) The formation of single-gradient subsidence funnel is an important sign to identify active period. (2) The root mean square error (RMSE) and mean absolute error (MAE) in central area of subsidence are reduced by 50% and 49%, respectively, compared with those in edge area. (3) The monitoring accuracy is high at different subsidence periods. The coefficient of determination (R2) can reach more than 0.89. Therefore, D-InSAR technique can accurately monitor the subsidence at different periods based on Sentinel-1 data.
1. Introduction
China is rich in coal resources and its production ranks among the highest in the world (Gao et al. Citation2017). Besides, 95% of its coal mines are located underground (Xia et al. Citation2018). Underground coal mining inevitably leads to surface subsidence, causing damage to infrastructure and cultivated land in mining area (Ishwar et al. Citation2017). The high underground water level coal mine areas mainly distributed in eastern China. After coal mining subsidence, the groundwater level rises above the ground elevation and waterlogging is formed on the ground which pose a great threat to people’s lives, property, and national food security (Bateson et al. Citation2015; Zhang et al. Citation2018). Coal mining subsidence is a dynamic process and can be divided into different periods obviously. (Yang et al. Citation2019). In the initial period, cracks appear on the surface. With the continuous advance of the working face, the ground surface gradually depressed. Under the continuous action of horizontal tensile stress, a waterlogged basin is eventually formed which is much larger than the extent of mining area (Wang et al. Citation2017). Therefore, Real-time monitoring of coal mining subsidence is important for preventing geological disasters, protecting residents’ properties and safeguarding national food security.
At present, some traditional methods have been extensively used in monitoring the subsidence, such as levelling, total station, and GPS (Psimoulis et al. Citation2018; Diao et al. Citation2022). Although these methods have the capable of obtaining the elevation of control points, they also have the disadvantages of limited monitoring range, high cost and low efficiency (Malinowska et al. Citation2018; Fan et al. Citation2021; Hou et al. Citation2022). In recent years, with the advantages of all-weather operation, high resolution and strong continuity, differential interferometric synthetic aperture radar (D-InSAR) has been widely used to obtain continuous surface deformation over large areas (Pepe and Calo Citation2017; Du et al. Citation2019; Zhu et al. Citation2019). It is particularly suitable for subsidence monitoring in coal mine areas because it can identify small surface deformation.
In many previous studies, scholars have used this technique to obtain information on deformation in different mining areas and have conducted studies on subsidence regulations in mining areas (Krawczyk and Grzybek Citation2018; Lu et al. Citation2019; Pawluszek-Filipiak and Borkowski Citation2020; Wang et al. Citation2021). Although related studies have been carried out, there are still relatively few studies focus on high underground water level coal mine areas. Besides, the subsidence characteristics and regulations of different subsidence periods are still unclear.
Considering the subsidence characteristics and regulation of different periods were not involved in previous researches, 22 Sentinel-1 images were processed by D-InSAR for monitoring the I working face in Guotun Coal Mine. The subsidence characteristics and regulation of different periods will be revealed, and the monitoring difference in central subsidence area and edge subsidence area also were analyzed. Above results can provide theoretical support for mastering the subsidence regulation and reclaiming subsidence land in high underground water level coal mine areas.
2. Materials and methods
2.1. Study area
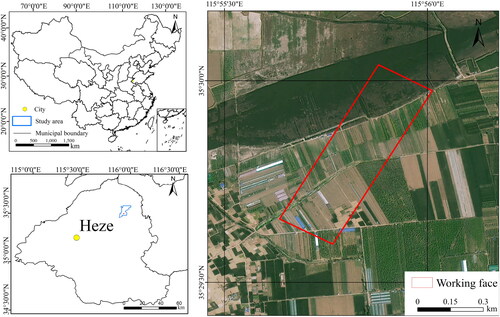
The study area was located in Guotun mining area, being the Coal Mine I working face of Juye Coalfield in Shandong Province of China, at 35°27′∼35°34′N and 115°50′∼116°0′E (). The surface of the mine field is mainly cultivated land, which is flat and densely populated. The Coal Mine I working face is struck from the northeast to the southwest, with a strike length of 800 m, a dip length of 203 m, a mining depth of 808 m, and coal seam thicknesses of 1.6 and 3.6 m, with an average thickness of 2.7 m. The working face was mined from northeast to southwest, and mining began in early November 2019 and stopped in early July 2020.
Figure 1. Location of the study area and working face.
2.2. Data collection and processing
2.2.1. SAR data preprocessing
The European Space Agency (ESA) Sentinel-1 satellite is equipped with a C-band synthetic aperture radar, which has large strip scanning coverage, moderate resolution and a short revisit period. Therefore, it is very suitable for monitoring deformation. 22 ascending orbit and VV polarization images from 6 November, 2019 to 15 July, 2020 were selected in this study. The incident angle of each image was about 38.94°, and the precision orbit file corresponding to each image was obtained to correct the orbit error. The specific parameters are shown in . The terrain phase error was also the main factor affecting the acquisition of deformation information. In order to remove the terrain phase error, the SRTM data jointly measured by NASA and the National Bureau of Surveying and Mapping of the Department of Defense (NIMA) were used (Benjamin et al. Citation2016). The spatial resolution of the data was 30 m.
Table 1. The specific parameters of 22 SAR images.
2.2.2. The process of D-InSAR
In this paper, the ‘dual-track method’ was used to process radar images obtained by D-InSAR. The principle is that radar images before and after deformation have undergone interference, and the final deformation phase is obtained after removing the influence of terrain factors using external DEM (Yang et al. Citation2010). Based on the baseline estimation of the 22 selected images, the range of absolute values of the normal baseline of each image was 5.81∼90.284 m, which is much less than one-third of the critical value of the normal baseline. Therefore, each image could be processed by D-InSAR. The main steps are as follows:
The master image and slave image were selected and registered in chronological order. Then, the 22 images formed 21 image pairs, and each combination underwent conjugate multiplication to form 21 interferograms. The interferograms contains phase information such as the deformation phase and the noise phase, Formula (1).
Each interferogram was processed using the Goldstein filter to remove the noise, and the MCF (minimum cost flow) method was used to unwrap the deformed phase with low coherence or difficulty in unfolding with limiting growth factors (Jiang Citation2011).
Settlements in the area are not affected by mining, PS-InSAR (Persistent Scatter InSAR) processing could be used to generate the GCP (ground control point). The PS point with a change rate of 0 was selected as a stable GCP, and external DEM was introduced to remove the terrain phase and ground phase error. In addition, in order to ensure the accuracy of each GCP after track refining, some of the larger errors were corrected and eliminated.
In the above formula,
and
is the flat phase, terrain phase, deformation phase, atmospheric phase and noise phase, respectively.
| 4. | The real deformation phase was obtained by further phase unwrapping of the MCF algorithm. The shape variable processed by D-InSAR was the shape variable in the LOS (line-of-sight) direction of the satellite, so it was necessary to convert the shape variable in the LOS direction into the vertical direction. The conversion formula is shown in Formula 2. | ||||
| 5. | After converting each period of D-InSAR data into vertical variables, the band math was used to accumulate multi-baselines, and the cumulative vertical variables of each period were obtained. | ||||
3. Results
3.1. Temporal and spatial evolution characteristics of the D-InSAR subsidence stage
According to a subsidence velocity of 1.7 mm/day, the subsidence process is divided into three period: initial period, active period and weakening period ().
Figure 2. The division of subsidence periods.
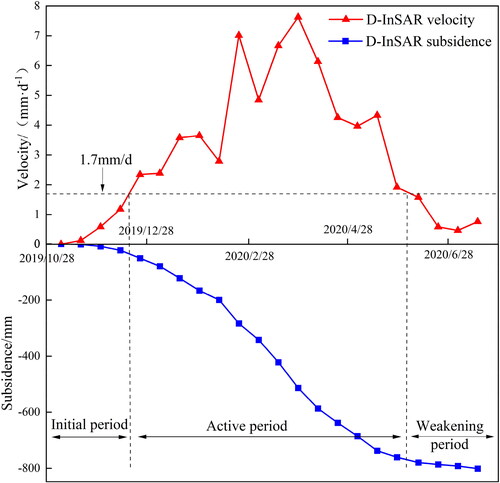
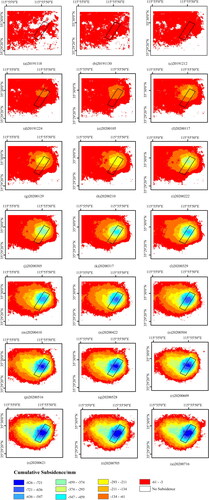
Based on the cumulative deformation results of D-InSAR, the subsidence characteristics in three periods were analyzed (). From 6 November, 2019 to 12 December, 2019 is categorized as the initial period. From 12 December, 2019 to 28 May, 2020 is the active period, and from 28 May, 2020 to 16 July, 2020 is the weakening period.
Figure 3. Temporal and spatial evolution characteristics of subsidence stage.
Initial period
It can be seen from that in the initial period of subsidence, along with the mining work at the working face, subsidence began to occur in the area. Since the initial mining intensity was low and the overlying rock layer was relatively intact, subsidence funnel had not yet occurred at the surface. The cumulative subsidence of ground surface was only 22 mm after calculation.
2. Active period
show that the Coal Mine I working face entered an active period. Significant subsidence was observed at the location of the open cut eye in the northeast part of the working face. With the increased of mining intensity, the central settlement of the mining area increased significantly and showed a trend of westward expansion. shows that with the continuous advancement of the working face, the central of the mining area continued to sink and moved to the southwest. Finally, a subsidence funnel was formed. On April 10, 2020, under the influence of mining disturbance at working face I, the subsidence of the southwest mining area was further deepened. The end of the active period is May 28, 2020. During this period, the cumulative subsidence of working face I was 715 mm, accounting for 89.3% of the maximum subsidence.
3. Weakening period
From , it can be seen that the subsidence of Coal Mine I working face entered the weakening period, and the extent of the subsidence basin was no longer expanded. Although the central of the mining area maintained a subsidence trend, the amount of subsidence was significantly reduced. The subsidence funnel was gradually expanded into a subsidence basin. In early July 2020, the overlying strata were no longer disturbed and the entire area tended to be saturated at the end of mining. Until July 15, the maximum cumulative subsidence of the working face reached 826 mm.
In summary, the characteristics of different subsidence period are summarized as follows:
Initial period: the cumulative subsidence is small and there is no significant changes on the ground.
Active period: the extent affected by subsidence continues expand, and the cumulative subsidence of the center mining area increases significantly. A subsidence funnel gradually forms on the ground. Therefore, the subsidence funnel is an important sign that the working face enters the active period.
Weakening period: The subsidence rate gradually decreases. Finally, the subsidence funnel was gradually expanded into a subsidence basin.
3.2. Monitoring accuracy analysis of subsidence
According to the theory of inflection point demarcation line, the subsidence area is divided into the central area and the edge area. The area where the cumulative subsidence is greater than or equal to 413 mm is the central area, and the area where the cumulative subsidence is less than 413 mm and greater than 0 mm is the edge area.
3.2.1. Analysis of the monitoring accuracy in different subsidence areas
There are two observation lines on the surface of the working face, in which the strike line and dip line are, respectively, composed of 48 and 49 levelling points, which were marked as points Z1 ∼ Z48 and points H1 ∼ H49 (). In order to explore the accuracy of D-InSAR for monitoring the subsidence of working face I, the elevation change values of 99 level points were compared with the subsidence data obtained by D-InSAR. The monitoring accuracy was evaluated using some indicators including the maximum absolute error (MAX-AE), minimum absolute error (MIN-AE), mean absolute error (MAE), root-mean-square error (RMSE) and absolute error of the maximum settlement point (MASPAE) ().
Figure 4. Error distribution in different subsidence area.
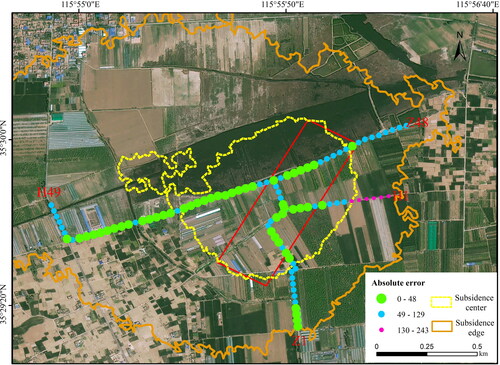
Table 2. The error statistics of D-InSAR monitoring results.
There was a great difference in monitoring accuracy between the central subsidence area and the edge subsidence area. In edge area, although the MAX-AE of some strike and dip monitoring points were 201 and 243 mm and the RMSE is 120 and 103 mm, the MAE of some points could be kept within 0 ∼ 10 mm. In center area, the MIN-AE of D-InSAR and levelling monitoring data could be kept within 1 mm, overall difference was small. The MAE was also 48 mm and 38 mm respectively, which were reduced by one-half that in edge area. In addition, the monitoring accuracy of MASPAE was high. The monitoring accuracy in western region was higher than that in the eastern part of the working face from spatial distribution. Generally speaking, the monitoring accuracy of D-InSAR for central subsidence area was higher than that for the subsidence edge area, and the monitoring accuracy for the dip was higher than that for the strike.
3.2.2. Analysis of the monitoring accuracy in different subsidence stages
For some areas with insignificant subsidence, since the requirements of period division are not satisfied, for these areas, based on the cumulative subsidence at the maximum subsidence point, and the same division is made into initial, active and declining phases. In order to explore the monitoring accuracy of the initial, active and weakening periods in the central area and edge area, 12 levelling points were selected in each region. Then, the monitoring accuracy of D-InSAR for each subsidence period was analyzed ().
Figure 5. Error distribution in subsidence central area.
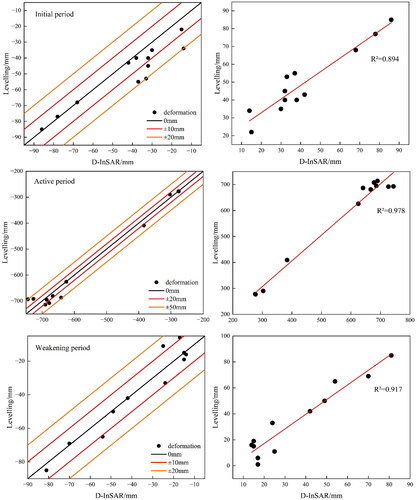
As can be seen from , in the central subsidence area, except for some points, there were significant differences in the amount of subsidence obtained by D-InSAR and level survey in all three periods, respectively. The subsidence of the initial and weakening period was relatively small, and the absolute error range of the monitoring was kept between 0 and 20 mm, while the absolute error of the active period was within the range 0 ∼ 50 mm. Compared to the initial period, the active period and weakening period were well-distributed. In addition, through Person correlation analysis of the subsidence of the three periods of the D-InSAR and levelling monitoring data (), the monitoring accuracy of D-InSAR in the active period of subsidence was the highest in the central, R2 reached 0.978. Nevertheless, the R2 of the initial and weakening periods was 0.894 and 0.917, respectively.
Figure 6. Error distribution in subsidence edge area.
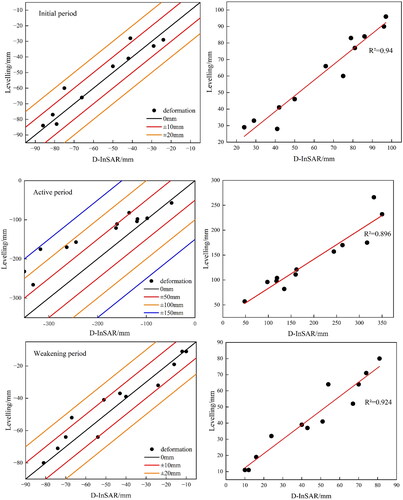
Table 3. The subsidence of periods in central area.
Compared to central area, the subsidence in initial and active periods increased in edge area (), but the range of monitoring error still maintain between 0 and 20 mm. The subsidence of the active period reduced clearly, and the range of monitoring error expanded to 0 ∼ 150 mm, whose distribution was more discrete. It can be seen from that R2of the initial and weakening periods of D-InSAR and levelling monitoring data were 0.94 and 0.924, respectively. The R2 of active period was 0.896, which still maintain a high accuracy.
Table 4. The subsidence of stage in edge area.
In subsidence center area, the monitoring accuracy of different periods were high. Compared to edge area, the monitoring accuracy in active period improved 9.1%. The monitoring accuracy was also high in the subsidence edge area. R2 of initial period and weakening period was increased, both of which were improved 5.1% and 0.7%.
4. Discussion
4.1. Characteristic of consistent analysis in different subsidence stages
The results of this study suggest that the subsidence funnel is an important sign for the active period, and it is not completely formed until the middle and later periods of active. This conclusion is a further extension and expansion of Chen et al.’s (Citation2020) and other research results. Considering the temporal and spatial evolution characteristics of subsidence, the subsidence center of the working face continued to move from the open cut eye to the mining area center, and the same conclusion has been obtained in the related research (Jessica Citation2020). In the later period of mining, the influence of the rock strata was gradually weakened due to disruption and the active settlement tended to be saturated. As a result, the mining center continues to sink (Wang et al. Citation2017). This is the main reason for the expansion of the maximum subsidence center. This conclusion has been also confirmed by relevant monitoring results (Ma and Sui Citation2020).
4.2. Influencing factors of monitoring accuracy in different subsidence areas
Many factors could affect the monitoring accuracy of D-InSAR. In this paper, many error factors were removed during data processing, then the monitoring accuracy was improved. It is concluded that the monitoring accuracy of D-InSAR in some areas can be maintained at ±10 mm, which means the monitoring accuracy is high. It has been found that the accuracy in strike monitoring lines is higher than that of inclination monitoring lines (Chen et al. Citation2021). Due to a large amount of subsidence within a short time in the northern open cut eye, the subsidence exceeded the deformation gradient detected by the radar band (Jiang et al. Citation2011). Thus, the subsidence information could not be extracted effectively. Although some studies have pointed out that the monitoring accuracy of D-InSAR in the central subsidence area was usually worse than that in the edge subsidence area, the opposite trend was obtained in our study (Tao et al. Citation2021). The main reason is that the selected Sentinel-1 images were denser and the time baseline was shorter (). The influence of the time loss correlation was smaller, and the extraction effect of the subsidence information in each period was better. Hence, the monitoring accuracy of the central subsidence area was improved (Ilieva et al. Citation2019). In addition to the central subsidence area, the farmland of the eastern edge subsidence area is the main reason why the monitoring accuracy of the western edge subsidence area was higher than that in eastern area. There was a large area of vegetation cover in the eastern area except in winter and spring, and the existence of vegetation resulted in the radar waves were reflected, the subsidence information could not be accurately identified (Wang et al. Citation2022). In eastern subsidence edge area, the vegetation coverage was low. Besides this, the land types mainly included bare land and construction land, and the noise impact is small. Therefore, D-InSAR could better identify the subsidence in eastern subsidence edge area (Li et al. Citation2021).
4.3. Influencing factors of monitoring accuracy in different subsidence stages
Only C-band Sentinel-1 radar satellite images were used in this study. The resolution of the radar satellite is moderate, and it can effectively identify the subsidence in initial and weakening periods. A lot of efforts should be made to improve their accuracy. In addition, due to the short band of the sensor, large gradient deformation cannot be recognized (Ma et al. Citation2016). Large subsidence usually happed in active period, which is an important reason for the poor monitoring accuracy in active period. Related studies have proved that L-band and X-band radar sensor satellites can identify large gradient deformation, and through using high-resolution radar satellite images. The method of combined ascension with descension can also effectively improve the subsidence monitoring accuracy (Przyłucka et al. Citation2015; Du et al. Citation2016; Ng et al. Citation2017). The related methods will be carried out practice in future research.
5. Conclusion
Taking the I working face of the Guotun mining area in southwestern Shandong Province as an example, this paper analyzed the characteristics and accuracy of different subsidence periods based on D-InSAR. The results indicated that:
The spatial and temporal evolution characteristics of different subsidence periods are more obvious. Especially, based on the Jenks division of subsidence gradients, the development of single-gradient subsidence funnels can be used as a sign that the working face have entered active period.
Different subsidence areas are better monitored but difference. The MAE and of central area were 48 mm and 38 mm separately, which improved 55.14% and 49.3% compared to edge area. The RMSE of central area also reduced, the monitoring accuracy enhanced 54.16% and 50.48% separately. It was found that the monitoring accuracy for dip line was better than strike line wherever central and margin.
The monitoring accuracies of different subsidence periods was high. The R2of different periods in the subsidence central area reaches 0.894, 0.978 and 0.917.In edge area, the R2 of different periods reaches 0.94, 0.896 and 0.924.
Above conclusion indicating that D-InSAR can effectively identify the variation of each subsidence period, achieving real-time and high-accuracy monitoring, which has important application value for the prevention of geological disasters and ecological restoration of mining areas.
Author contributions
Conceptualization: X. J. and X.M.; Methodology: X.M., X.L. and X.H.; Formal analysis and in-vestigation: X.J. and T.Y.; Writing - original draft preparation: X. J. and X.M.; Writing - review and editing: X. J., T.Y., X.H and X.L.; Funding acquisition: X.H and X.L.; Resources: X.M. and X.L.; Supervision: X.H and X.L. All authors read and approved the final manuscript.
Acknowledgements
Thanks to the Sentinel-1A image and satellite precise orbit data provided by ESA, SRTM DEM data provided by NASA and Guotun coal mine Levelling data.
Disclosure statement
No potential conflict of interest was reported by the authors.
Additional information
Funding
References
- Bateson L, Cigna F, Boon D, Sowter A. 2015. The application of the Intermittent SBAS (ISBAS) InSAR method to the South Wales Coalfield, UK. Int. J Appl Earth Obs. 34:249–257.
- Benjamin P, Marc M, Philippe P, Pierrick H, Joao BD. 2016. Development and validation of a new efficient SRTM DEM-based horizon model combined with optimization and error prediction methods. Sol Energy. 129:101–115.
- Chen Y, Tao QX, Hou AY, Ding LJ, Liu GL, Wang K. 2020. Accuracy verification and evaluation of Sentinel-1A repeat track differential interferometric synthetic aperture radar in monitoring mining subsidence. J Appl Rem Sens. 14(01):1.
- Chen Y, Yu SW, Tao QX, Liu GL, Wang LY, Wang FY. 2021. Accuracy verification and correction of D-InSAR and SBAS-InSAR in monitoring mining surface subsidence. Remote Sens. 13(21):4365.
- Diao X, Sun Q, Yang J, Wu K, Lu X. 2022. A novel deformation extraction approach for sub-band insar and its application in large-scale surface mining subsidence monitoring. Sustainability. 15(1):354.
- Du Z, Ge LL, Li X, Ng AHM. 2016. Subsidence monitoring over the Southern Coalfield, Australia using both L-Band and C-Band SAR time series analysis. Remote Sens. 8(7):543.
- Du S, Wang Y, Zheng M, Zhou D, Xia Y. 2019. Goaf locating based on InSAR and probability integration method. Remote Sens. 11(7):812.
- Fan H, Lian X, Yang W, Ge L, Hu H, Du Z. 2021. Mining large-gradient subsidence monitoring using D-InSAR optimized by GNSS. Imaging Sci J. 69(1-4):207–218.
- Gao YB, Liu DQ, Zhang XY, He M. 2017. Analysis and optimization of entry stability in underground longwall mining. Sustainability. 9(11):2079.
- Hou Z, Yang K, Li Y, Gao W, Wang S, Ding XM, Li YX. 2022. Dynamic prediction model of mining subsidence combined with D-InSAR technical parameter inversion. Environ Earth Sci. 81(11):307.
- Ilieva M, Polanin P, Borkowski A, Gruchlik P, Smolak K, Kowalski A, Rohm W. 2019. Mining deformation life cycle in the light of InSAR and deformation models. Remote Sens. 11(7):745.
- Ishwar SG, Kumar D, Kumar KM. 2017. Mine surface subsidence monitoring due to impacts of underground mining using persistent scatterer interferometry. Imaging Sci J. 65(3):151–161.
- Jessica MW. 2020. Application of DInSAR for short period monitoring of initial subsidence due to longwall mining in the mountain west United States. Int J Min Sci Technol. 30(1):33–37.
- Jiang TC. 2011. Ameliorative minimum cost flow algorithm for phase unwrapping. Procedia Environ Sci. 10:2560–2566.
- Jiang M, Li ZW, Ding XL, Zhu JJ, Feng GC. 2011. Modeling minimum and maximum detectable deformation gradients of interferometric SAR measurements. Int J Appl Earth Obs. 13(5):766–777.
- Krawczyk A, Grzybek R. 2018. An evaluation of processing InSAR Sentinel-1A/B data for correlation of mining subsidence with mining induced tremors in the Upper Silesian Coal Basin Poland. E3S Web Conf. 26:00003.
- Li TT, Zhang HZ, Fan HD, Zheng CL, Liu JL. 2021. Position inversion of goafs in deep coal seams based on DS-InSAR data and the probability integral methods. Remote Sens. 13(15):2898.
- Lu L, Fan H, Liu J, Liu JL, Yin JF. 2019. Time series mining subsidence monitoring with temporarily coherent points interferometry synthetic aperture radar: a case study in Peixian, China. Environ Earth Sci. 78(15):461.
- Ma C, Cheng XG, Yang YL, Zhang XK, Guo ZZ, Zou YF. 2016. Investigation on mining subsidence based on multi-temporal InSAR and time-series analysis of the small baseline subset—case study of working faces 22201-1/2 in Bu’ertai mine, Shendong Coalfield, China. Remote Sens. 8(11):951.
- Malinowska AA, Witkowski TT, Guz A, Hejmanowski R. 2018. Mapping ground movements caused by mining-induced earthquakes using sentinel-1 TOPS Time Series Interferometry. Eng. Geol. 246:402–411.
- Ma F, Sui LC. 2020. Investigation on mining subsidence based on Sentinel-1A data by SBAS-InSAR technology—case study of Ningdong Coalfield, China. Earth Sci Res J. 24(3):373–386.
- Ng AHM, Ge LL, Du Z, Wang SR, Ma C. 2017. Satellite radar interferometry for monitoring subsidence induced by longwall mining activity using Radarsat-2, Sentinel-1 and ALOS-2 data. Int J Appl Earth Obs. 61:92–103.
- Pawluszek-Filipiak K, Borkowski A. 2020. Integration of DInSAR and SBAS techniques to determine mining-related deformations using sentinel-1 data: the case study of Rydułtowy mine in Poland. Remote Sens. 12(2):242.
- Pepe A, Calo F. 2017. A review of interferometric synthetic aperture RADAR (InSAR) multi-track approaches for the retrieval of earth’s surface displacements. Appl Sci. 7(12):1264.
- Przyłucka M, Herrera G, Graniczny M, Colombo D, Bejar-Pizarro M. 2015. Combination of conventional and advanced DInSAR to monitor very fast mining subsidence with TerraSAR-X Data: Bytom City (Poland). Remote Sens. 7(5):5300–5328.
- Psimoulis PA, Houlié N, Habboub M, Michel C, Rothacher M. 2018. Detection of ground motions using high-rate GPS time-series. Geophys J Int. 214(2):1237–1251.
- Tao QX, Wang FY, Guo ZJ, Hu L, Chen Y, Liu TW. 2021. Accuracy verification and evaluation of small baseline subset (SBAS) interferometric synthetic aperture radar (InSAR) for monitoring mining subsidence. Eur J Remote Sens. 54(1):642–663.
- Wang SF, Li XB, Wang SY. 2017. Separation and fracturing in overlying strata disturbed by longwall mining in a mineral deposit seam. Eng. Geol. 226:257–266.
- Wang L, Teng CQ, Jiang K, Jiang C, Zhu SJ. 2022. D-InSAR monitoring method of mining subsidence based on Boltzmann and its application in building mining damage assessment. KSCE J Civ Eng. 26(1):353–370.
- Wang ZY, Zhang JZ, Yu YR, Liu J, Liu W, Jiang N, Guo D. 2021. Monitoring, analyzing, and modeling for single subsidence basin in coal mining areas based on SAR interferometry with L-band data. Sci Program. 2021:1–10.
- Xia Y, Wang Y, Du S, Liu X, Zhou H. 2018. Integration of D-InSAR and GIS technology for identifying illegal underground mining in Yangquan district, Shanxi province, China. Environ Earth Sci. 77(8):15–19.
- Yang XL, Wen GC, Dai LC, Sun HT, Li XL. 2019. Ground subsidence and surface cracks evolution from shallow-buried close-distance multi-seam mining: a case study in Bulianta coal mine. Rock Mech Rock Eng. 52(8):2835–2852.
- Yang CS, Zhang Q, Zhao CY, Ji LY, Zhu W. 2010. Monitoring mine collapse by D-InSAR. Int J Min Sci Techno. 20(5):696–700.
- Zhang A, Lu J, Kim JW. 2018. Detecting mining-induced ground deformation and associated hazards using spaceborne InSAR techniques. Geomat Nat Haz Risk. 9(1):211–223.
- Zhu JJ, Yang ZF, Li ZW. 2019. Recent progress in retrieving and predicting mining-induced 3D displace-ments using InSAR. Acta Geod Geophys. 48:135–144.