
 ?Mathematical formulae have been encoded as MathML and are displayed in this HTML version using MathJax in order to improve their display. Uncheck the box to turn MathJax off. This feature requires Javascript. Click on a formula to zoom.
Abstract
Predicting future urban land-use scenarios and assessing their encroachment on ecological land is important for sustainability policy formulation. This study develops a new Futureland model using cellular automata with user-defined transformation rules, graphical neighborhood configuration and matrixed transformation cost to simulate multiple land-use changes. Compared with existing models, Futureland applies different factors to different land-use types in a single simulation experiment. Futureland was developed using Geospatial Data Abstraction Library and parallel computing, which significantly improve the implementation efficiency. The case study of Shanghai 2010–2020 illustrates an overall accuracy of 86.6% and a Kappa simulation of 0.79. The land-use scenarios for 2020–2035 were projected under greenspace planning constraints using Futureland. The results indicate that Shanghai’s urban sprawl will gradually slow down by 2030, and the increased urban areas will be mainly in the urban fringes and suburban regions. Futureland can help decision-makers to manage future land-use and optimize urban planning policies.
1. Introduction
Widespread land-use and land cover change and the attendant side effects pose challenges to sustainable urban development globally (Nagendra et al. Citation2018). It is estimated that by 2030, urban land will reach about 1.2 million km2, almost three times the size of the world’s urban land area in 2000 (Seto et al. Citation2012). Urbanization is a major feature of land-use change, especially in rapidly developing areas (Li et al. Citation2022), which has resulted in a continuous decline in farmland and greenspace, thus underlying degradation of urban ecosystems and environments (Güneralp and Seto Citation2013; Nor et al. Citation2017). Among many land-use types, urban greenspace is a typical ecological land type and an essential part of the ecosystems, which is important for maintaining sustainable urban development and ecological health (Jennings et al. Citation2016). In the context of the implementation of the urban master planning, the impact on ecological space is an important concern for future urban development (Wu et al. Citation2019). Therefore, spatially projecting urban land-use scenarios and their impacts on ecological space is crucial for spatial planning and harmonious urban development.
Spatial simulation approaches of urban sprawl and land-use change are typically constructed through cellular automata (CA) models, agent-based models and hydrology-driven models in geographical information systems. Among these, agent-based models have been used to simulate land use changes by considering authorities, developers and buyers as different agents and taking into account their different decision processes (Valbuena et al. Citation2010). In specific studies, hydrology-driven models have also been used to study the complex interactions between land-use and hydrological processes (e.g. variable infiltration capacity, and soil and water assessment tools). For example, such models have been employed to simulate agricultural land-use change in different scenarios (Srivastava et al. Citation2020). In contrast to these models, CA is a self-organizing spatial modeling framework that has been widely adopted to simulate land-use change, especially in rapidly urbanizing areas (Feng and Tong Citation2018; Liang et al. Citation2018a).
Commonly applied CA models and software include CA-Markov, CLUE-S, SLEUTH, FLUS, and UrbanCA (Halmy et al. Citation2015; Feng and Tong Citation2020; Wang et al. Citation2022), to name a few, the last of which provides many new methods for the retrieval of transformation rules and has been applied worldwide. In CA models, statistical regression, neural networks, deep learning, machine learning and heuristic optimization have been proposed to retrieve their transformation rules. In fact, Logistic regression (LR) is the classical method for retrieving transformation rules (Li et al. Citation2014; Shahbazian et al. Citation2019), and many consider LR an inaccurate method (Mustafa et al. Citation2018), while others consider LR a stable method and are constantly working to improve it (Feng Citation2017; Mirbagheri and Alimohammadi Citation2017). Even though LR has its limitations in some applications, with improvements it can be more useful and has great application value.
At the driving force aspect, it is widely recognized that land-use change is influenced by a variety of factors, including human disturbance, socioeconomic elements, and physical elements (Chen et al. Citation2020b). Also, land-use has a significant impact on urban sprawl due to changes in the physical characteristics of the ground surface, soil and vegetation (Srivastava et al. Citation2020; Wei et al. Citation2021). For the spatial simulation of multiple land-use, most CA models use the same influencing factors for different land-use types (Firozjaei et al. Citation2019). In terms of land-use dynamics, the influencing factors of one type are different from those of another one; therefore, when constructing the CA transformation rules, the statistical significance of each factor for different types should be tested to determine which factors influence each type. This requires modifying and refining the standard LR or proposing new approaches that can accept different combinations of factors for each land-use type. Thus, it is essential to remove unnecessary factors to reduce the multicollinearity for improving the simulation accuracy (Feng and Tong Citation2017).
At the computational efficiency aspect, CA models require iterative computation of each pixel, especially for large-scale, high-precision simulations, and it requires computational acceleration to achieve better performance. The computational load of CA models is largely influenced by the massive spatial datasets and the CA's complexities. However, it is very difficult to achieve rapid implementation when using sequential computation to simulate land-use change (Zhuang et al. Citation2022). In recent years, modelers have proposed various methods to improve the operational efficiency of CA tools. For example, graphical processing units (GPUs) can improve the efficiency of CA models in a lower computational cost and higher computational power (Li et al. Citation2012). CA models with integrated multiple GPUs and central processing units (CPUs) can also simulate urban sprawl with massive spatial data, providing more memory and threads to process the data compared to a single GPU (Guan et al. Citation2016). Meta-modeling approaches have also been proposed to reduce model iterations and achieve stable sensitivity estimates (Şalap-Ayça et al. Citation2018). Parallel computing is another preferred method that distributes tasks to multiple subtasks under a multi-threaded CPU to achieve simultaneous computation (Newland et al. Citation2018). This does not rely on the powerful hardware of the computer and has a great potential to scale up in building more efficient CA models.
At the application aspect, CA models are constantly improved and applied to more accurately simulate the spatiotemporal characteristics of complex urban systems and evaluate their impacts on the environment. Using various CA models, land-use change and its impact on ecosystems and the environment can be simulated spatially (Jennings et al. Citation2012). For example, by integrating CA and regional planning, a future land-use simulation (FLUS) model has been proposed to delineate urban sprawl boundaries and their impacts on the environment (Liang et al. Citation2018b). In addition, many others have examined the impacts of land-use change on prime farmland, urban greenspace, landscape patterns, and the loss of ecosystem service values (Al-Sharif and Pradhan Citation2015; Chen et al. Citation2020a; Gomes et al. Citation2021). Urban planning policies and greening plans have been developed at different levels (e.g. national and city) to improve habitat quality and significantly increase green coverage (Kanniah Citation2017). It is known that there are deviations between urban greening planning and practical implementation (Tong and Feng Citation2019), hence it is necessary to analyze the ecological impacts of future land-use change to help decision-makers undertake a risk assessment and ecological planning. However, the modeling of ecological impacts of future land-use scenarios from existing studies is still limited in considering issued planning, especially in megacities where urban quality is highly appreciated.
The objective of this study is to develop a new CA model of land-use change to address the following questions: (1) Whether different combinations of influencing factors can be used for different land-use types when constructing CA models to simulate land-use change more accurately?, (2) How can parallel computing be incorporated into CA models to improve their computational efficiency?, and (3) How to accurately assess the spatial impact of future urban sprawl on ecological land considering the practical planning? To answer these questions, we developed a new Futureland model based on CA, the Geospatial Data Abstraction Library (GDAL), and parallel computing. Futureland extends the conventional CA methodology by allowing developers to produce their own transformation rules that can be used for simulations and projections of land-use worldwide. To test the model and software, we chose Shanghai as a case study area to project its land-use scenarios. Based on the scenarios, we evaluated the impact of Shanghai’s urban sprawl on ecological space, which would contribute to the optimization of urban greenspace planning and sustainable urban development.
2. Methods: the Futureland model
2.1. The Futureland simulation model
2.1.1. Total transformation rules
The developed Futureland model consists of four core elements including the probability-of-occurrence, neighborhood effects, transformation costs, and constraints. The total transformation rules can be given by:
(1)
(1)
where
is the total probability for a cell to change from one state to another;
is the probability-of-occurrence defined by influencing factors;
is the effect of neighboring cells at iteration time t;
is the transformation cost to from type-c to type-p;
is the local constraints;
is the edge enhancement factor, an optional element.
2.1.2. Probability-of-occurrence estimation
The estimation of the probability-of-occurrence is of great importance because it reflects the dynamics of land-use. Among many methods used to derive the transformation rules, LR has been applied for three decades and is very stable in many cases worldwide (Siddiqui et al. Citation2018). Although machine learning methods have been increasingly combined with CA models in recent years, variants of LR-based CA models continue to emerge (Lin et al. Citation2011). In this study, we proposed the generalized LR (GLR) to estimate the probability-of-occurrence, where different land types are influenced by the same or different factors for the land-use simulation of the same area. The GLR method can be given by:
(2)
(2)
where Pcon,r is the probability-of-occurrence of land-use type r; n is the number of factors; Xi is the ith factor; β0 is a constant; βi is the regression coefficient of factor Xi. The coefficient reflects the influencing degree of a factor on land-use change. To represent the GLR’s generalization, we introduced a parameter λi in the regression, where λi=0 means that factor Xi is included; otherwise, the factor is excluded.
GLR statistics in Futureland include factor weight estimates, standard deviations, z-values, and p-values. Depending on p-values, our Futureland model can select different influencing factors for different land-use types, thus improving the predictive ability of the CA model.
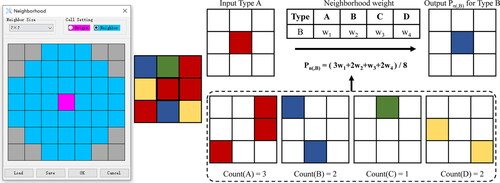
2.1.3. Neighborhood effects
Neighborhood influences the state transformation direction of the central cell, but many CA studies do not sufficiently consider the weights of different types of neighbors (Hamad et al. Citation2018). The weights represent the ability of each land-use type in the neighborhood to influence the central cell. The weight ranges from 0 to 1, where 0 indicates no influence and 1 indicates the strongest influence. In this study, the neighborhood weight matrix can be given by:
(3)
(3)
where
is the neighborhood weight of land-use type j on central cell of land-use type i. Thus, for land-use type u, the final neighborhood effects of the central cell h can be given by:
(4)
(4)
where
is the neighborhood size;
is the total neighborhood effects on the central cell. shows how to define the neighborhood weights and calculate the consequent neighborhood effects.
Figure 1. The neighborhood shape definition tool, and a case of defining the neighborhood weights and effects. For example, for land-use transition to type B, the weights for types A, B, C and D are w1, w2, w3, and w4, respectively. In a 3 × 3 square neighborhood, the total effects for type B are (3w1+3w2+w3+2w4)/8.
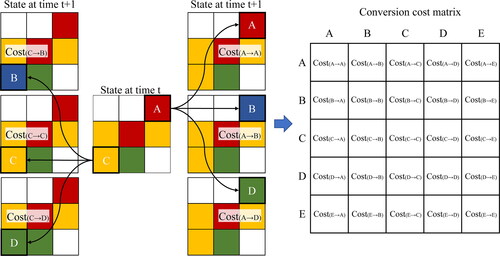
2.1.4. The transformation cost
The transformation of one land-use type to another is associated with socioeconomic costs (Verburg and Overmars Citation2009). In CA-based land-use change modeling, the transformation cost matrix is defined based on the context, land attributes, and socioeconomic conditions of the study area. The transformation cost () in Equ.(1) can be given by:
#(5)
#(5)
where CC is the cost that ranges from 0 to 1, with a lower cost indicating a higher likelihood of transformation. shows the definition of the transformation cost matrix, where Cost(A→B) donates the transformation cost from the current (t) land-use type A to the next (t + 1) possible land-use type B.
Figure 2. The definition of the transformation cost between any two land-use types.
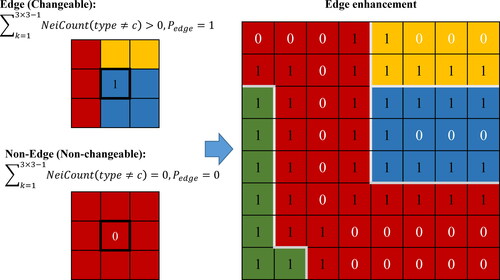
2.1.5. The edge enhancement
In Futureland, we identified the edge position to enhance the edge shape of each land patch. shows that a pixel can be changeable if its surrounding pixels are of a different type (=1); otherwise, a pixel can be non-changeable if its surrounding pixels are of the same type (
=0). This approach keeps land-use patterns well-marginalized, with better differentiation between different land-use types. The edge enhancement is typically applicable to areas where urban planning regulations are strictly enforced (e.g. Shanghai).
Figure 3. The processing of edge enhancement in the Futureland model.
2.1.6. The roulette selection
The selection of the target land-use type to be transferred is the final step in CA modeling. In the literature, many have chosen the type with the highest transformation probability as the target, but this denies the transformation possibility of cells with a lower probability. In our Futureland model, we applied the roulette-wheel approach commonly used in genetic algorithms to model the complex relationship of probabilistic choices (Lipowski and Lipowska Citation2012). The application of this method in geographic modeling has shown that it is effective and can yield better simulation results (Liu et al. Citation2017). In roulette-wheel selection, the land-use type with the highest transformation probability is most likely to be assigned as the target, but types with low probability also have a chance. For example, if the total probability of a pixel transforming from farmland to urban is 0.9, and the total probability to the water body is 0.2; in the conventional CA models, because the probability to urban is greater, the result is that the pixel transforms to urban; in our model, however, the possibility to urban is 90% and the possibility to water body is 20%. As the roulette-wheel selection incorporates stochastic parameters, it can well reflect the uncertainty of land-use dynamics and real-world land-use alternatives, and can better integrate the competition among different land-use types.
2.2. Global and local constraints
2.2.1. The modified Markov chain
The total amount of land demand for each type is a global constraint for future scenarios. The number of iterations is assigned according to the final land state to match the land demand. The standard Markov chain is a stochastic process in which time and state are discrete, and it evolves the future state of random variables through a transformation probability matrix (Mansour et al. Citation2020). In this study, a modified Markov chain that considers the probability-of-occurrence was used to project the total future land demand. The urban sprawl process conforms to an S-shaped curve, i.e. the urban sprawl rate slows down in the later urbanization stages (Mesta et al. Citation2022), we thus added a factor to the standard Markov chain to reduce the rate. The land demand based on the modified Markov chain can be given by:
(5)
(5)
where
and
are the land quantities at time t and time t + 1, respectively;
is the land transformation probability matrix at time t;
satisfies the requirement of 0 ≤
≤ 1; the sum of elements in each line is equal to 1;
is an adjustment factor based on the probability-of-occurrence vector.
2.2.2. Restricted areas
The restricted areas are local constraints that do not change during the land-use simulation. The constraint term Res has a value of 0 or 1, where 0 means available and 1 means unavailable. The restricted areas typically include water bodies, nature reserves, and reserved areas in urban planning. By using the restriction layer, the simulation results can be made more consistent with the actual situation.
2.3. Simulation assessment
Futureland includes an accuracy assessment tool that uses an error matrix to measure how well the simulated land-use pattern matches the real land-use pattern. The error matrix shows the number of correctly and incorrectly simulated pixels associated with each land-use type. A few accuracy metrics were applied to evaluate the model and results, which typically include overall accuracy, producer’s accuracy, user’s accuracy, and Kappa simulation. We also applied fuzzy Kappa and aggregated cells to measure similarities and differences in land-use simulations ().
Table 1. The definition of assessment metrics of CA models and results.
3. Materials and model framework
3.1. Study area and datasets
Shanghai located in eastern China is the most developed city of the country with an area of 6,340 km2. As of 2021, the total population has reached 24.8 million, of which 89.3% were urban residents and only 10.7% were rural residents. On the one hand, urban sprawl affects urban population flows, e.g. the construction of rail transit in a region can attract people to live there; on the other hand, population flows also promote urban sprawl, e.g. population growth also drives the construction of infrastructure. Over the past decade, Shanghai’s rapid urban sprawl (from 87,327 ha in 2010 to 141,207 ha in 2020) has led to dramatic land-use change and encroachment on various ecological lands. Given the scarcity of ecological space, Shanghai has proposed to build a sound system of three major ecological lands including parks, forests, wetlands and two major networks of corridors and greenways, aiming to create the four types of ecological space () raised in the Shanghai Urban Master Plan (2017–2035).
Figure 4. The study area of Shanghai: (a) Ecological spatial plan (2017–2035); (b) Land-use pattern in 2010.
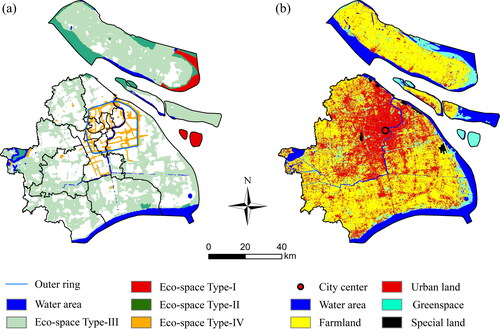
shows the ecological spatial plan and land-use pattern in 2010, where Eco-space Type-I and Type-II are of significant ecological functions (e.g. wetland nature reserves and the core areas of forest parks), and development is prohibited to maintain ecological functions. The Eco-space Type-III refers to the ecological space outside the urban boundary, including basic farmland, forest land and ecological corridors, to name a few. Eco-space Type-IV indicates ecological space within the urban boundary, such as green belts of the Outer Ring Highway and suburban parks.
In this study, we used Landsat-5 TM and Landsat-8 OLI level-2 images, and performed radiometric and geometrical corrections. These images then have been applied to produce land-use maps for 2010, 2015, and 2020, using the supervised neural network approach in ENVI 5.3. Five land-use categories were considered according to the classification criteria developed by the Chinese Academy of Sciences (CAS; ). We applied a systematic sampling method to select 52,503 pixels, of which 70% were used to calibrate the classifier and 30% for validation, with an overall accuracy higher than 95.7%; then, we selected 17,418 pixels to calibrate the Futureland model. The land-use patterns show that urban land accounted for 24.9% in 2010, while water area, greenspace, farmland and special land respectively accounted for 13.9%, 10.1%, 50.6% and 0.5%.
Table 2. Land-use classification criteria and definitions in the Shanghai study area.
Table 3. Remote sensing images and geographical information data used in this study.
3.2. Modeling procedure based on Futureland
We developed a new software package (i.e. Futureland) for modeling and projecting complex land-use change based on user-defined transformation rules and parallel computing. shows the overall process of Futureland, which has several functional advantages including: (1) adopting parallel computing based on data blocks, which greatly accelerates the CA modeling process and the speed is related to the CPU threads of the modeler’s computer; (2) accepting user-defined CA transformation rules developed using the R language; (3) providing format conversion, image classification and data normalization tools to prepare the input layers; (4) independently specifying the central cell, the neighborhood shape, and the weight of each neighborhood cell to facilitate the definition of special neighborhoods; (5) allowing users to define transformation costs for different types of land-use transformations based on socio-economic conditions and land-use policies; (6) allowing for edge enhancement of land-use patches to reinforce the boundaries of different land-use types. The software is freely available (www.researchgate.net/publication/356978377) for international users to build their models.
Figure 5. Futureland for complex land-use change simulation and future scenario projections.
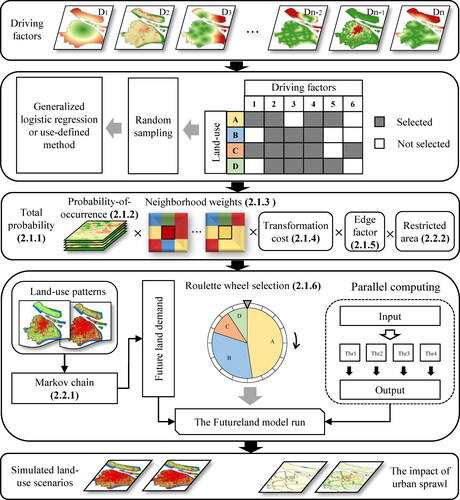
Figure 6. The probability-of-occurrence maps for the five land-use types in Shanghai.
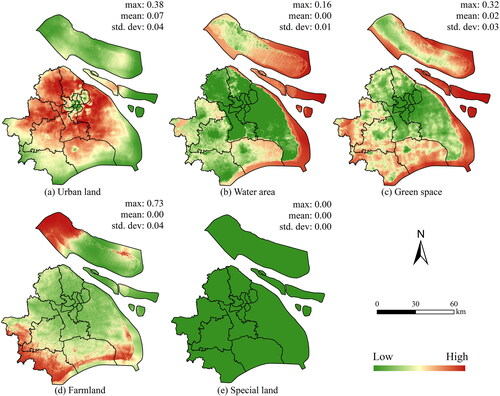
Figure 7. The simulated land-use patterns for 2015 and 2020 in comparison to the actual patterns.
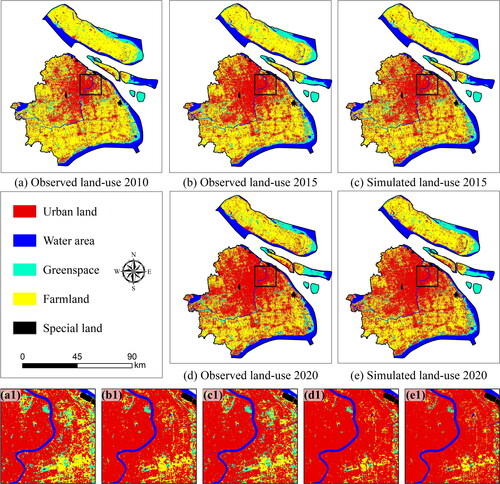
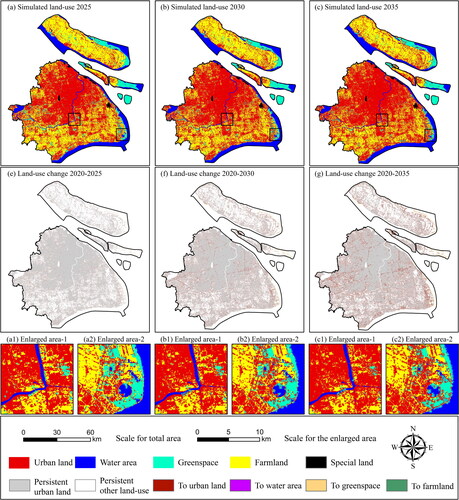
Figure 8. Future land-use scenarios of Shanghai in 2025 to 2035 projected using Futureland.
4. Results
4.1. Probability-of-occurrence
We identified the best combination of factors using GLR and calculated the CA coefficients to generate the probability-of-occurrence maps. shows the final factors and their coefficients for each land-use type, where most factors are related to urban land, indicating the complexity of urban sprawl. Of all eleven factors, POP and GDP are the most influential for urban sprawl; whereas, the distance from urban centers (D-city) could resist urban sprawl. In contrast, all factors are not statistically significant for special lands because airports and seaports experienced only minor changes. DEM is the most influential factor contributing to the increase of watershed area and greenspace, and the road network (D-road) is the most influential factor hindering the increase of greenspace. The river network (D-river) is typically adjacent to farmland, as evidenced by the high absolute coefficients.
Table 4. The coefficients of the factors tested for statistical significance.
4.2. Simulation results and assessment
Prior to the model implementation, we defined a neighborhood weight matrix () and a transformation cost matrix () considering the variation in the proportion of each land-use type, then assigned the weights and costs based on their interactions. For example, in the greenspace row of , it is possible to convert from water area and farmland to greenspace, thus they are assigned slightly higher neighborhood weights (0.2), while the others are 0.1. For the conversion costs, we assumed that the greenspace type (the greenspace row in ) could be easily converted into urban land (0.2), but difficult to convert into water area (0.9), farmland (0.9), and special land (1.0).
Table 5. The definition of the neighborhood weight matrix.
Table 6. The definition of the transformation cost matrix.
shows the quantitative evaluation for the calibration (2010–2015) and validation (2015–2020) phases based on Futureland and the MAP COMPARISON KIT software (Visser and De Nijs Citation2006). For 2015, the overall accuracy was 86.6%, the Kappas were close to 0.8, and the aggregation cells were about 0.9. These indicate high agreement between the actual land-use maps and the simulated results. In comparison, the validation (2020) decreases slightly by about 2.5% in overall accuracy, about 1–2% in Kappas, and about 1% in aggregation cells. This is a ubiquitous phenomenon in CA-based land-use and urban sprawl simulations, and our simulations show less reduction in accuracy from calibration to validation. According to the producer’s and user’s accuracies, the prediction reliability of greenspace is lower than other types. Combined with a visual inspection, we found that greenspace is relatively dispersed in urban areas, making it difficult for Futureland to capture all changes accurately.
Table 7. The quantitative assessment of the simulated results for both calibration and validation.
4.3. Future scenario prediction
Land demand in 2025, 2030, and 2035 was projected using the modified Markov chain (). Considering that the urban sprawl does not increase linearly and will decrease over time, the land demand was calibrated to a downward trend. As compared to 2020, the urban land in Shanghai is expected to increase by 3.6%, 7.0%, and 10.2% in 2025, 2030, and 2035, respectively. shows that among the ecological lands, farmland will see the largest reduction, greenspace may likely decrease slowly, and water area will remain stable largely. The predicted land demand was input into Futureland as a global constraint for future scenario projections.
Table 8. Total land demand in 2025, 2030 and 2035 based on modified Markov chain for Shanghai.
4.4. Urban sprawl on ecological space
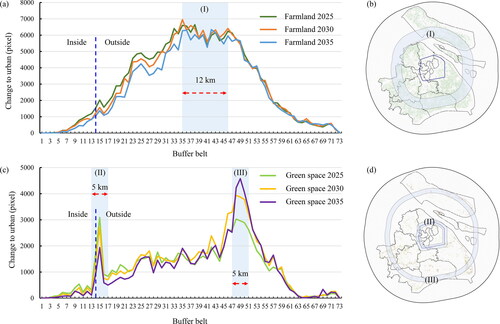
Based on the future scenarios, we analyzed urban sprawl on farmland and greenspace in the next 15 years, using 1 km concentric buffer belts starting from the Outer Ring Highway located at Buffer-14 (). For 2020–2035, urban sprawl at the expense of farmland (change farmland to urban) is mainly found in the belt area with a width of 12 km (Region-I; ), where the city center and the far suburbs do not change much from farmland to urban, then decreases further out to the administrative boundary of Shanghai. The changes from greenspace to urban have two peak belts that both have a width of 5 km (Regions II and III; ). Of these, the region-III may be due to urban sprawl at the expense of coastal wetlands, forests, and riverbank greenspace. The amount of greenspace being occupied within the Outer Ring Highway is small compared to that outside the highway.
Figure 9. Buffer-based analysis of urban sprawl on farmland and greenspace in 2025, 2030, and 2035.
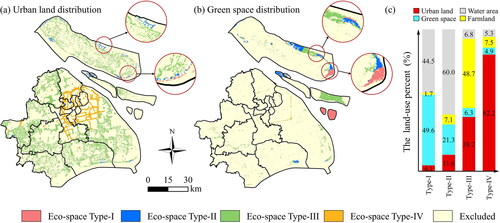
shows the 2035 urban land and greenspace distribution related to the four eco-space types defined in urban planning. The results indicate that the urban sprawl 2020–2035 mainly encroaches on Type-III and Type-IV eco-spaces; whereas, greenspace and water areas also gain from the Type-I and Type-II eco-spaces. Quantitative analysis shows that Type-I eco-space in urban planning is mainly occupied by greenspace and water area, Type-II is mainly by water area, Type-III is mainly by farmland and urban land, and Type-IV is mainly by urban land. These indicate that the Type-IV eco-space near the city center is at high risk of being occupied by urban land. Most of the Type-I and Type-II eco-spaces are preserved as greenspace and water area, and farmland remains the main land resource for new urban development in Shanghai. On Chongming Island, the Type-II eco-space that may likely be developed as urban land is located in the north-central part (upper circle in ), which is in fact under the jurisdiction of Jiangsu rather than Shanghai.
Figure 10. Urban land and greenspace scenarios for 2035. (a) Urban land scenario associated with the four eco-space types in urban planning; (b) greenspace scenario associated with the four eco-space types; (c) the proportion of land-use types associated with the four eco-space types.
5. Discussion
In this study, we developed a new Futureland model by providing relevant software and applied it in Shanghai. The model was used to simulate multiple land-use changes and analyze urban sprawl on greenspace and farmland from 2010–2035. One of the Futureland’s innovations is the CA modeling approach we developed, namely, the GLR method by defining different factors for different land-use types, and the modified Markov chain based on the probability-of-occurrence. Research has shown that commonly applied neural networks and deep learning have limitations in explaining land-use mechanisms due to their black-box property (Karimi et al. Citation2019; Saputra and Lee Citation2019; Xing et al. Citation2020). Compared to these methods, our GLR approach yields parameters that can well explain the dynamic processes of land-use and exclude irrelevant candidate factors. In fact, high precision of simulation is not the only purpose of CA modeling; it is also important to capture land-use dynamics and predict different future scenarios (Li et al. Citation2017). Also, the modified Markov chain can achieve a more accurate land demand forecast, overcoming the shortcomings of standard Markov chains that exaggerate land demand.
In addition, our software employs parallel computing to increase the computational speed and processing capability in simulating large-scale land-use change. CA models typically require long computational times to predict land-use change over long time series and/or large areas. Some early studies proposed that the time-consuming computation of CA models could be handled by parallelization (Schweitzer et al. Citation2011) or by executing from the command line to increase the runtime speed (Mas et al. Citation2014). Our model uses parallel computing based on data slicing techniques, resulting in an exponential speedup over conventional computing, and the speed is proportional to the CPU threads of the user’s computer. For example, in the Shanghai case study, Futureland was executed in less than 20 s, using a computer with Intel i7 12 threads CPU and 16GB memory.
Land-use scenario in 2030 for Shanghai indicates that future areas of change are concentrated in the urban fringes and suburban areas, where urban areas will continue to expand, particularly in the southwest suburbs. This is attributed to that Shanghai’s central area has been largely occupied by buildings and impervious surfaces, while in the west and south there exists a large amount of undeveloped farmland. As a result, urban land expanded to Shanghai’s suburbs (especially to the south) to satisfy the land demand for population growth and industrialization (Zhou et al. Citation2020). We found that farmland encroached upon by the city is concentrated in the suburbs between the Outer Ring Highway and the Suburban Ring Highway, while the green belt in the central city is also at risk of loss. If local governments aim to achieve the greenspace identified in the urban plan in 2035, they should strengthen the regulation of new land development and ensure permanent farmland (Liu et al. Citation2021), thereby alleviating the conflict between farmland/greenspace and construction land. Also, urban greenspace and coastal wetlands are very important ecological spaces, and their protection is an important policy for Shanghai to achieve ecological balance and high-quality sustainable development.
Our study also has limitations, including the resolution of Landsat images and the fact that Landsat images are affected by topographic illumination, shadow effects, and sun angle (Kumari et al. Citation2020; Martín-Ortega et al. Citation2020). These may affect the research results but not the validity of our Futureland model. Since the resolution of Landsat images is only 30 meters, there are also some limitations for fine mapping and classification; therefore, the granularity of the data can also be improved if it can be fused with high-resolution optical images such as Sentinel and SPOT. In future work, we shall test the applicability of Futureland under higher resolution data by jointly using different images to produce land-use maps and future scenarios with high spatiotemporal resolution. Also, we shall define better model parameters by adding spatiotemporal constraints of planning policies and considering ancillary datasets.
6. Conclusions
Effective simulation of land-use change and future scenarios to assess urban sprawl on ecological lands is important for urban planning and management. We developed a new Futureland model that can effectively project future land-use change and provide timely warning of the risk of ecological space loss. Our contributions are three folds: (1) we combined CA with GLR for the first time for constructing transformation rules, which can better describe the mechanisms of land-use change and urban sprawl by modeling different land-use types using different factors in a single simulation experiment; (2) we proposed a modified Markov chain that considers the probability-of-occurrence to more accurately project the total future land demand; (3) Futureland was developed using GDAL and parallel computing, which significantly improve the implementation efficiency. The software also integrates unique features such as graphical neighborhood configuration, matrixed conversion costs and edge enhancement. Although it does not provide enough options in CA conversion rules, it is an open simulation software tool that allows modelers to write different scripts to develop their new models using the R language, with scripting rules provided in the manual.
The 2010–2020 Shanghai case study verified the applicability of the Futureland and displayed its ability to simulate complex land-use change, as confirmed by the high overall accuracy (86.6%) and Kappa simulation (79.6%). We predicted land-use scenarios 2020–2035 under the urban ecological planning, showing that the ecological space in Shanghai in the future is at risk of being occupied by urban sprawl, especially the urban greenspace and suburban farmland around the Outer Ring Highway. The results provide an important reference for policy-making on urban development in Shanghai and can be applied to long-term green space planning and conservation. Because Futureland uses parallel computing, it can be applied to simulate land-use change and its impacts on a global scale.
Data availability statement
The Futureland software we developed is available at www.researchgate.net/publication/356978377 and the data we used is available at figshare.com/s/af1c7c14170fc44c39eb.
Disclosure statement
No potential conflict of interest was reported by the authors.
Additional information
Funding
References
- Al-Sharif AA, Pradhan B. 2015. A novel approach for predicting the spatial patterns of urban expansion by combining the chi-squared automatic integration detection decision tree, Markov chain and cellular automata models in GIS. Geocarto Int. 30(8):858–881.
- Chen S, Feng Y, Tong X, Liu S, Xie H, Gao C, Lei Z. 2020a. Modeling ESV losses caused by urban expansion using cellular automata and geographically weighted regression. Sci Total Environ. 712:136509.
- Chen S, Feng Y, Ye Z, Tong X, Wang R, Zhai S, Gao C, Lei Z, Jin Y. 2020b. A cellular automata approach of urban sprawl simulation with Bayesian spatially-varying transformation rules. GISci Remote Sens. 57(7):924–942.
- Chen Y, Liu X, Li X. 2017. Calibrating a land parcel cellular automaton (LP-CA) for urban growth simulation based on ensemble learning. Int J Geog Inf Sci. 31(12):2480–2504.
- Cloern JE, Abreu PC, Carstensen J, Chauvaud L, Elmgren R, Grall J, Greening H, Johansson JOR, Kahru M, Sherwood ET, et al. 2016. Human activities and climate variability drive fast‐paced change across the world’s estuarine–coastal ecosystems. Glob Chang Biol. 22(2):513–529.
- Feng Y, Tong X. 2017. Using exploratory regression to identify optimal driving factors for cellular automaton modeling of land use change. Environ Monit Assess. 189(10):1–17.
- Feng Y, Tong X. 2018. Calibration of cellular automata models using differential evolution to simulate present and future land use. Trans GIS. 22(2):582–601.
- Feng Y, Tong X. 2020. A new cellular automata framework of urban growth modeling by incorporating statistical and heuristic methods. Int J Geog Inf Sci. 34(1):74–97.
- Feng Y. 2017. Modeling dynamic urban land-use change with geographical cellular automata and generalized pattern search-optimized rules. Int J Geog Inf Sci. 31(6):1198–1219.
- Firozjaei MK, Sedighi A, Argany M, Jelokhani-Niaraki M, Arsanjani JJ. 2019. A geographical direction-based approach for capturing the local variation of urban expansion in the application of CA-Markov model. Cities. 93:120–135.
- Gao C, Feng Y, Tong X, Lei Z, Chen S, Zhai S. 2020. Modeling urban growth using spatially heterogeneous cellular automata models: comparison of spatial lag, spatial error and GWR. Comput Environ Urban Syst. 81:101459.
- Gomes E, Inácio M, Bogdzevič K, Kalinauskas M, Karnauskaitė D, Pereira P. 2021. Future land-use changes and its impacts on terrestrial ecosystem services: a review. Sci Total Environ. 781:146716.
- Guan Q, Shi X, Huang M, Lai C. 2016. A hybrid parallel cellular automata model for urban growth simulation over GPU/CPU heterogeneous architectures. Int J Geog Inf Sci. 30(3):494–514.
- Güneralp B, Seto K. 2013. Futures of global urban expansion: uncertainties and implications for biodiversity conservation. Environ Res Lett. 8(1):014025.
- Hagen A. 2003. Fuzzy set approach to assessing similarity of categorical maps. Int J Geog Inf Sci. 17(3):235–249.
- Halmy MWA, Gessler PE, Hicke JA, Salem BB. 2015. Land use/land cover change detection and prediction in the north-western coastal desert of Egypt using Markov-CA. Appl Geogr. 63:101–112.
- Hamad R, Balzter H, Kolo K. 2018. Predicting land use/land cover changes using a CA-Markov model under two different scenarios. Sustainability. 10(10):3421.
- Jennings V, Johnson Gaither C, Gragg RS. 2012. Promoting environmental justice through urban green space access: a synopsis. Environ Justice. 5(1):1–7.
- Jennings V, Larson L, Yun J. 2016. Advancing sustainability through urban green space: cultural ecosystem services, equity, and social determinants of health. Int J Environ Res Public Health. 13(2):196.
- Kanniah KD. 2017. Quantifying green cover change for sustainable urban planning: a case of Kuala Lumpur, Malaysia. Urban For Urban Greening. 27:287–304.
- Karimi F, Sultana S, Babakan AS, Suthaharan S. 2019. An enhanced support vector machine model for urban expansion prediction. Comput Environ Urban Syst. 75:61–75.
- Kumari N, Saco PM, Rodriguez JF, Johnstone SA, Srivastava A, Chun KP, Yetemen O. 2020. The grass is not always greener on the other side: seasonal reversal of vegetation greenness in aspect‐driven semiarid ecosystems. Geophys Res Lett. 47(15):e2020GL088918.
- Li D, Li X, Liu X, Chen Y, Li S, Liu K, Qiao J, Zheng Y, Zhang Y, Lao C. 2012. GPU-CA model for large-scale land-use change simulation. Chin Sci Bull. 57(19):2442–2452.
- Li Q, Feng Y, Tong X, Zhou Y, Wu P, Xie H, Jin Y, Chen P, Liu S, Xv X, et al. 2022. Firefly algorithm-based cellular automata for reproducing urban growth and predicting future scenarios. Sustainable Cities Soc. 76:103444.
- Li X, Chen Y, Liu X, Xu X, Chen G. 2017. Experiences and issues of using cellular automata for assisting urban and regional planning in China. Int J Geog Inf Sci. 31(8):1606–1629.
- Li X, Liu X, Yu L. 2014. A systematic sensitivity analysis of constrained cellular automata model for urban growth simulation based on different transition rules. Int J Geog Inf Sci. 28(7):1317–1335.
- Liang X, Liu X, Li D, Zhao H, Chen G. 2018a. Urban growth simulation by incorporating planning policies into a CA-based future land-use simulation model. Int J Geog Inf Sci. 32(11):2294–2316.
- Liang X, Liu X, Li X, Chen Y, Tian H, Yao Y. 2018b. Delineating multi-scenario urban growth boundaries with a CA-based FLUS model and morphological method. Landscape Urban Plann. 177:47–63.
- Lin Y-P, Chu H-J, Wu C-F, Verburg PH. 2011. Predictive ability of logistic regression, auto-logistic regression and neural network models in empirical land-use change modeling–a case study. Int J Geog Inf Sci. 25(1):65–87.
- Lipowski A, Lipowska D. 2012. Roulette-wheel selection via stochastic acceptance. Physica A. 391(6):2193–2196.
- Liu S, Zhang X, Feng Y, Xie H, Jiang L, Lei Z. 2021. Spatiotemporal dynamics of urban green space influenced by rapid urbanization and land use policies in Shanghai. Forests. 12(4):476.
- Liu X, Liang X, Li X, Xu X, Ou J, Chen Y, Li S, Wang S, Pei F. 2017. A future land use simulation model (FLUS) for simulating multiple land use scenarios by coupling human and natural effects. Landscape Urban Plann. 168:94–116.
- Mansour S, Al-Belushi M, Al-Awadhi T. 2020. Monitoring land use and land cover changes in the mountainous cities of Oman using GIS and CA-Markov modelling techniques. Land Use Policy. 91:104414.
- Martín-Ortega P, García-Montero LG, Sibelet N. 2020. Temporal patterns in illumination conditions and its effect on vegetation indices using Landsat on Google Earth Engine. Remote Sens. 12(2):211.
- Mas J-F, Kolb M, Paegelow M, Olmedo MTC, Houet T. 2014. Inductive pattern-based land use/cover change models: a comparison of four software packages. Environ Modell Software. 51:94–111.
- Mesta C, Cremen G, Galasso C. 2022. Urban growth modelling and social vulnerability assessment for a hazardous Kathmandu Valley. Sci Rep. 12(1):6152.
- Mirbagheri B, Alimohammadi A. 2017. Improving urban cellular automata performance by integrating global and geographically weighted logistic regression models. Trans GIS. 21(6):1280–1297.
- Mustafa A, Rienow A, Saadi I, Cools M, Teller J. 2018. Comparing support vector machines with logistic regression for calibrating cellular automata land use change models. Eur J Remote Sens. 51(1):391–401.
- Nagendra H, Bai X, Brondizio ES, Lwasa S. 2018. The urban south and the predicament of global sustainability. Nat Sustain. 1(7):341–349.
- Newland CP, Maier HR, Zecchin AC, Newman JP, Van Delden H. 2018. Multi-objective optimisation framework for calibration of cellular automata land-use models. Environ Modell Software. 100:175–200.
- Nor ANM, Corstanje R, Harris JA, Brewer T. 2017. Impact of rapid urban expansion on green space structure. Ecol Indic. 81:274–284.
- Pontius RG Jr, Huffaker D, Denman K. 2004. Useful techniques of validation for spatially explicit land-change models. Ecol Modell. 179(4):445–461.
- Şalap-Ayça S, Jankowski P, Clarke KC, Kyriakidis PC, Nara A. 2018. A meta-modeling approach for spatio-temporal uncertainty and sensitivity analysis: an application for a cellular automata-based Urban growth and land-use change model. Int J Geog Inf Sci. 32(4):637–662.
- Saputra MH, Lee HS. 2019. Prediction of land use and land cover changes for North Sumatra, Indonesia, using an artificial-neural-network-based cellular automaton. Sustainability. 11(11):3024.
- Schweitzer C, Priess JA, Das S. 2011. A generic framework for land-use modelling. Environ Modell Software. 26(8):1052–1055.
- Seto KC, Güneralp B, Hutyra LR. 2012. Global forecasts of urban expansion to 2030 and direct impacts on biodiversity and carbon pools. Proc Natl Acad Sci U S A. 109(40):16083–16088.
- Shahbazian Z, Faramarzi M, Rostami N, Mahdizadeh H. 2019. Integrating logistic regression and cellular automata–Markov models with the experts’ perceptions for detecting and simulating land use changes and their driving forces. Environ Monit Assess. 191(7):1–17.
- Siddiqui A, Siddiqui A, Maithani S, Jha A, Kumar P, Srivastav S. 2018. Urban growth dynamics of an Indian metropolitan using CA markov and logistic regression. Egypt J Remote Sens Space Sci. 21(3):229–236.
- Srivastava A, Kumari N, Maza M. 2020. Hydrological response to agricultural land use heterogeneity using variable infiltration capacity model. Water Resour Manage. 34(12):3779–3794.
- Tong X, Feng Y. 2019. How current and future urban patterns respond to urban planning? An integrated cellular automata modeling approach. Cities. 92:247–260.
- Valbuena D, Verburg PH, Bregt AK, Ligtenberg A. 2010. An agent-based approach to model land-use change at a regional scale. Landscape Ecol. 25(2):185–199.
- Van Vliet J, Bregt AK, Hagen-Zanker A. 2011. Revisiting Kappa to account for change in the accuracy assessment of land-use change models. Ecol Modell. 222(8):1367–1375.
- Verburg PH, Overmars KP. 2009. Combining top-down and bottom-up dynamics in land use modeling: exploring the future of abandoned farmlands in Europe with the Dyna-CLUE model. Landscape Ecol. 24(9):1167–1181.
- Visser H, De Nijs T. 2006. The map comparison kit. Environ Modell Software. 21(3):346–358.
- Wang J, Feng Y, Ye Z, Tong X, Wang R, Gao C, Chen S, Lei Z, Liu S, Jin Y. 2022. Simulating the effect of urban light rail transit on urban development by coupling cellular automata and conjugate gradients. Geocarto Int. 37(8):2346–2364.
- Wei P, Chen S, Wu M, Deng Y, Xu H, Jia Y, Liu F. 2021. Using the InVEST model to assess the impacts of climate and land use changes on water yield in the upstream regions of the Shule River Basin. Water. 13(9):1250.
- Wu Z, Chen R, Meadows ME, Sengupta D, Xu D. 2019. Changing urban green spaces in Shanghai: trends, drivers and policy implications. Land Use Policy. 87:104080.
- Xing W, Qian Y, Guan X, Yang T, Wu H. 2020. A novel cellular automata model integrated with deep learning for dynamic spatio-temporal land use change simulation. Comput Geosci. 137:104430.
- Zhou L, Dang X, Sun Q, Wang S. 2020. Multi-scenario simulation of urban land change in Shanghai by random forest and CA-Markov model. Sustainable Cities Soc. 55:102045.
- Zhuang H, Liu X, Liang X, Yan Y, He J, Cai Y, Wu C, Zhang X, Zhang H. 2022. Tensor-CA: a high-performance cellular automata model for land use simulation based on vectorization and GPU. Trans GIS. 26(2):755–778.