
Abstract
Medan City is the third-largest city in Indonesia and serves as the capital of North Sumatra Province. The city has several sub-districts with mangrove forests, with the largest area located in Medan Belawan Sub-district, followed by Medan Labuhan and Medan Marelan Sub-districts. The mangrove forests are situated in the downstream part of the Deli Watershed or the northern part of Medan City. Over the past fourteen years, there has been a significant change in the mangrove land cover, particularly in Medan Labuhan Sub-district. To address this issue, an integrated remote sensing, Geographic Information Systems (GIS), and Analytical Process Hierarchy (AHP) approach was used to map and analyze changes in mangrove cover and determine priority factors to prevent further changes. The study found that the mangrove forest area in Medan Labuhan Sub-district has decreased by 111.25 ha over the years, and the economy was identified as the top priority criterion for preventing changes in mangrove cover. The study recommends efforts from all parties to minimize changes in mangrove forest cover to maintain the function of the mangrove ecosystem, and this approach can help decision-makers and stakeholders make informed decisions about mangrove ecosystem management and conservation in Medan City.
Introduction
The population growth in Indonesia is causing an increase in demand for land use. This demand for land use has become an unavoidable issue due to the rise in population and human activities that involve land use. Over the years, this has resulted in changes in land use and land cover (LULCC) throughout the country, particularly in urban areas like Medan. Although there has been significant development in urban areas, such as the construction of settlements, business centers, and factories, this does not necessarily guarantee sustainable land cover. Therefore, it is essential to monitor and control land use to achieve a sustainable city. One useful way to determine urban development is to obtain information or data on land cover, as noted by Pothier and Millward (Citation2013) and Abdullahi et al. (Citation2015).
Medan is a densely populated city, leading to the conversion of land for residential and commercial use, resulting in a reduction in vegetation cover. The built-up areas serve as hubs for economic and social activities. Medan is among the top five largest cities in Indonesia with a population of over two million people occupying an area of 26,510 hectares (265.10 km2), which accounts for 3.6% of the North Sumatra region. The population density in Medan is 8008 people/km2, and it stands at the 15th position in terms of population density among the 90 largest cities in Indonesia, which is lower than Jakarta.
The Sustainable Development Goals (SDGs) is a global strategy aimed at eradicating poverty, reducing inequality, and safeguarding the environment. One of the 17 goals of the SDGs is to protect, restore, and sustainably use terrestrial ecosystems, manage forests sustainably, prevent desertification, restore land degradation, and halt biodiversity loss (Goal Number XV: Life on Land). This goal was ratified on 25 September 2015, at the United Nations Headquarters, with the participation of various stakeholders such as the government, civil society organizations, the private sector, and academia. According to the International Tropical Timber Organization (ITTO), Sustainable Forest Management (SFM) refers to the process of managing forest land with the aim of achieving one or more defined management objectives. SFM involves the sustainable production of desired forest products and services without any unintended environmental or social impacts or diminishing the value of the forest’s potential in the future (ITTO Citation2005).
Having the most recent information regarding the presence of mangrove forests is crucial for supporting the Medan government in spatial planning and implementing the SDGs initiative, particularly in sustainable development planning. This aligns with previous studies on mangrove cover changes in various countries (Long et al. Citation2011; Peneva-reed Citation2014; Gevana et al. Citation2015; Giri and Long Citation2016; Degife et al. Citation2018; Zhen et al. Citation2018; Avtar et al. Citation2021; Castillo et al. Citation2021; Rahmawaty et al. Citation2022a; Dynamics et al. Citation2023; Purwanto et al. Citation2023). The trend of land use and land cover change (LULCC) indicates that development in Medan will persist due to population growth, which will lead to an increasing demand for land. Land use is a form of human interaction with land to meet material and spiritual needs, resulting in land conversion for various purposes such as settlements, plantations, and industries. Multiple studies on land cover change have been conducted in North Sumatra Province, other regions in Indonesia, and other countries (Rahmawaty et al. Citation2016, Citation2021a, Citation2021b, Citation2021c, Citation2022a, Citation2022b; Nurda et al. Citation2020) as well as in other countries (Kanth and Hassan Citation2010; Degife et al. Citation2018; Kidane et al. Citation2019; Magpantay et al. Citation2019; Mensah et al. Citation2019; Gupta et al. Citation2020; Assaf et al. Citation2021; Biswas and Ghosh Citation2022; Pandey et al. Citation2022). Thus, analyzing changes in mangrove land cover over time using remote sensing data remains a challenging yet crucial task, especially for decision-makers.
One of the land conversions that occur is from mangrove forests to various land uses. Mangroves are intertidal wetlands that occur along tropical, subtropical, and temperate coastlines (Nguyen et al. Citation2021). Therefore, the mangrove forest is an important ecosystem that needs to be preserved as a functional ecosystem. Several research results related to changes in mangrove land cover have also been carried out in various regions, such as Turki (Alphan and Güvensoy Citation2016, Vietnam (Nguyen et al. Citation2021), Southeast Asia (Fauzi et al. Citation2019), Southwest Florida (Marchio et al. Citation2016), and Australia (Alongi Citation2018). However, it is still necessary to do in Medan because the mangrove forest in this city is a very important land cover to maintain the sustainability environment. Therefore, this research is important to conduct.
Land use change is a common occurrence wherein mangrove forests are converted to different land uses. Mangrove forests are wetlands found in tropical, subtropical, and temperate coastlines and are vital ecosystems that must be preserved (Nguyen et al. Citation2021). Many studies have been conducted on changes in mangrove land cover in various regions such as Turky (Alphan and Güvensoy Citation2016, Vietnam (Nguyen et al. Citation2021), Southeast Asia (Fauzi et al. Citation2019), Southwest Florida (Marchio et al. Citation2016), and Australia (Alongi Citation2018)Turkey. However, it is crucial to conduct such research in Medan as the city’s mangrove forest is essential in maintaining a sustainable environment. Therefore, this research is significant and must be carried out. To understand the dynamics of land cover change and aid in city planning, it is crucial to have accurate data and information on LULCC over a specific period in the downstream area of Medan’s watersheds. Therefore, this study aims to use remote sensing, GIS, and AHP to map and analyze changes in mangrove cover in Medan’s northern part from 2005 to 2019. Remote sensing data, such as satellite imagery, can detect changes in mangrove cover, while GIS can analyze and visualize the data. The AHP method can also prioritize and rank the factors that contribute to mangrove changes. By integrating these tools and methods, it is possible to obtain a more comprehensive understanding of the factors that contribute to mangrove changes and develop effective strategies for addressing them, which can aid decision-makers and stakeholders in making informed decisions about the management and conservation of mangrove ecosystems in Medan City.
Methodology
Research location
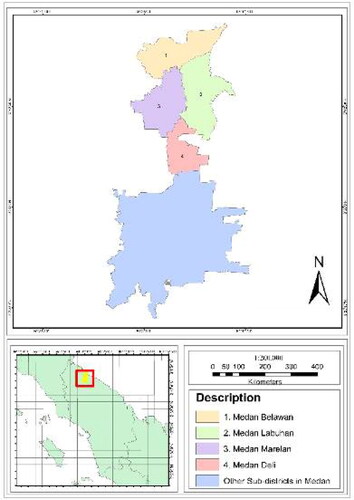
Geographically, Medan is situated between 2°.27′−2°.47′ North Latitude and 98°.35′– 98°.44′ East Longitude. Its altitude ranges from 2.5 to 37.5 meters above sea level. The city is located at the confluence of two major rivers, namely the Deli River and the Babura River. It shares its boundaries with Deli Serdang Regency in the south, east, and west, and is also bordered by the Malacca Strait in the north. The study areas for this research were limited to the Northern Medan region, which includes four sub-districts with mangrove forests: Medan Deli (MD), Medan Marelan (MM), Medan Labuhan (ML), and Medan Belawan (MB) Sub-districts (as shown in ).
Figure 1. A map of North Sumatra Showing the study areas in the Northern of Medan City.
Data collection
Between March 2021 and June 2022, data was collected for this study, which consisted of both primary and secondary data. The primary data was obtained by collecting ground checkpoint data at the research site located in the northern city of Medan, using GPS, Avenza Map, and an open camera. The GPS, Avenza Maps, and an open camera were used to record the coordinates of each land cover representative. The secondary data was collected from the Medan City regional development planning agency’s 2021 administrative map of Medan City and Landsat Image 5 from the years 2005, 2011, 2015, and 2019, which was obtained from https://earthexplorer.usgs.gov/.
Data analysis
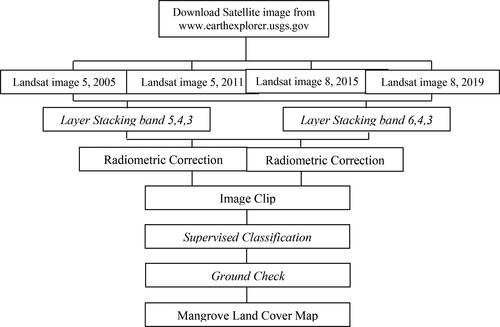
The process of data analysis that was conducted involved examining satellite imagery, studying the changes in land cover, analyzing the change matrix, and identifying the factors that caused changes in land cover using the AHP. To analyze the changes in mangrove, cover in the northern region of Medan City, North Sumatra, Indonesia between 2005 and 2019, several steps were taken. First, a land-use map was created for the study area using satellite imagery and other relevant data sources. Then, land-use change maps were generated for four different time periods, namely, 2005, 2011, 2015, and 2019, by comparing the baseline map to more recent satellite imagery.
The following describes the stages of work in this study, namely:
a. Merger of image band
Landsat imagery downloaded from earthexplorer.usgs.gov has several bands, and each band is separate. Therefore, to combine separate bands, it is first necessary to combine image bands to perform radiometric corrections. ERDAS Imagine is used to merge separate image bands to be unified.
b. Image cropping
Image cropping is useful for getting boundaries of areas or areas to be used in research and to make it easier to classify images. Image cutting is done using ArcGIS 10.8 software using Medan City vector data. Cutting is done because one scene image data generally covers a large area. Before carrying out the clip or raster cutting process, the boundaries of the cutting area are made. Determination of the boundaries of the cutting area is determined based on the object to be observed.
c. Layer stacking
Layer stacking combines multiple raster bands or layers into a single composite image. Bands 5, 4, and 3 typically combine three specific spectral bands from a satellite or aerial imagery dataset. The numbers 5, 4, and 3 typically correspond to specific wavelengths of light in the electromagnetic spectrum. These bands are often associated with the red, green, and blue colors, respectively, in the resulting composite image. Stacking these bands together makes it possible to create a false-color composite image that can enhance certain features or characteristics of the landscape, such as vegetation health, water bodies, or urban areas.
d. Radiometric and Geometric corrections
Radiometric correction is used to detect objects blocking the image so that the image used is clear and, when analyzed, there are no errors in classifying. Radiometric correction measures the value of electromagnetic radiation at a particular wavelength and functions as an object detector from the reflection of ultraviolet light in each spectral channel. Radiometric correction gives the image a broader range of values and color changes. Radiometric correction is a basic image correction carried out to remove noise in the image to improve the image from distortion by the position of the sun’s light. Geometric correction is needed in mapping because it helps transform or change remote sensing images so that the images used have map properties in the form of scale and projection. Geospatial corrections must also be made to primary geospatial data, such as the topographical map of Indonesia with the same or larger scale than the data to be generated. To create a 1:50,000 scale land use map, the basic geometric correction map is an RBI map with a 1: 50,000 or 1: 25,000 scale.
e. Clip image
Before performing the process of clipping the Landsat image, it is necessary to complete the raster copy procedure. The clipping process utilizes the ‘clip’ tools available in the ArcGIS application. The input parameters for the clipping process consist of the Landsat image as the target image for cutting and the Medan City shape file as the tool for cropping the Landsat image. This is done to obtain the desired Medan Landsat image.
f. Supervised Classification
The Supervised Classification method is performed by ground check at the research location. Ground check is the stage where researchers go to the field to take field points and ensure that the classification that has been carried out is correct. A ground check with the survey is carried out to ensure the correctness of the land cover type from the product of the land cover map.
g. Assessment of the accuracy of the classification
An accuracy assessment is carried out to obtain the confidence level from remote sensing. One common way to describe the level or magnitude of classification accuracy is to use an error matrix, also known as a confusion matrix or contingency table. Kappa’s calculation accuracy uses all column elements in the error matrix (Lilliesand and Dan Kiefer Citation1979; Myint et al. Citation2013). A good classification process results in a classification process with a kappa accuracy value of more than or equal to 85% or a coefficient of 0.85. This study obtained an accuracy value of 90.23% or a coefficient of 0.90. this shows that the level of accuracy is high (Foody Citation2020; Huo et al. Citation2022).
h. Map analysis of mangrove land cover
Mangrove land cover maps for 2005, 2011, 2015, and 2019 were obtained from the interpretation of satellite imagery. In addition, mangrove land cover analysis was carried out using GIS (Pothier and Millward Citation2013; Abdullahi et al. Citation2015; Rahmawaty et al. Citation2015, Citation2021a, Citation2021b, Citation2021c; Mensah et al. Citation2019; Schaefer and Thinh Citation2019; Gupta et al. Citation2020; Biswas and Ghosh Citation2022; Pandey et al. Citation2022). ArcGIS software provides tools that can overlay land cover maps (Rahmawaty et al. Citation2022a, Citation2022b). As a result, land cover changes product can also be overlaid with an administrative map. To determine the addition and subtraction of land cover area, tables from GIS software were exported into Microsoft Excel to calculate the percentage of changed land area. Ground check is carried out to determine the actual condition of land cover.
Mangrove land cover changes (reduction or increase) were calculated using Microsoft Office Ex-cel. The differences in the land cover change were performed using the change detection technique in the GIS environment. Classification data were obtained by comparing two different years of land cover, namely 2005–2011, 2011–2015, 2015–2019, 2005–2015, 2011–2019, and 2005–2019. Furthermore, the classification results were observed to identify changes in their area to obtain land changes from 2005, 2011, 2015, and 2019. A flowchart depicting the steps involved in creating a mangrove land cover map in Medan City is presented in .
Figure 2. Flowchart depicting the steps involved in creating a mangrove land cover map.
i. Analysis of changes in mangrove land cover
The changes in mangrove land cover from 2005 to 2019 were analyzed using a mangrove land cover matrix. This matrix is a crucial tool for studying dynamic changes in land use and provides detailed information on the transfer structure and direction of each land use type at the beginning and end of the study period. By examining the transfer matrix, researchers can identify the source and destination of each land use type and the types of land use involved in the transformation process. This information helps to analyze the evolution of different land use types over time. To create the land use transfer matrix, data from six periods (2005–2011, 2005–2015, 2005–2019, 2011–2015, 2011–2019 and 2015–2019) were analyzed using spatial overlay analysis in ArcGIS software. The resulting matrix provides valuable insights into the transformation patterns between land use types and enables researchers to understand land use dynamics better. presents a flowchart detailing the steps involved in creating a mangrove land cover map for the Medan City.
Figure 3. Flowchart of analysis of changes in mangrove cover with change detection in Medan City.
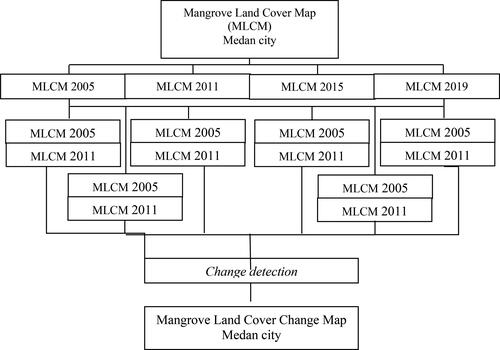
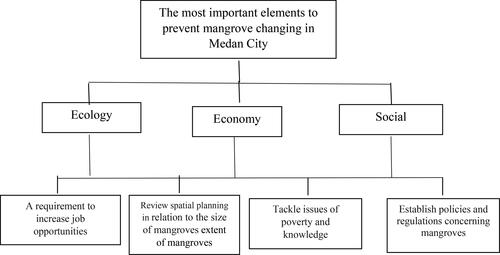
Figure 4. Hierarchical structure chart to determine the most important elements to prevent mangrove changing in Medan City.
k. Analysis of priority factors to prevent changes in mangrove cover using AHP
To identify the priority factors for preventing changes in mangrove cover using the AHP, this study involved purposively selected key informants. The research process involved several steps, including selecting the expert’s/key informants, creating hierarchical structures, developing AHP questionnaires, collecting data from the key informants, processing the data using expert choice, and determining the weights of criteria and alternatives. The AHP questionnaire was structured hierarchically to reflect the relationship between the goal, criteria, and alternatives. Additionally, interviews were conducted with key informants to gather qualitative information about the drivers of mangrove forest changes, criteria, and alternatives to prevent changes in mangrove cover in Medan City. The AHP method uses a systems approach for decision-making, and the recommended procedure for solving a problem using this method involves organizing the problem into a hierarchy, comparing hierarchical elements on a paired basis, and filling out the questionnaire with a weight vector on the AHP scale from 1 to 9, known as the Saaty-scale (Saaty Citation2008; Saaty and Vargas Citation2012; Rahmawaty et al. Citation2022c).
Results and discussion
Land cover types in the North of Medan City
displays the various types of land cover present in the northern region of Medan City, as determined through image analysis. The area was categorized into seven types of land cover, including mangrove, pond, shrub, open land, paddy field, settlement, and water body. Settlement, pond, and mangroves were the most prominent land cover types in 2019, with settlement covering 4893.75 ha (42.84% of the total area), followed by pond at 2197.30 ha (19.24% of the total area), and mangroves at 1682.35 ha (14.73% of the total area). Medan City is the third-largest city in Indonesia, and its population growth has resulted in a steady increase in the area of settlements. reveals that in 2005, settlements covered only 3886.93 ha (34.03% of the total area), which grew to 4745.77 ha (41.55%) in 2011, 4748.16 ha (41.57%) in 2015, and 4893.72 ha (42.84%) in 2019.
Table 1. Land cover types in the northern City of Medan.
The mangrove covers in the northern of Medan City
In the northern part of Medan City, mangrove is the third largest type of land cover. and display the distribution of mangrove forests in each sub-district for four land uses. Mangrove forest cover is present in the Medan Belawan, Medan Labuhan, and Medan Marelan sub-districts. The most extensive mangrove forest cover in 2019 was found in the Medan Belawan sub-district, covering an area of 1093.93 hectares or 65.02%. The second largest mangrove forest cover was in the Medan Labuhan sub-district, covering 320.17 hectares or 19.03%, followed by the Medan Marelan sub-district with an area of 268.23 hectares or 15.94%.
Figure 5. Comparison of mangrove cover area in four time periods in the northern of Medan City.
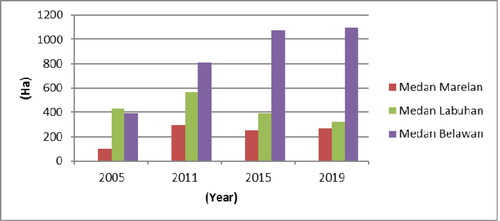
Table 2. The mangrove covers in each sub-district in four time periods in the northern part of Medan City.
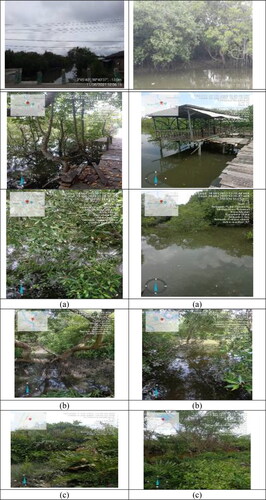
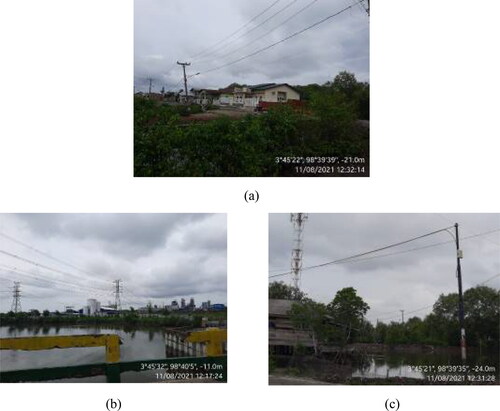
The largest mangrove forest cover in Medan Labuhan Sub-district in 2005 was 431.81 hectares, which accounted for 46.56% of the total area. Medan Belawan Sub-district had the second-largest cover of 393.28 hectares (42.45%), followed by Medan Marelan Sub-district with 101.81 hectares (10.99%). In contrast, there were no mangroves in the Medan Deli Sub-district. The dominant mangrove species in Medan City were Xylocarpus sp. (Nyirih) and Rhizophora sp. (Bakau), as well as Nypa fruticans, which were mostly found along the coast. However, in some areas, mangrove forests were located further inland. provides images of the ground conditions of the mangroves in the study area.
Figure 6. The condition of mangroves: (a). in Medan Belawan, (b). Medan Marelan and (c). Medan Labuhan.
displays the findings from the analysis of land cover maps for mangrove forests in Medan City during six different periods: 2005–2011, 2011–2015, 2015–2019, 2005–2015, 2011–2019, and 2005–2019. illustrates the spatial distribution of mangrove covers in the northern region of Medan City in 2005, 2011, 2015, and 2019. The study identified dense mangrove cover in the western part of the Medan Belawan Sub-district, in the northern area of the Medan Labuhan Sub-district, and small clusters in the eastern part of the Medan Labuhan Sub-district.
Figure 7. The distribution of mangroves cover in the northern of Medan City for the fourteen-time period (2005–2019).
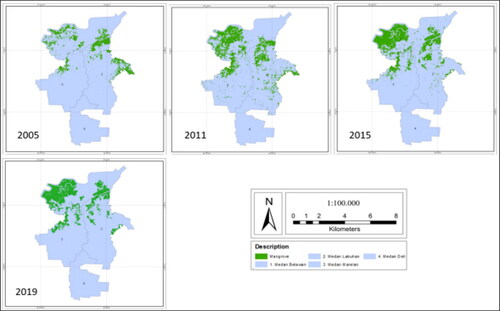
Table 3. Mangrove forest cover by sub-district in Medan City in 2005 and 2011.
Table 4. Mangrove forest cover by sub-district in Medan City in 2005 and 2015.
Table 5. Mangrove forest cover by sub-district in Medan City in 2005 and 2019.
Table 6. Mangrove forest cover by sub-district in Medan City in 2011 and 2015.
Table 7. Mangrove forest cover by sub-district in Medan City in 2011 and 2019.
Table 8. Mangrove forest cover by sub-district in Medan City in 2015 and 2019.
displays the data collected between 2005 and 2011 on six different land uses, indicating an overall increase in mangrove forest land cover across all three districts. The most significant increase in mangrove coverage was observed in the Medan Belawan Sub-district, which expanded from 393.28 ha to 807.28 ha. Consequently, the Medan Belawan Sub-district had the largest area of mangrove cover among the three sub-districts in 2011, accounting for 48% of the total mangrove cover in the area.
Between 2005 and 2015, there was a decrease in the total area of mangrove forest in Medan Labuhan Sub-district from 431.42 ha to 390.15 ha, according to the observation period of 10 land uses (as shown in ). However, the opposite trend was observed in the other two districts. In Medan Marelan and Medan Belawan Sub-districts, there was an increase in the total area of ten land uses, namely 151.4 ha and 677.59 ha, respectively. As a result, the largest total area of mangrove cover in 2015 was in Medan Belawan Sub-district.
From 2005 to 2019, 14 land uses were observed, and the changes in mangrove forest area during this period are presented in . The data reveals that Medan Belawan Sub-district experienced significant and progressive development compared to the other two districts, with an increase in total area from 393.28 ha to 700.65 ha (178%). However, Medan Labuhan Sub-district was the only sub-district that continued to experience a decrease in the total area of mangrove forests, from 431.42 ha to 320.17 ha (a decrease of 111.25 ha). This decrease is related to human activities (Harahap et al. Citation2021a, Citation2021b), and needs to be monitored continuously to prevent further suppression of green open spaces. The other two sub-districts consistently experienced an increase in the area of mangrove forests.
In the observation period from 2011 to 2015 (), mangrove areas decreased in two districts, Medan Marelan and Medan Labuhan. In 2011, the mangroves in these two districts covered an area of 295.83 ha and 563.32 ha respectively, which decreased to 253.21 ha and 390.15 ha in 2015. Medan Belawan was the only sub-district that experienced an increase in mangrove areas during this period.
According to , the period between 2011 and 2019 saw an increase in the area of Medan Belawan Sub-district by 286.65 ha, from 807.28 ha to 1,093.93 ha, across the 8 land uses. In contrast, Medan Marelan Sub-district and Medan Labuhan Sub-district experienced a decrease in the mangrove forest area in all 8 land uses, with −27.6 ha and −243.15 ha respectively. provides a comparison of the mangrove forest area in these three sub-districts. The data suggests that mangrove forests in Medan Belawan Sub-district have been developing well, with an increase in forest area in each observation period. This indicates that the conversion of mangrove land use functions in this location can be suppressed, allowing mangrove vegetation to continue to grow and increase the canopy cover area.
During the observation period between 2015 and 2019, only the Medan Labuhan Sub-district experienced a decline in the total area of mangroves, decreasing from 390.15 ha to 320.17 ha, as shown in . However, two other sub-districts, Medan Marelan and Medan Belawan, saw a significant increase in mangrove area. In 2015, Medan Marelan had 253.21 ha of mangroves, while Medan Belawan had 1070.87 ha. By 2019, both had increased to 268.23 ha and 1093.93 ha, respectively. Despite some changes in mangrove areas, the overall addition or reduction did not appear to be significant during this period (). indicates that the conversion of mangrove forest land use to other forms of land use has occurred due to the demand for land to meet human needs and activities, as noted by Harahap et al. (Citation2022); Rahmawaty et al. (Citation2022a, Citation2022b).
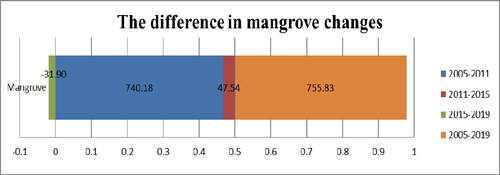
illustrates the variation in the area of mangrove forest cover per sub-district in Medan City between 2005 and 2019. The changes were noted over the entire period, with 740.18 ha of changes recorded from 2005 to 2011, 47.54 ha from 2011 to 2015, and a decrease of 31.90 ha from 2015 to 2019. The most significant difference was observed between 2005 and 2019, with a total of 755.83 ha of changes across 14 land uses. The rate of changes per land use for mangroves was approximately 53.98 ha.
Figure 8. The difference in the area of mangrove forest cover per sub-district in Medan City in 2005, 2011, 2015 and 2019.
Matrix of changes in mangrove forest cover
The land cover for mangroves in Medan City has fluctuated over the years from 2005 until 2019. Statistical results of mangrove changes for the periods of 2005–2011, 2005–2015, and 2005–2019 are shown in . These results provide insights into the changes in mangrove cover over time, allowing for a better understanding of the factors contributing to these changes. In addition, maps of mangrove changes for these periods are shown in . These maps provide a visual representation of the changes in mangrove cover, making it easier to identify areas where mangroves have been lost or gained. By using these maps in conjunction with statistical data, it is possible to develop effective strategies for managing and conserving mangrove ecosystems in Medan City. Mangrove forests are not only important for their role in providing a habitat for wildlife, storing blue carbon in sediment, and protecting the shoreline, but they also act as a green lung for the coastal areas in the north of Medan City. This means that they play a vital role in purifying the air and improving the local climate.
Figure 9. Map of mangrove forest cover change from 2005 to 2011.
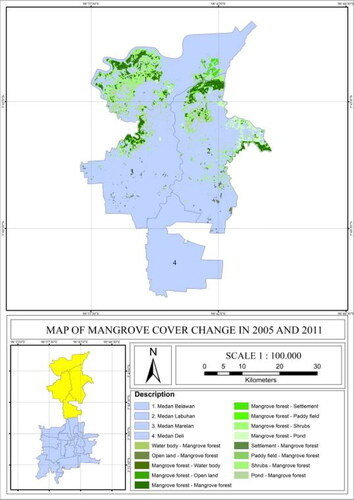
Figure 10. Map of mangrove forest cover change from 2005 to 2015.
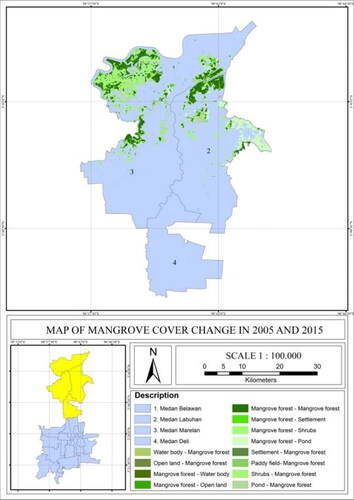
Figure 11. Map of mangrove forest cover change from 2005 to 2019.

Figure 12. Map of mangrove forest cover change from 2011 to 2015.
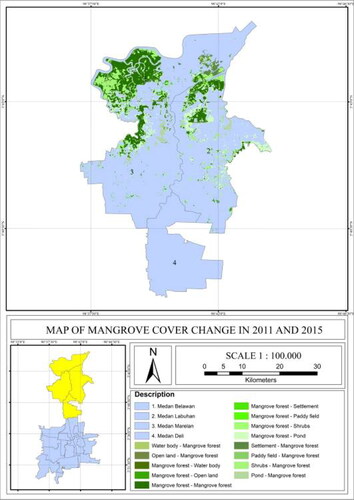
Figure 13. Map of mangrove forest cover change from 2011 to 2019.
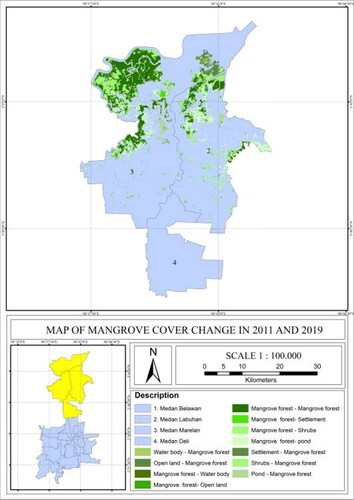
Figure 14. Map of mangrove forest cover change from 2015 to 2019.
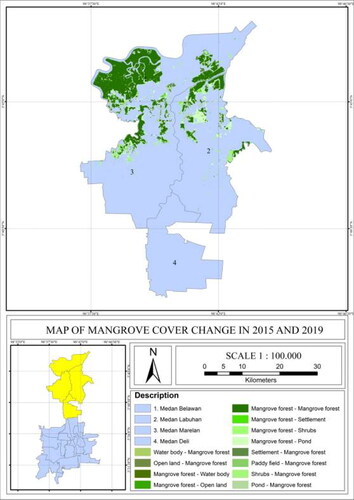
Table 9. Matrix of changes in mangrove forest cover from 2005 to 2011.
Table 10. Matrix of changes in mangrove forest cover from 2005 to 2015.
Table 11. Matrix of changes in mangrove forest cover from 2005 to 2019.
Table 12. Matrix of changes in mangrove forest cover from 2011 to 2015.
Table 13. Matrix of changes in mangrove forest cover from 2011 to 2019.
Table 14. Matrix of changes in mangrove forest cover from 2015 to 2019.
and provide information on the changes in mangrove cover in Medan City from 2005 to 2011 and 2005 to 2015, respectively. In , it can be seen that out of the total mangrove cover in 2005, approximately 54.05% remained in 2011. The rest of the mangroves changed into water bodies, open land, settlements, shrubs, and ponds. The most extensive change occurred in the shrub and pond categories, with 183.84 ha and 166.64 ha of mangroves changing into these land uses, respectively. However, there was also a significant increase in mangrove cover, with 750.92 ha of shrubs and 355.47 ha of ponds turning into mangroves.
shows similar trends in mangrove cover changes from 2005 to 2015. Approximately 66.19% of mangrove cover remained, while the rest changed into water bodies, open land, settlements, shrubs, and ponds. The most extensive change occurred in the pond category, with 275.61 ha of mangroves changing into ponds. However, there was also a significant increase in mangrove cover, with 830.98 ha of shrubs and 246.61 ha of ponds turning into mangroves. These tables provide valuable information on the changes in mangrove cover over time and can be used to develop effective strategies for managing and conserving mangrove ecosystems in Medan City. By analyzing the data provided in these tables, city planners and decision-makers can gain a better understanding of the factors contributing to these changes and develop policies and interventions to protect and restore mangrove ecosystems.
shows that from 2005 to 2019, approximately 62.11% of mangrove cover remained, while approximately 37.89% of mangroves turned into water bodies, open land, settlements, and shrub. The most extensive conversion was into a pond, which amounted to 296.66 ha. However, there were also positive changes, with 828.50 ha of shrub becoming mangrove, and 247.26 ha of pond transforming into mangrove.
In the four Land Uses from 2011 to 2015, approximately 60.50% of mangrove cover remained, while approximately 39.50% of mangrove turned into water bodies, open land, settlement, shrub, and pond. The most extensive conversion was into a pond, which amounted to 485.11 ha. However, there were also positive changes, with 386.24 ha of shrub turning into mangrove, and 173.61 ha of pond becoming mangrove.
During the eight Land Uses from 2011 to 2019, mangrove cover remained constant at 55.44%, while 44.56% turned into water body, open land, settlement, shrub, and pond. The conversion of mangrove into pond in this period was 515.18 ha. These statistics provide valuable information on the changes in mangrove cover over time and can be used to develop effective strategies for managing and conserving mangrove ecosystems in Medan City.
In 4 Land Uses (from 2015 to 2019), mangrove cover remained constant (78.16%), and 21.84% turned into water body, open land, settlement, shrub, and pond. The conversion of mangrove into pond in this period is 249.42 ha ().
The conversion of land use and land cover (LULC) in the north of Medan City, especially mangroves, is primarily driven by economic activities in the area. This can be seen in , which shows the condition or conversion of mangrove cover to other land use in the Belawan Sub-district. However, it is important to determine the rate and capacity of changes in mangroves that are economically oriented, as this can support sustainable management plans for regulating the district’s priority land development, natural resource conservation, and ecology stabilization. One effective strategy to overcome the problem and impact of changing mangrove forest cover in Medan City is to plant trees. Trees play a critical role in mitigating the effects of climate change, as research has shown (Rahmawaty et al. Citation2016, Citation2017a, Citation2017b; Sharma et al. Citation2014). Additionally, planting trees is an important part of the green city initiative, as suggested by research (Gupta et al. Citation2020; Biswas & Ghosh, Citation2022; Pandey et al. Citation2022). The mangrove forests in Medan Belawan, Medan Marelan, and Medan Labuhan sub-districts are essential in mitigating the effects of climate change, supporting biodiversity, and providing livelihoods for local communities. Therefore, it is crucial to protect and conserve these mangrove forests, as they are vital in maintaining the health and well-being of the environment and the people who depend on them. To reduce the impact of climate change, efforts can be made to reduce the rate of deforestation and forest degradation, in addition to planting trees.
Figure 15. Changes or conversion of mangrove cover to other land use in Belawan Sub-district: a- settlements, b, c- pond.
Priority factors to prevent changes in mangrove cover using AHP
To deal with the problem of changing mangrove land cover, it is important to identify and evaluate different alternatives that can help address the underlying causes of this issue. In order to do this, a set of criteria is needed to assess the effectiveness of each alternative. The criteria can be broadly categorized into three factors: ecological, economic, and social. The ecological factor considers the impact of the alternative on the environment, such as the ability to restore and maintain mangrove ecosystems. The economic factor considers the cost-effectiveness of the alternative, such as the ability to generate income and employment opportunities. The social factor considers the impact of the alternative on the local community, such as the ability to improve the quality of life and reduce poverty.
Based on the AHP analysis, four alternatives have been identified as the most effective solutions to the problem of changing mangrove land cover. The first alternative is to increase job opportunities, which can help reduce the pressure on mangrove ecosystems by providing alternative livelihoods for local communities. The second alternative is to review spatial planning in relation to the size of mangroves, which can help ensure that mangroves are protected from development and other activities that may harm their ecosystems. The third alternative is to tackle issues of poverty and knowledge, which can help improve the socio-economic conditions of local communities and increase their awareness of the importance of mangrove conservation. The fourth alternative is to establish policies and regulations concerning mangroves, which can help ensure that these ecosystems are protected and conserved for future generations. Overall, these alternatives are important steps towards managing and conserving mangrove ecosystems in Medan City, and they can help decision-makers and stakeholders make informed decisions about the management and conservation of mangroves.
The priority level of criteria and alternatives to prevent changes in mangrove cover using AHP in northern part of Medan City is presented in and .
Table 15. Priority level of criteria to prevent changes in mangrove cover using AHP.
Table 16. Priority level of alternatives to prevent changes in mangrove cover using AHP.
In analyzing changes in mangrove cover in Medan City, indicates that the most important criterion is the economy, followed by social and ecological factors. This means that economic considerations should be given the highest priority when making decisions related to mangrove management and conservation. This is particularly relevant in Medan City, where rapid economic transformation has led to the degradation of mangrove forests in several sub-districts. While economic growth is important, it is also crucial to consider social and ecological factors to ensure that mangrove management and conservation are sustainable and do not harm local communities or the environment. Research from Rahmawaty et al. (Citation2016) and Sitanggang et al. (Citation2021) supports this, highlighting the need for a balanced approach that takes into account the economic, social, and ecological aspects of mangrove management and conservation in Medan City.
The mangrove forests in the district were transformed into settlements and fish ponds, with some of the changes occurring through illegal logging (Norida and Chinsu Citation2017). This has led to the destruction of the coastal ecosystem and has negatively impacted the economic returns of coastal fishermen. The loss and degradation of mangroves have also contributed to the decline of biodiversity and have worsened the effects of climate change. Therefore, it is crucial for all parties to participate in maintaining the mangrove ecosystem in Medan City (Mensah et al. Citation2019; Rahmawaty et al. Citation2022a). The preservation of mangrove forests should be considered as essential for both environmental protection and the socio-economic well-being of local communities. To increase the income of local communities, Silvofishery and Agrosilvofishery systems can be implemented. Additionally, community-based mangrove ecotourism can be developed to enhance the value of mangrove areas.
According to the information presented in , the most effective ways to prevent changes in mangrove cover in Medan City using AHP are ranked as follows: the top priority is to increase job opportunities, followed by addressing poverty and knowledge issues, establishing policies and regulations concerning mangroves, and reviewing spatial planning in relation to the size of mangroves. The reason why increasing job opportunities is ranked first is that it can help reduce poverty and improve the economic conditions of local communities, which in turn can reduce their dependence on mangrove resources and alleviate the pressure on mangroves. The second priority is to address poverty and knowledge issues, which are closely related to job opportunities, and can improve the quality of life of local communities, increase their awareness of the importance of mangroves, and reduce their dependence on mangroves. The third priority is to establish policies and regulations concerning mangroves, which can help prevent overexploitation and degradation of mangrove ecosystems. The fourth priority is to review spatial planning in relation to the size of mangroves, which can help prevent encroachment and destruction of mangrove ecosystems during the city planning and development process. Overall, the AHP analysis suggests that a comprehensive and integrated approach is necessary to address the factors contributing to mangrove changes in Medan City. By prioritizing and ranking different strategies based on their effectiveness and feasibility, decision-makers and stakeholders can make informed decisions about the management and conservation of mangrove ecosystems.
As support from the government of Medan City through the Medan City Tourism Office to support Mangrove management, then in 2015, in the Sicanang Village. Medan Belawan District was built Mangrove Ecotourism. The Medan city government is very supportive of the management of mangrove forest areas because it views conservation efforts as well as empowering mangrove forests in the northern suburbs of Medan as important. Apart from preserving mangrove forests which function to prevent abrasion, the presence of mangrove ecotourism is currently also one of the mainstay natural tourist destinations in the city of Medan. Relevant regional apparatus organizations (OPD) within the Medan city government were also involved to support mangrove management. Mangrove planting activities are now often carried out by several institutions, both government, academics, NGOs, and the Watershed forum by involving the local community. Reforestation-Afforestation activities are the dominant factor affecting the regrowth of mangroves in Medan City. this is supported by several previous researchers (Rahmawaty et al. Citation2018, Citation2022a, Citation2022b; Castillo et al. Citation2021; Jayanthi et al. Citation2018; Nursamsi and Komala Citation2017).
Gupta et al. (Citation2020), Biswas and Ghosh (Citation2022), and Pandey et al. (Citation2022) have all agreed that restoring secondary mangrove forests and reforestation in Medan City can contribute to global and national efforts to combat climate change. The current policies estimate that global greenhouse gas (GHG) emissions in 2030 will be around 58 GtCO2e, which is higher than the Nationally Determined Contributions (NDCs) unconditionally by 3 GtCO2e and 6 GtCO2e for the conditional NDCs. To reach the 2 °C pathway, there is an emissions gap of 15 GtCO2e annually, and for a 1.5 °C path, the gap is 23 GtCO2e (United Nations Environment Programme Citation2022). Therefore, more ambitious commitments are needed from developed and developing countries, including Indonesia. Indonesia has submitted a series of NDCs and Long-Term Strategy for Low Carbon and Climate Resilience (LTS-LCCR) to the United Nations Convention Framework on Climate Change (UNFCCC), which includes achieving Net Zero Emission (NZE) by 2060 or sooner and Net-sink Forestry and Other Land Uses (FOLU) In by 2030. To achieve the FOLU targets by 2030, the Indonesian government is focusing on emissions mitigation from peat decomposition, deforestation, forest fire, and increasing efforts on carbon sequestration through secondary forest regeneration, timber plantation, perennial crops planting, and reforestation/afforestation without rotation (Fu et al. Citation2017; Ministry of Environment and Forestry of the Republic of Indonesia Citation2021).
Conclusion
The sub-districts of Medan Belawan, Medan Marelan, and Medan Labuhan are home to a large area of mangrove forests, covering approximately 1682.33 hectares in 2019. These mangroves are vital for mitigating climate change, providing habitats for flora and fauna, and supporting local communities. Unfortunately, human activities and natural causes have led to a decrease in mangrove coverage in these areas, with 755.83 hectares lost between 2005 and 2019. The economy is the most important criterion for mangrove management and conservation, followed by social and ecological factors. The top-ranked alternative for preventing changes in mangrove cover is to increase job opportunities, followed by addressing poverty and knowledge, establishing policies and regulations, and reviewing spatial planning. To address this issue, there needs to be a coordinated effort between the Medan City government, local communities, and conservation organizations to promote sustainable land use practices, reduce pollution, and restore degraded mangrove forests. This will help to conserve the mangrove forests and their valuable services to the environment and local communities in the North Sumatra Provincial government. The study can be used as a reference map for future studies and provide useful ecological and environmental information for the sustainable development of Medan City.
Author contributions
Rahmawaty; designing the study, conceptualization, methodology, data analysis, writing original draft, supervision, funding acquisition: J. Siahaan; data collection, data analysis: A. Nuryawan; designing the study, methodology, data analysis, supervision, funding acquisition: M.M. Harahap; correction of data analysis, project administration, software, supervision, funding acquisition: M.H. Ismail; supervision, data analysis, writing original draft: A. Rauf; supervision, conceptualization, methodology, data analysis: H. Kurniawan; methodology, data analysis, software: S. Gandaseca; designing the study, methodology, funding acquisition: M. Karuniasa; data analysis, writing original draft.
Disclosure statement
No potential conflict of interest was reported by the author(s).
Additional information
Funding
References
- Abdullahi S, Pradhan B, Mansor S, Shariff ARM. 2015. GIS-based modeling for the spatial measurement and evaluation of mixed land use development for a compact city. GISci Remote Sens. 52(1):18–39. doi: 10.1080/15481603.2014.993854.
- Alongi DM. 2018. Impact of global change on nutrient dynamics in Mangrove Forests. Forests. 9(10):596. doi: 10.3390/f9100596.
- Alphan H, Güvensoy L. 2016. Detecting coastal urbanization and land use change in Southern Turkey. J Environ Engin Landscape Manage. 24(2):97–107. doi: 10.3846/16486897.2015.1113976.
- Assaf C, Adams C, Ferreira FF, França H. 2021. Land use and cover modeling as a tool for analyzing nature conservation policies – a case study of Juréia-Itatins. Land Use Policy. 100:104895. doi: 10.1016/j.landusepol.2020.104895.
- Avtar R, Navia M, Sassen J, Fujii M. 2021. Impacts of changes in mangrove ecosystems in the Ba and Rewa deltas, Fiji using multi-temporal Landsat data and social survey. Coastal Eng J. 63(3):386–407. doi: 10.1080/21664250.2021.1932332.
- Biswas S, Ghosh S. 2022. Estimation of land surface temperature in response to land use/land cover transformation in Kolkata city and its suburban area, India. Int J Urban Sci. 26(4):604–631. doi: 10.1080/12265934.2021.1997633.
- Castillo YB, Kim K, Kim HS. 2021. Thirty-two land uses of mangrove forest land cover change in Parita Bay, Panama Thirty-two Land Uses of mangrove forest land cover change in Parita, (May). doi: 10.1080/21580103.2021.1922512.
- Degife AW, Zabel F, Mauser W. 2018. Assessing land use and land cover changes and agricultural farmland expansions in Gambella Region, Ethiopia, using Landsat 5 and Sentinel 2a multispectral data. Heliyon. 4(11):e00919. doi: 10.1016/j.heliyon.2018.e00919.
- Dynamics F, Landsat U, Series T, Sens R. 2023. Correction: Erfanifard et al. Assessment of Iran’s Mangrove Forest Dynamics (1990–2020) Using Landsat Time Series. Remote Sens. 2022, 14:1430.
- Fauzi A, Sakti A, Yayusman L, Harto A, Prasetyo L, Irawan B, Kamal M, Wikantika K. 2019. Contextualizing mangrove forest deforestation in southeast Asia using environmental and socio-economic data products. Forests. 10:1–18.
- Fu B, Wu M, Che Y, Yang K. 2017. Effects of land-use changes on city-level net carbon emissions based on a coupled model. Carbon Manage. 8(3):245–262. doi: 10.1080/17583004.2017.1314704.
- Foody GM. 2020. Explaining the unsuitability of the kappa coefficient in the assessment and comparison of the accuracy of thematic maps obtained by image classification. Rem Sens Environ. 239(2020):111630. doi: 10.1016/j.rse.2019.111630.
- Gevana D, Camacho L, Carandang A, Camacho S, Im S. 2015. Land use characterization and change detection of a small mangrove area in Banacon Island, Bohol, Philippines using a maximum likelihood classification method. Forest Sci Technol. 11(4):197–205. doi: 10.1080/21580103.2014.996611.
- Giri C, Long J. 2016. Is the geographic range of mangrove forests in the conterminous united states really expanding? Sensors. 16(12):2010. doi: 10.3390/s16122010.
- Gupta N, Mathew A, Khandelwal S. 2020. Spatio-temporal impact assessment of land use/land cover (LU-LC) change on land surface temperatures over Jaipur city in India. International Journal of Urban Sustainable Development. 12(3):283–299. doi: 10.1080/19463138.2020.1727908.
- Harahap MM, Poedjirahajoe E, Santosa SHMB, Ulfa M. 2021a. Assessment of five-Land use vegetation cover changes to support green open spaces monitoring in Surakarta, Central Java, Indonesia. J Sylva Indonesiana. 4(02):87–95. doi: 10.32734/jsi.v4i02.6496.
- Harahap MM, Poedjirahajoe E, Santosa SHMB, Wirabuana PYAP. 2022. Analysis of correlation between vegetation cover density and urban index in Surakarta to support urban area sustainability. IOP Conf Ser Earth Environ Sci. 977(1):012107. doi: 10.1088/1755-1315/977/1/012107.
- Harahap MM, Rahmawaty, Kurniawan H, Rauf A, Ulfa M. 2021b. Land cover changes monitoring over ten land uses in upstream watershed of Deli Serdang Regency North Sumatra Province. IOP Conf Ser Earth Environ Sci. 912(1):012093. doi: 10.1088/1755-1315/912/1/012093.
- Huo J, Shi Z, Zhu W, Chen X, Xue H, Ma R, Yan Y. 2022. Delineation of the development boundary of the central district of Zhengzhou, China. Land. 11(9):1393. doi: 10.3390/land11091393.
- ITTO. 2005. Status of tropical forest management 2005. ITTO.
- Jayanthi M, Thirumurthy S, Nagaraj G, Muralidhar M, Ravichandran P. 2018. Spatial and temporal changes in mangrove cover across the protected and unprotected forests of India. Estuarine Coastal Shelf Sci. 213:81–91. doi: 10.1016/j.ecss.2018.08.016.
- Kanth TA, Hassan ZU. 2010. Assessment of land use/land cover change in Wular catchment using remote sensing and GIS. Trans Inst Indian Geogr. 32(1):53–62.
- Kidane M, Bezie A, Kesete N, Tolessa T. 2019. The impact of land-use and land cover (LULC) dynamics on soil erosion and sediment yield in Ethiopia. Heliyon. 5(12):e02981. doi: 10.1016/j.heliyon.2019.e02981.
- Lilliesand T, Dan Kiefer R. 1979. Remote sensing and image interpretation. New York: John Wiley and Sons.
- Long JB, Giri C. 2011. Mapping the Philippines’ mangrove forests using landsat imagery. Sensors. 11(3):2972–2981.
- Magpantay AT, Sanchez PAJ, Sobremisana MJ, Tiburan CL. 2019. Land use and land cover (LULC) change impact assessment on surface runoff responses of Santa Cruz watershed, Philippines. Int J Soc Social Manage Syst. 12:60–71.
- Marchio DA, Savarese M, Bovard B, Mitsch WJ. 2016. Carbon sequestration and sedimentation in mangrove swamps influenced by hydrogeomorphic conditions and urbanization in Southwest Florida. Forests. 7(12):116.
- Mensah CA, Eshun JK, Asamoah Y, Ofori E. 2019. Changing land use/cover of Ghana’s oil city (Sekondi-Takoradi Metropolis): implications for sustainable urban development. Int J Urban Sustain Dev. 11(2):223–233. doi: 10.1080/19463138.2019.1615492.
- Myint SW, Chandra G, Wang L, Gillette SC, Wang L. 2013. Identifying mangrove species and their surrounding land use and land cover classes using an object-oriented approach with a lacunarity spatial measure. GISci Remote Sens. 45(2):188–208. doi: 10.2747/1548-1603.45.2.188.
- Ministry of Environment and Forestry of the Republic of Indonesia. 2021. Long-Term Strategy for Low Carbon and Climate Resilience 2050 (Indonesia LTS-LCCR 2050). Climate Policy.
- Nguyen HTT, Hardy GES, Van LT, Nguyen HQ, Nguyen HH, Nguyen TV, Dell B. 2021. Mangrove forest land cover changes in coastal Vietnam: a case study from 1973 to 2020 in Thanh Hoa and Nghe An Provinces. Forests. 12(5):637. doi: 10.3390/f12050637.
- Norida M, Chinsu L. 2017. Exploring changes of land use and mangrove distribution in the economic area of Sidoarjo District, East Java using multi-temporal Landsat images. Inform Proces Agric. 4:321–332.
- Nurda N, Noguchi R, Ahamed T. 2020. Change-detection and land suitability analysis for extension of potential forest areas in Indonesia using satellite remote sensing and GIS. Forests. 11(4):398. doi: 10.3390/f11040398.
- Nursamsi I, Komala WR. 2017. Assessment of the successfulness of mangrove plantation program through the use of open source software and freely available satellite. Nusantara Biosci. 9(3):251–259. doi: 10.13057/nusbiosci/n090303.
- Pandey A, Mondal A, Guha S, Pradeep Kumar Upadhyay PK, Singh D. 2022. Land use status and its impact on land surface temperature in Imphal City, India. Geol Ecol Landscapes. doi: 10.1080/24749508.2022.2131962.
- Peneva-reed, E. 2014. Understanding land-cover change dynamics of a mangrove ecosystem at the village level in Krabi Province, Thailand, using Landsat data. GISci Remote Sens. 51(4):403–426. doi: 10.1080/15481603.2014.936669.
- Pothier, AJ, Millward, AA. 2013. Valuing trees on city-centre institutional land: an opportunity for urban forest management. J Environ Plan Manage. 56(9):1380–1402. doi: 10.1080/15481603.2014.936669.
- Purwanto AD, Wikantika K, Deliar A, Darmawan S. 2023. Decision tree and random forest classification algorithms for mangrove forest mapping in Sembilang National Park, Indonesia. Remote Sens. 15(1):16.
- Rahmawaty, Rauf A, Harahap MM, Kurniwan H. 2022a. Land cover change impact analysis: an integration of remote sensing, GIS and DPSIR framework to deal with degraded land in Lepan Watershed, North Sumatera, Indonesia. Biodiversitas. 23(6):3000–3011. doi: 10.13057/biodiv/d230627.
- Rahmawaty, Rauf A, Harahap MM, Kurniawan H. 2022b. Analysis of land-use change over five- and ten- Land Use periods in Hamparan Perak, North Sumatra, Indonesia. Geocarto Int. 37(27):15037–15062. doi: 10.1080/10106049.2022.2093991.
- Rahmawaty, Marpaung RME, Batubara R, Rauf Z. 2022c. Analytical hierarchy process (ahp) application in the selection of plant types on the community’s agroforestry land. IOP Conf Ser Earth Environ Sci. 959(1):012008. doi: 10.1088/1755-1315/959/1/012008.
- Rahmawaty, Harahap MM, Kurniawan H, Mandasari D. 2021a. DPSIR model approach to address land-use changes in Deli Serdang District, North Sumatera Province. IOP Conf Ser Earth Environ Sci. 724:012028.
- Rahmawaty, Harahap MM, Kurniawan H, Rauf A. 2021b. Land use changes monitoring over a period of ten land uses in Panjang Island, Pangkalan Susu, Langkat, North Sumatra. IOP Conf Ser. Earth Environ Sci. 782(3):032008. doi: 10.1088/1755-1315/782/3/032008.
- Rahmawaty, Harahap MM, Rauf A, Kurniawan H. 2021c. Changes in dryland-forest cover in several sub-districts in Deli Serdang Regency. IOP Conf Ser Earth Environ Sci. 752(1):012041. doi: 10.1088/1755-1315/752/1/012041.
- Rahmawaty, Frastika S, Rauf A. 2019a. Spatial analysis for Pinus merkusii land suitability at agroforestry land in Telagah Village Sumatera Utara Indonesia, in. IOP Conf Ser Mater Sci Eng. 593:012017. doi: 10.1088/1757-899X/593/1/012017.
- Rahmawaty, Sembiring IEP, Batubara R, Patana P. 2018. Mapping of tree damage classification in the western part of Medan city green belts using geographic information system. IOP Conf Ser Earth Environ Sci. 166:012020. doi: 10.1088/1755-1315/166/1/012020.
- Rahmawaty, Patana P, Latifah S. 2017a. Spatial analysis on distribution of green belt to reduce impacts of climate change in Medan city, North Sumatra. Malay Appl Biol. 46:67–76.
- Rahmawaty, Sitorus NA, Rauf A. 2017b. Distribution, above-ground biomass and carbon stock of the vegetation in Taman Beringin Urban Forest, Medan City, North Sumatra, Indonesia. Malay For. 80:73–84.
- Rahmawaty, Khairat N, Rauf A. 2016. Integrated approach as an effort to climate change mitigation in land-use change assessment. Paper presented at: Proceedings of the National Seminar on Strengthening Climate Change Teaching and Research: Bridging Gap Implementation of Mitigation and Adaptation Policies at National and Subnational Levels; Jakarta, Indonesian.
- Rahmawaty,Sari EK, Syofyan A, Rauf A. 2015. Integrated geographic information system and global positioning system for mapping of forest plants in supporting natural resources protection. Procedia Chem. 14:334–342 doi: 10.1016/j.proche.2015.03.046.
- Saaty TL. 2008. Decision making with the analytic-hierarchy-process. Int J Serv Sc. 1(1):83–98.
- Saaty TL, Vargas G. 2012. The seven pillars of the analytic-hierarchy-process, models, methods, concepts & applications of the analytic hierarchy process. Int Ser Operat Res Manage Sci. 175:27–46. doi: 10.1007/978-1-4614-3597-6_2.
- Schaefer M, Thinh NX. 2019. Evaluation of land cover change and agricultural protection sites: a GIS and Remote Sensing approach for Ho Chi Minh City, Vietnam. Heliyon. 5(5):e01773. doi: 10.1016/j.heliyon.2019.e01773.
- Sharma S, Pandey D, Agrawal M. 2014. Changing land uses and greenhouse gas emissions: a case study of an ancient city in India. Greenhouse Gas Measure Manage. 4(1):49–58. doi: 10.1080/20430779.2013.872535.
- Sitanggang RF, Rahmawaty, Zaitunah A. 2021. Application of analytical hierarchy process in implementation of community forest management permit work plan. IOP Conf Ser Earth Environ. Sci. 912(1):012048. doi: 10.1088/1755-1315/912/1/012048.
- United Nations Environment Programme. 2022. Emissions Gap Report 2022: the Closing Window – climate crisis calls for rapid transformation of societies – executive summary; Nairobi. https://www.unep.org/resources/emissions-gap-report-2022.
- Zhen J, Liao J, Shen G. 2018. Mapping mangrove forests of Dongzhaigang nature. Sensors. 18(11):4012. doi: 10.3390/s18114012.