
 ?Mathematical formulae have been encoded as MathML and are displayed in this HTML version using MathJax in order to improve their display. Uncheck the box to turn MathJax off. This feature requires Javascript. Click on a formula to zoom.
Abstract
High-resolution aerosol products offer advantages over lower spatial-resolution products for monitoring pollution in urban areas and industrial zones. Therefore, in this study we develop a Landsat 8 algorithm to retrieve aerosol optical depth (AOD) based on the MODIS Dark Target (DT) algorithm. This algorithm uses the direct surface reflectance of Landsat 8 to build a surface reflectance relationship between the visible (BLUE, RED) and short-wave infrared bands (SWIR2). AOD data from AERONET stations in the study area and AOD data from MODIS 3 km were used for validation of the estimated Landsat 8 AOD. The estimated AOD was highly correlated at most AERONET AOD, with =0.98, (RMSE = 0.3), except Bac Lieu, but only had a moderate correlation with MODIS AOD which was attributed to the difference in data retrieval time and associated changes in climate conditions. This is the first high-resolution AOD retrieval in Vietnam, leading to more practical applications for air quality monitoring.
1. Introduction
Aerosols are small solid or liquid particles suspended in the atmosphere with diameters ranging from to
micrometers. They are created by natural or human activities and have diverse characteristics (Kaufman, Tanré, et al. Citation1997). Aerosols play an important role in radiation, climate change, air quality and the absorption and scattering of sunlight to the ground and they have a serious effect on human health (Ramanathan et al. Citation2001; Kaufman et al. Citation2002; Li et al. Citation2011). In order to fully understand the effects of aerosol particles, it is necessary to have an efficient way of observing aerosols. The AOD is an important parameter used to estimate the aerosol amount in the atmosphere (Clarke et al. Citation2001; Holben et al. Citation2001). AOD (Aerosol Optical Depth) is the sum extinction of both scattering and absorption of solar light due to aerosol particles (Van de Hulst Citation1948; Hansen and Travis Citation1974). Currently, remote sensing technology is widely used to monitor the aerosol’s spatial and temporal distribution from small to global scales and to study their physical and chemical properties.
Several algorithms have been developed based on different physical principles to separate the effects of the surface and atmosphere on different sensors. In the mid-1970s, remote sensing technology for aerosols were initiated and properties of dust particles over the ocean were retrieved using the Landsat and NOAA-POES/GOES (Fraser Citation1976; Norton et al. Citation1980). The optical properties of the aerosol are retrieved using NOAA high-resolution radiometers (Hauser et al. Citation2005; Li et al. Citation2013; Mei et al. Citation2013), Total Ozone Mapping Spectrometer (TOMS) (Herman et al. Citation1997; Torres et al. Citation2002), Polarization and Directionality of the Earth’s Reflectance (POLDER) (Leroy et al. Citation1997), Multi-angle Imaging Spectro-Radiometer (Kahn et al. Citation2005), Sea-Viewing Wide Field-of-View Sensor (Sayer et al. Citation2012), MODerate resolution Imaging Spectrometer (MODIS) (Kaufman, Wald, et al. Citation1997; Hsu et al. Citation2004, Citation2006; Levy, Remer, Mattoo, et al. Citation2007), and Visible/Infrared Imager Radiometer Suite (VIIRS) (Jackson et al. Citation2013; Zhang et al. Citation2016) on both land and ocean. The main goal of satellite aerosol remote sensing is to retrieve optical properties between the top of the atmosphere (TOA) and the surface from the satellite signals, including atmospheric path reflectance and surface reflectance. Therefore, an important step in the development of an aerosol retrieval algorithm is to estimate surface reflectance. Satellite remote sensing technologies are used to estimate surface reflectance on both dark targets (Kaufman, Wald, et al. Citation1997; Levy, Remer, Mattoo, et al. Citation2007; Levy et al. Citation2010) and bright surfaces (Hsu et al. Citation2004, Citation2006).
MODIS AOD products (MOD04/MYD04) have been offering daily global AOD distribution at a resolution of 10 km and 3 km and are suitable for studies of aerosol distribution on a global scale. Nonetheless, due to its low spatial resolution, MOD04 AOD products are limited in regards to applications in monitoring air quality and spatial variation of atmospheric pollutants at the city level or other small areas (Li et al. Citation2005; Bilal et al. Citation2013; Bilal et al. Citation2014; Sun et al. Citation2017).
(Martin Citation2008) listed the development of space-resolution products, specifically for use in urban areas, as an important recommendation for future studies, and (Gupta et al. Citation2006) argued that their studies in city areas were limited by the low resolution of MODIS data. Many researchers have been studying aerosols and urban atmospheres and many high-resolution AOD retrieval algorithms have been developed for MODIS (Li et al. Citation2005; Oo et al. Citation2010; Lyapustin et al. Citation2011; Bilal et al. Citation2013; Li L et al. Citation2014), VIIRS (Zhang et al. Citation2016; Wang et al. Citation2017), Landsat (Luo et al. Citation2015; Sun et al. Citation2015) and other satellites. The spatial resolution of AOD retrieval algorithms has changed from 10 km to 3 km (Oo et al. Citation2010; Remer et al. Citation2013) to 1 km (Li et al. Citation2005; Oo et al. Citation2010; Lyapustin et al. Citation2011) to 500 m (Bilal et al. Citation2013; Li L et al. Citation2014), and 30 m (Luo et al. Citation2015; Wei et al. Citation2017; Zhong et al. Citation2017).
Some other studies have developed AOD retrieval algorithms for Landsat 8 using different methods. These include a method based on reliable surface reflectance monitoring and aerosol type assumption, which are two key factors that determine the accuracy of AOD retrievals (Lin et al. Citation2021); a method that constructs an LSR database using the MODIS surface reflectance product (MOD09A1) to estimate the LSR of Landsat 8 OLI images (Sun et al. Citation2016) and a method that estimates surface reflectance based on multiyear MODIS bidirectional reflectance distribution function (BRDF)/Albedo model parameters product (MCD43A1) and the RossThick-LiSparse reciprocal kernel-driven BRDF model (Tian et al. Citation2018)
(Chudnovsky et al. Citation2013) found that there was a considerably positive relationship between AOD data resolution and the fitness of linear regression between AOD and with
being 0.46 for 1 km AOD data, compared to 0.18 for 10 km AOD data. Furthermore, there were little cloud pollution issues for high-resolution data (Henderson and Chylek Citation2005). (Chudnovsky et al. Citation2013) found that higher resolution AOD offered an increase in available data of 50–70% due to fewer pixels obscured by clouds as well as a reduction in error due to negatives in cloud filtration. The relationship between satellite-derived aerosol optical depth (AOD) and ground-based near-surface particle matter concentration (PM2.5) has been studied in terms of the spatial resolution of satellite observations. By analyzing additional datasets, several quantities closely related to the AOD-PM2.5 correlation have been identified. With consistent correlation increments when the resolution is increased from 10 to 1 km, it is concluded that the PM2.5 prediction accuracy would likely continue to increase if AOD at an even higher spatial resolution were available (Mei et al. Citation2019)
The development of an algorithm to retrieve aerosols from high-resolution satellite imagery, especially of urban areas, to monitor air quality is necessary but also challenging for scientists. Currently, there are no studies related to the construction of an aerosol retrieval algorithm applied to high-resolution satellites in Vietnam. In this study, we applied the MODIS DT (Dark Target) algorithm to Landsat 8 imagery to build an algorithm to retrieve AOD data with 30 m spatial resolution. Based on the method of the DT algorithm for the MODIS data, we built a new surface reflectance relationship between the visible channels (BLUE-RED) and SWIR2 (Short-wave infrared 2) channels of the Landsat 8 satellite surface reflectance data, along with the Fmask algorithm applied to Landsat 8 to increase accuracy in the filtering cloud, cloud shadows and water in the aerosol retrieval. We also used the Aster digital elevation model for elevation correction in the algorithm.
2. Study area
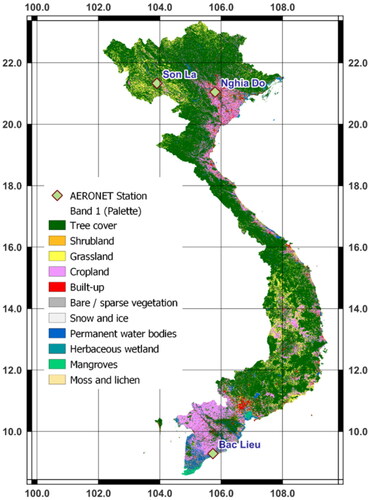
With the method for building the algorithm in this paper, we can apply to retrieve AOD over land, unrestricted by geographical factors as well as the climate. However, in this study, we selected locations with AERONET stations inside the study area – Vietnam, namely: Son La, Hanoi, Bac Lieu (). These areas all have complex surface characteristics and include many different types of land use. Areas with dense vegetation coverage include forests and agricultural crop areas. Bright areas are sparsely covered plant soil surfaces with high surface reflections (urban, open land, arid/semi-arid areas or deserts). In particular, Hanoi is a bright urban area with a dense population density and extensive industrial activities. Unusual changes in land use present a challenge for estimating surface reflectance, which is the main factor influencing AOD retrieval from remote sensing data.
Figure 1. Study area in Vietnam mainland (ESA WorldCover (zanaga et al. Citation2022)).
3. Data
3.1. AERONET Level 2.0 – version 3 data
AERONET is a network of ground aerosol remote sensing stations, which provide an observational database of AOD distribution by global spectrum continuously over long periods of time and also allow public access. AERONET contains optical properties of aerosols including size distribution, single scatter reflectivity, symmetrical parameters, phase functions and refractive indicators of reflections in different aerosol regimes (Smirnov et al. Citation2000; Holben et al. Citation2001). AERONET observes AOD in a wide range of visible to near-infrared channels (0.34–1.02 μm) with a time resolution of 15 min and an accuracy of 0.01–0.02. AOD is calculated according to 3 levels of quality: L1.0 (no cloud filtering), L1.5 (cloud filtering), L2.0 (cloud filtering and guaranteed quality). The AERONET V3.0 L1.0 and L1.5 near-real-time (NRT) databases have been available since June 22, 2016. Compared to V2.0, the V3.0 L1.0 product includes new temperature and climatological characteristics from 2004 to 2013 (http://aeronet.gsfc.nasa.gov/new_web/Documents/AERONET_V3_AOD.pdf; AERONET Documents 1997). To evaluate the AOD retrieval algorithm from Landsat 8 in Vietnam, we selected three AERONET stations built in areas with complex surfaces: Son La, Nghia Do and Bac Lieu and collected data in the years from 2014 to 2016. In China, we selected two stations in Beijing and collected data in 2016 to facilitate comparisons with previous research results. The AERONET V3.0 L2.0 product was used to validate this study.
3.2. Landsat 8 OLI level 1
The Landsat program launched satellites from 23 July 1972, which provided the longest-time-series multi-spectral geophysical dataset of the earth’s surface. Landsat 4 and 5 Thematic Mapper (TM), Landsat 7 Enhanced Thematic Mapper Plus (ETM+) and Landsat 8 Operational Land Imager (OLI)/Thermal Infrared Sensor are the three main sensors launched on 01 March 1984, 15 April 1999, and 11 February 2013, respectively. Landsat 8 includes all spectral bands of TM, ETM+ and provides additional coastal bands for coastal area detection and short-wave infrared bands for cloud detection. It also mitigates the steam absorption effect at 0.825 μm and narrows the spectral range in the panchromatic channel to better distinguish plant areas and plant-free areas. The spectral bands of Landsat 8 OLI with wavelength and resolution are shown in . Landsat images are continuously collected, providing a unique resource to support many professionals in the management of agriculture, water, forests and other natural resources and disaster mitigation.
Table 1. Landsat 8 Operational Land Imager (OLI) and thermal infrared sensor (TIRS) bands.
In this study, we collected Landsat 8 OLI – T1 data at 4 locations representing the northern region of Vietnam has two AERONET stations: Son La and Nghia Do, the south of Vietnam is Bac Lieu. Statistics of the data collected is shown in . The data period for regions in Vietnam is from 2014 to 2016. This period is based on the AOD data availability at selected AERONET stations.
Table 2. Landsat 8 Data at AERONET stations.
3.3. MODIS AOD
The AOD product characterizes the clarity of the atmospheric column collected from the MODIS sensors on the Aqua, Terra satellites, launched in 1999 and in 2002, respectively. Both satellites have polar orbits with Terra going from north to south and passing through the equator in the morning, while Aqua travels from south to north and across the equator in the afternoon. The scanning bandwidth of the MODIS sensor is about 2330 km and the orbital period is 16 d. Aqua MODIS and Terra MODIS take 1–2 d to scan the entire earth, collecting data across 36 spectrums or wavelength groups. MODIS AOD estimation algorithm consists of two different algorithms: Dark Target and Deep Blue. Dark Target has separate algorithms for land and ocean, while Deep Blue only estimates AOD on land. The DT algorithm works best on dark plant targets and performs poorly on bright soil surfaces. While Deep Blue works best on bright surfaces and can also retrieve AOD on most plant targets. MODIS Level 2 aerosol products (MOD04/MYD04) offer two types of data with different resolutions of 10 × 10 km (symbols MOD04_L2/MYD04_L2) and 3 × 3 km (MOD04_3K/MYD04_3K)(MOD04_3K),(MYD04_3K). MOD04 aerosol product with a space resolution of 3 × 3 km, which is used for validation, was collected in the years from 2015 to 2018. The products are provided by NASA on the LAADS DAAC (Level-1 and Atmosphere Archive and Distribution System Distributed Active Archive Center) system.
3.4. ASTER DEM
The ASTER instrument (Yamaguchi et al. Citation1998), launched to NASA's Terra satellite in December 1999, is a 14-channel imaging device, with visible-near infrared (VNIR) bands, short-wave infrared and thermal infrared. The ASTER VNIR instrument has two telescopes—one for nadir viewing and another for backward viewing—with a basic ratio to a height of 0.6. The spatial resolution is 15 m in the horizontal plane. One scene consists of 4100 samples × 4200 lines corresponding to about 60 × 60 km of ground area. ASTER captures a stereoscopic pair of images for almost every area scanned during the day.
ASTER GDEM is the most complete, up-to-date digital topographic dataset on Earth covering the global land surface from 83° north latitude to 83° south latitude. ASTER GDEM Version 1 was created using 1,264,000 Level-1A scenes obtained between 01 March 2000 and 30 November 2007. ASTER GDEM was created by stacking all landscape DEM scenes with individual cloud masks and landscape DEM scenes without cloud masks, then applying different algorithms to remove abnormal data (Fujisada et al. Citation2005; Fujisada et al. Citation2011, Citation2012). In 2011, Version 2 was released. Improvements in GDEM2 were the result of obtaining 260,000 additional scenes to improve coverage, smaller correlation nuclei (5 × 5 vs. 9 × 9 for GDEM1) to deliver higher spatial resolution and improved water masks. The negative 5 m overall deviation observed in GDEM1 was removed in the newer version.
In this paper, we collected GDEM2 ASTER data to build a surface elevation model for AOD retrieval.
4. Methodology
4.1. Basic principles of satellite aerosol retrieval
The strategy for retrieving AOD over land from MODIS was introduced by (Kaufman, Wald, et al. Citation1997). The top of the atmosphere reflectance – with
being the solar zenith angle,
being the view zenith angle, and
relative azimuth angle at wavelength λ, can be approximated by:
(1)
(1)
in which:
is the atmospheric ‘‘path reflectance’’
is normalized downward flux for zero surface reflectance
is upward total transmission into the satellite field of view
is the atmospheric backscattering ratio
is the angular surface reflectance.
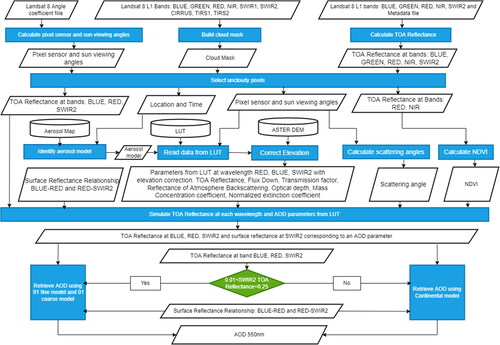
With the exception of surface reflectance, each component in the right-hand side of (1) is a function of aerosol type and aerosol loading. Suppose that a small set of aerosol types and aerosol loading are described on a global scale. The algorithm comes from a LUT containing a simulation that is premeditated in terms of the conditions of this aerosol. The purpose of the algorithm is to use LUT (LookUp Table) to determine the best conditions similar to spectral reflectance and aerosol properties retrieval of the Landsat 8. The difficulty is to make the most appropriate assumption of both surface and atmospheric distribution or in other words to separate the contributions of the atmosphere from the TOA reflectance (Kaufman, Tanré, et al. Citation1997). In the case of Lambertian surfaces is correct for both vertically homogeneous and vertically inhomogeneous medium. The impact of vertical inhomogeneity is small on TOA reflectance simulation for all the selected MERIS wavelengths (Mei et al. Citation2017). The flowchart of the proposed AOD retrieval algorithm is presented in .
Figure 2. Flowchart of Landsat 8 AOD retrieval algorithm.
4.2. Data pre-processing
The input data of the AOD retrieval algorithm is Landsat 8 OLI Level 1 (which includes metadata and containing angular coefficient files) that provide geometrically and radiation-wise calibrated positioning image information for each spectral range. From this data, we built a cloud mask, calculated the viewpoints of the satellite in relation to the sun at each pixel, and reflectance at the top of the atmosphere to provide input data for the retrieval of AOD at each pixel.
4.2.1. Cloud masking
In AOD retrieval algorithms, the best AOD results depend on the ability to ignore inappropriate pixels, including cloudy pixels, snow, and surface water on land. Failure to completely remove these pixels can lead to large errors and insufficient aerosol coverage (Levy et al. Citation2013). Recently, Fmask (Function of Mask) was applied for the detection of clouds, cloud shadows, snow and water on the land surface from Landsat data (Zhu and Woodcock Citation2012; Zhu et al. Citation2015) based on Landsat TOA reflectance, bright temperature and the physical properties of clouds. Fmask first uses the rules to divide Potential Cloud Pixels (PCPs) and clean pixels. Second, standardized temperature probabilities, common variable probabilities, and brightness probabilities are combined to create a probability mask for separate ground and water clouds. Then, the potential cloud mask is created using PCPs and cloud and cloud shadow probability masks are created using flood-fill transformation techniques. Currently, the Fmask algorithm has made several improvements and extensions to the cloud, cloud shadows and snow detection for Landsat 4–8 images, allowing for more accurate results to be produced. Fmask results are recorded as five values from 0 to 5, respectively cloudless, cloudy, cloud shadow, snow and water (Zhu and Woodcock Citation2012; Zhu et al. Citation2015). Fmask is the cloud masking algorithm specifically developed for Landsat 8 images with high accuracy. We applied Fmask (Python Fmask) to identify cloud masks for each Landsat 8 scene, and only cloudless pixels (value = 1) are retained to retrieve AOD.
4.2.2. Calculating sensor and solar angles
According to Formula (1), in order to retrieval AOD from the satellite data, we must determine the views of the sensor and the solar angles (zenith and elevation) at each location. Therefore, we calculated the value of these angles for each Landsat 8 pixel using the Landsat 8 angular calculator tool (Landsat Angles Creation), which creates the view angle of the sensor and the solar per pixel for each Landsat 8 scene (Solar Illumination and Sensor Viewing Angle Coefficient Files). The angular coefficient file in the Landsat 8 L1 data was used as the input for the tool and the output files are matrixes that contain the angle of view of the solar and the angle of view of the sensor.
4.3. Aerosol model identification
Aerosol type describes the aerosol chemical components and optical properties in certain regions, and it is the main parameter that affects the accuracy of AOD retrieval. To improve the accuracy of AOD retrievals from remote sensing data, it is necessary to have a clear and complete understanding of aerosol particles and the appropriate aerosol type. An aerosol model is assigned to each AERONET location (like a seasonal function) and then extrapolated to include the surrounding area. These regions are mapped on a grid of 1° longitude 1° latitude, such that a fine aerosol type is assigned to each grid point globally (Levy, Remer, Dubovik Citation2007). They were integrated according to the distribution size, to determine scatter/extinction properties. From these attributes, the dependence of the spectrum on phase functions and properties was summarized in in Appendix A (Levy, Remer, Mattoo, et al. Citation2007).
Table A1. Listed for each model are the individual Lognormal modes, and the final SSA at different wavelengths.
Table A2. The evaluation results of AOD obtained by 2 methods using NDVI and NDVI SWIR.
4.4. Surface reflectance relationships between BLUE-RED-SWIR2 channels
The DT method estimates surface reflectance on ‘dark’ surfaces, which Levy et al. (Levy, Remer, Mattoo, et al. Citation2007) showed that different surface types represent different ratios between VIS (Visible) bands and SWIR (gradient and intercept regression). (Levy, Remer, Mattoo, et al. Citation2007) introduced the second-generation algorithm for MODIS data (Collection 5), which parameterized the second-generation MODIS Algorithm VIS/SWIR surface reflectivity relationship into the function of both NDVISWIR and scattering angle
(3)
(3)
(4)
(4)
where
(5)
(5)
(6)
(6)
(7)
(7)
(8)
(8)
And
(9)
(9)
(10)
(10)
(11)
(11)
In which, and
are slope and intercept of surface reflectance relationship between 0.66 and 2.12 µm bands, and
and
are slope and intercept of surface reflectance relationship between 0.47 and 0.66 µm channels.
is the scattering angle calculated in Formula (12):
(12)
(12)
With
and
respectively the zenith angle of the solar, the zenith angle of the satellite and the relative azimuth angle.
measures plant coverage affected by aerosols defined in the formula (13)
(13)
(13)
Based on the surface reflectance relationship determination method of the second-generation MODIS algorithm, we selected Landsat 8 data that covers the Hanoi region between 2014 and 2016, specifically of Path/Row 127/045, with little cloud and shadow.
We investigated the relationship between the surface reflectance of bands BLUE, RED and SWIR2 () from the Landsat 8 surface reflectance data of Path/Row = 127/045 dated 18 December 2013. The correlation of bands RED and SWIR2 (R = 0.83) is higher than the correlation of BLUE and SWIR2 (R = 0.81), while BLUE and RED were very strongly correlated (R = 0.88). And referring to Levy’s result (Levy, Remer, Mattoo, et al. Citation2007), correlation values are R = 0.93 for the RED and SWIR2 regression, but only about 0.75 for BLUE and SWIR2. The relationship of BLUE to RED is stronger than BLUE to SWIR2. Our results differ from Levy’s results may be due to the difference in Landsat 8 and MODIS sensors. In addition, we applied surface reflectance evaluation on a specific area corresponding to the experimental scene, while Levy determined surface reflectance globally at AERONET stations based on data from these stations. However, these two results show that we should first estimate RED surface reflectance from SWIR2 surface reflectance, then estimate BLUE surface reflectance from RED surface reflectance .
Figure 3. Comparison surface reflectance at BLUE – RED – SWIR2 bands of Landsat 8. (a) BLUE and SWIR2 bands; (b) RED and SWIR2 bands; (c) BLUE and RED bands.
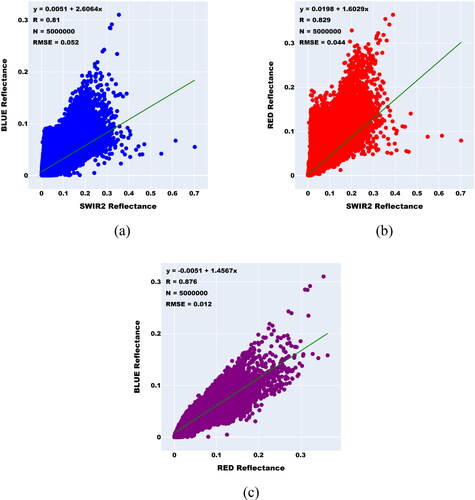
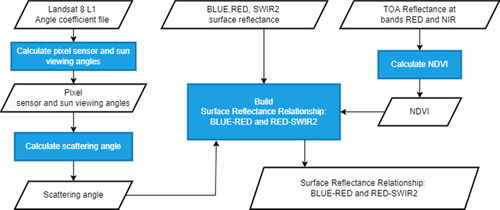
Figure 4. Diagram that determines the surface reflectivity relationship of BLUE-RED-SWIR2 channels.
According to (Seong et al. Citation2020) there are three methods to calculate the NDVI (Normalized Difference Vegetation Index): from reflectance at the top of the atmosphere (TOA), reflectance at the top of the canopy (TOC) and normalized reflectance with bidirectional reflectance distribution function (BRDF) modeling. In the case of using TOA reflectance excluding atmospheric correction, atmospheric effects are eliminated during the calculation of the NDVI (Holben Citation1986) and in the study of (Chen et al. Citation2003) calculating the NDVI for AVHRR also shows that the NDVI is similar, regardless of atmospheric correction. In addition, in the study of (Ganie and Nusrath Citation2016) using the method of calculating NDVI directly from TOA reflection using ArcGIS. In this paper, we calculated the NDVI using band 4 (RED VIS: 0.636–0.673) and band 5 (NIR: 0.851–0.879) of the Landsat 8 data instead of SWIR1 and SWIR2 bands of MODIS (Formula 14), because in the absence of aerosols these two NDVI are highly correlated (Levy et al. Citation2013).
(14)
(14)
From the Landsat 8 data of Path/Row = 127/045 dated 18 December 2013, including Level 1 data and surface reflectance data at BLUE, RED and SWIR2 channels, we built the relationship between surface reflectance of bands BLUE, RED and SWIR2 following: (i) The surface reflectance, scattering angle, and NDVI values are sorted by scattering angle and divided into 300 bins of equal size; (ii) Average surface reflectance value at BLUE, RED, SWIR2 corresponding to each bin of scattering angle and plot linear regression; (iii) Calculating slope and intercept BLUE/RED, RED/SWIR2 corresponding to each bin of scattering angle and plot linear regression of slopes, intercept with mean of scattering angle for each bin; (iv) Calculating the average of the NDVI for each bin of the scattering angle; (v) Linear regression determines the function describing slope, intercept relationship by scattering angle and NDVI; (vi) Across all groups, calculating the mean of scattering angle, NDVI, and surface reflectance in each band, then performing linear regression on scattering angle and linear regression on scattering angle and NDVI for each pair of bands RED – SWIR2, BLUE – RED to determine slopes and intercepts.
This relationship is not used directly constant values for slope and intercept of the linear regression for surface reflectance of the BLUE and RED bands, and not identified different equations for NDVI ranges as the second-generation MODIS algorithm (Levy, Remer, Mattoo, et al. Citation2007). Moreover, it is different from other research results on Landsat 8 identifying dark pixels with NDVI >0.55 (Wei et al. Citation2017) and on AHI calculating the relationship between its NDVI of band 0.86 µm with MODIS NDVI of 2.3 µm band and following the NDVI ranges in the second-generation MODIS algorithm (Ge et al. Citation2019).
4.5. Altitude correction
Rayleigh scattering has a significant impact on visible channels, especially blue channels with short wavelengths. Rayleigh scattering correction depends on the determination of the Rayleigh phase function and Rayleigh Optical Depth (ROD). The formula for calculating ROD is as follow (Mishchenko and Travis Citation1997; Bodhaine et al. Citation1999):
(15)
(15)
In which z is the height (in kilometers) of the surface target and 8.5 km is the exponential scale height of the atmosphere. The difference between ROD at z = 0 and z = Z is Δ When building LUT, ROD in atmosphere path reflectance is calculated with the assumption of sea level pressure. To correct ROD for surface targets, we used the Aster DEM to determine the surface elevation with a spatial resolution of 30 m, which is an improved method in the second-generation MODIS algorithm (Levy, Remer, Mattoo, et al. Citation2007). The algorithm takes the AOD at the calibration wavelength, equivalent to the surface height.
4.6. TOA reflectance simulation
To determine the TOA Reflectance value of each wavelength corresponding to an AOD value from LUT, we took interpolated data from LUT including solar zenith angle, solar azimuth angle, scattering angle, TOA Reflectance, Flux down, atmospheric reflectance, aerosol optical depth, Rayleigh scattering. After that they were combined with the surface reflectance relationship between BLUE-RED-SWIR2 channels. At the same time, we also calculated surface reflectance at SWIR2 to apply to the AOD retrieval step.
4.7. AOD retrieval
According to MODIS's AOD retrieval algorithm, we performed multichannel reflectance reversal to retrieve the characteristics of aerosol over land, combining fine and coarse aerosol modes to match the observed spectral reflectance. SWIR2 channel is assumed to contain both surface information and aerosols, and the surface reflectance coefficient of the BLUE and RED channels is a function of the surface reflectance relationship between the BLUE, RED and SWIR2 channels that we have calculated. Simultaneous inversion of surface and aerosol information in the three channels BLUE, RED and SWIR2 yields three parameters: AOD at 0.55 µm, the Fine (Mode) Weighting (FW) at 0.55 µm, and the surface reflectance at SWIR2. The formula (1) is rewritten as:
(16)
(16)
In which, and
are each composite of surface reflectance
and atmospheric path reflectance of the separate aerosol models. That is:
(17)
(17)
and
(18)
(18)
where
and
are the fine and coarse model atmospheric path reflectance,
and
are normalized downward fluxes for zero surface reflectance,
and
are upward total transmission into the satellite field of view,
and
are atmospheric backscattering ratios. Weight parameters
defined for
= 0.55
Note that the functions depend on
and angles such as
while other components are functions of aerosol properties in LUT.
In the case of a dark pixel, the algorithm determines the fine model, based on the location and time (Levy, Remer, Mattoo, et al. Citation2007). From LUT, are functions that take values according to
at 0.55 µm. Atmosphere path reflectance in the SWIR2 channel is a negligible function of τ, therefore, surface reflectance is also a function of τ. For the discrete values of η in intervals −0.1 to 1.1 (interval 0.1), the algorithm tries to find τ at 0.55 µm and surface reflectance at SWIR2 that matches the satellite’s measured reflectance in the BLUE channel. There will be an error, ε, at RED. The solution is the result obtained with the minimum error in RED. In other words,
(19)
(19)
(20)
(20)
(21)
(21)
With
are simulated TOA Reflectance at BLUE, RED, SWIR2 bands respectively, and
are reflectance measured at the sensor,
(22)
(22)
(23)
(23)
(24)
(24)
where
describe the surface reflectance relationship of the RED channel with SWIR2 and the BLUE channel with the RED channel.
For bright surfaces, the implementation of the retrieval was applied to the Continental aerosol model. Due to the greater uncertainty over brighter surfaces and the fact that we retrieve in only one wavelength and cannot use the path radiance ratio to distinguish between dust and non dust aerosol, only the continental model is used in the retrieval (Remer et al. Citation2005). (Sun et al. Citation2015) used a continental model when estimating the AOD for bright surfaces in the Beijing area. In this study, the authors also predict the AOD estimation error due to the continental model and some other reasons such as the difference between the two sensors Landsat and MODIS.
5. Results and discussion
5.1. Cloud mask
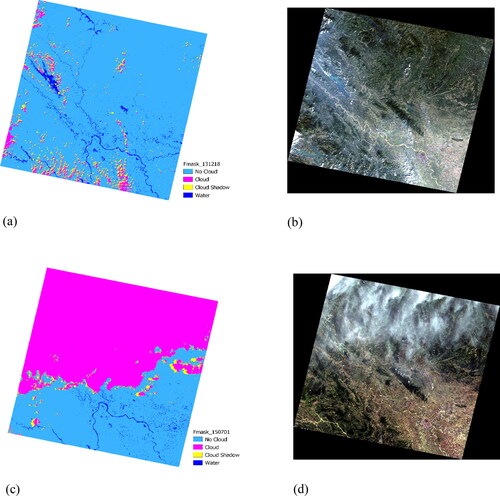
illustrates the results of the cloud mask for Landsat 8 scenes with Path/Row is 127/045 covering Hanoi on 18 December 2013 and 01 July 2015 using Fmask. We can clearly see the results of the Fmask algorithm when we have classified the cloudy (pink) points of cloudless points (cyan), cloud gloss points (yellow) and points that are water surfaces (blue) in comparison with the corresponding RGB image. As on 01 July 2015, the entire upper part was clouded, and on 18 December 2013, the area was less clouded across the entire scene.
Figure 5. Results of Fmask scene Landsat 8 containing Hanoi on 18 December 2013 and 01 July 2015. (a,b) are Fmask and RGB images on 18 December 2013 respectively; (c,d) are Fmask and RGB images on 01 July 2015. Fmask results are used to exclude clouds and shadow from the AOD algorithm.
5.2. Surface reflectance relationship between BLUE-RED-SWIR2 channels
With the results of the experiment, we identified the relationship of the surface reflectance of the BLUE-RED-SWIR2 channels as follows:
(25)
(25)
(26)
(26)
(27)
(27)
(28)
(28)
Where and
are the slope and intercept in the linear regression function of the surface reflectance between the RED and SWIR2 channels, and the slope and intercept in the linear regression function of the surface reflection between the BLUE and RED channels, NDVI is the Normalized Difference Vegetation Index, Θ is the scattering angle.
In our proposed approach, we developed directly linear regression equations from the scattering angle and NDVI, then choose the best relationship through practical evaluation over the study areas. This method of implementation is different from the selection of each NDVI value range in the second-generation MODIS algorithm shown in EquationEquations (9)–(11).
NDVI is an important parameter that requires accurate selection to estimate surface reflectance. In this study, we applied the method of calculating NDVI from TOA reflectance, based on the evaluation of two AOD products of Landsat 8 obtained by two methods using NDVI values: AOD obtained by the method using NDVI calculated directly from Landsat 8 TOA reflectance (Level 1) and AOD calculated from Landsat 8 NDVI product (Level 2) with AOD of AERONET stations. The results are described in . We found that the correlation of AOD calculated by the method of directly calculating NDVI from TOA is higher than AOD obtained by the method using Landsat 8 Level 2 NDVI product, and the RMSE error in these evaluations of SonLa and Bac Lieu stations is also lower except for Nghia Do station. We also applied two NDVI calculation methods, the first is using two SWIR1 and SWIR2 channels according to the MODIS DT algorithm; the second is using the VIS and NIR channels of Landsat 8 to retrieve AOD, then evaluate AOD obtained from 2 methods with stations in the research area ( in Appendix A), the results show that the R2 determination coefficient of the NDVI method is higher than 0.28 compared to 0.01, 0.98 compared to 0.70 and 0.99 compared to 0.93 respectively at Bac Lieu, Nghia Do and Son La stations, in addition to other evaluation indices such as MAE, MBE, RMSE corresponding are also smaller except at Nghia Do station which is slightly higher.
Table 3. The evaluation results of AOD obtained by 2 methods using NDVI.
5.3. Assessment of AOD retrieval
5.3.1. Landsat 8 AOD retrieval
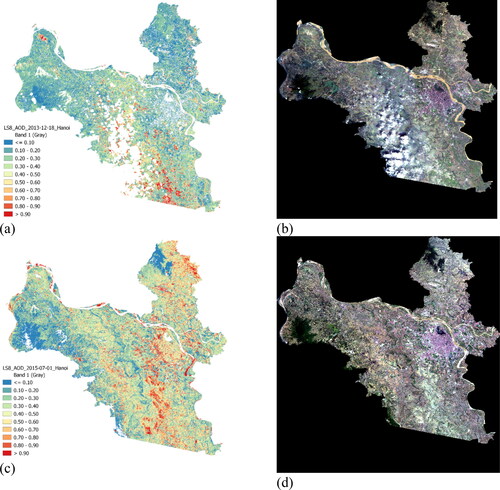
The proposed algorithm was applied to retrieve AOD on different areas. The study areas were cut using custom-sized box or cut according to the map of the area and applied the algorithm to process all the points in that area. For large areas with huge numbers of pixels, we considered the possibilities of dividing those into smaller boxes. Within the scope of this article, we applied the algorithm on the Hanoi area, of which the section located in Landsat 8 scenes that had Path/Row was 127/045 corresponding to the days 18 December 2013 and 01 July 2015 () corresponding to the results of Fmask obtained by 2 scenes in . We can clearly see the cloudy areas and water surface in the RGB image that were removed in the corresponding AOD image results. Land Use Land Cover (LULC) mantle structure is a direct result of urbanization (Cao et al. Citation2020; Chen et al. Citation2020). LULC is closely related to the spatial distribution of population density, pollution sources, and meteorological conditions, which influence AOD distribution and patterns. Many studies using remote sensing and measurement technology have been carried out to evaluate the relationship between LULC and AOD and pollution related to AOD (Weng and Yang Citation2006; Feizizadeh and Blaschke Citation2013; Halim et al. Citation2020; Li et al. Citation2020). The comparison of the AOD map and the overlay map can show the relationship between areas with high air pollution such as urban areas, traffic, etc. with AOD levels observed from satellites. From there, based on AOD images, it is possible to partially identify areas that are hot spots for air pollution. The AOD results shown higher values in the city center area than the rest, which proves with the areas of dense population, transportation, cultural, economic activities, etc. the air quality is worse.
Figure 6. AOD Retrieval for Hanoi (white is no data). (a,b) are AOD and RGB images in Hanoi on 18 December 2013 respectively; (c,d) are AOD and RGB images on 01 July 2015 respectively.
5.3.2. Evaluation with AERONET stations
To assess the accuracy of AOD products retrieved from the proposed algorithm, three AERONET stations in Vietnam, Son La, Nghia Do and Bac Lieu were selected to make comparisons with all data obtained between 2014 and 2016. AOD products from the stations were averaged on 30-min intervals (before or after satellite crossing) and Landsat 8 AOD data are averaged spatially within a 30-m radius around the station.
Although according to the statistics in the Landsat data table (), there are 35 scenes for the Son La station area, 50 scenes for the Nghia Do station area and 51 scenes for the Bac Lieu station area, but when matching AOD data with data of stations only 8 points for Son La station, 5 points for Nghia Do and 12 points for Bac Lieu station are suitable within a radius of 30 m and a time interval of 30 min. There are two main reasons, data from AERONET stations is incomplete or Landsat 8 data at the location of AERONET stations is affected by clouds and shadows, so AOD values cannot be obtained. To reduce the time to calculate AOD from Landsat 8 data around stations we clipped Landsat 8 images to the areas around the stations with dimensions of 5 km × 5 km (Nghia Do, Son La, Bac Lieu).
Based on the assessment, the scatter chart of AOD Landsat 8 at the stations of Nghia Do, Son La, Bac Lieu is shown in . Here we see a high correlation between AOD Landsat 8 and the data on the ground at the stations. According to the results obtained, we also found that most Landsat 8 AOD products were slightly higher than the AOD value on the ground (only the results of the model and the Son La station were lower, but not much).
Figure 7. AOD validation results obtained from algorithms and AERONET stations in Vietnam. (a,b) are line and scatter plots at Son La AERONET station respectively; (c,d) are line and scatter plots at Nghia Do AERONET station respectively; (e,f) are line and scatter plots at Bac Lieu AERONET station respectively.
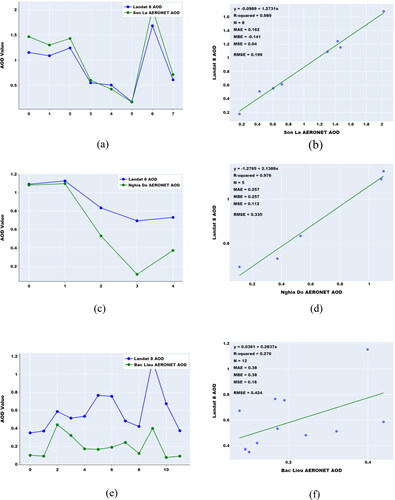
At Son La station, the slope and intercept are 1.27 and −0.10, respectively. The correlation coefficient was 0.99 and RMSE was 0.20. At Nghia Do station, the slope and intercept are 2.14 and −1.28, respectively and the correlation coefficient
was 0.97 with RMSE being 0.33. Higher results from the assessment with Son La compared to Nghia Do show that Nghia Do is located in an area with lower vegetation coverage and there is an uncertainty in the surface reflectance relationship between the visible channels and SWIR. In summary, the evaluation results show that the surface reflectivity relationship of the DT algorithm works well except for the low vegetation area, which is similar to the confirmed results for the MODIS-DT AOD product.
For the Bac Lieu station, the slope and intercept are 0.28 and 0.36, respectively, the value when comparing AOD from the algorithm to the station was 0.28 and RMSE was 0.36, indicating a low correlation and high data error. Moreover, the AOD value obtained from the algorithm was higher than the data measured at the station during the entire sampling period. When evaluating AOD obtained from the satellite with AOD from the Bac Lieu station, the results are often low. This is because the area is affected by marine aerosols (Tian et al. Citation2018), which influences the single scattering albedo during AOD estimation (Cattrall et al. Citation2003). Additionally, AOD uncertainties are simultaneously correlated with surface albedo, single scattering albedo, and asymmetry parameter in satellite retrieval algorithms (Huang et al. Citation2021)
(Thanh et al. Citation2015) evaluated MODIS AOD data with AERONET data at Bac Lieu station and had a lower correlation (0.79) in comparison with evaluation results at Nghia Do station (0.90). (Ha et al. Citation2019) validated MODIS AOD with AERONET AOD in Vietnam and obtained a high correlation with
for MODIS Terra AOD,
for MODIS Aqua AOD, and
for VIIRS AOD. If all AOD images were combined by his regression method, the determination of the coefficient is at 0.811. Compared to similar AOD evaluations, our Landsat 8 AOD product has a higher determination coefficient with
at Nghia Do and
at Son La, except for a lower value at Bac Lieu.
5.3.3. Evaluation with MODIS AOD
To validate with other satellite AOD products, we performed a product comparison of AOD Landsat 8 at a resolution of 30 m obtained from the algorithm with the MODIS-DT AOD, MOD (3 km) products. In the previous studies, there is no direct comparison between Landsat 8 AOD and MODIS AOD. They used AERONET AOD as a ground-truth for this evaluation (Sun et al. Citation2015; Wei et al. Citation2017; Jin et al. Citation2021). However, in our study, we collected MODIS data overlapping the corresponding Landsat 8 data in three scenes. Two of these, representing the Northern region of Vietnam, were scenes containing Nghia Do station (Path/Row is 127/045) and Son La (Path/Row is 128/045) ( and ).
Figure 8. Landsat 8 and MODIS overlap.
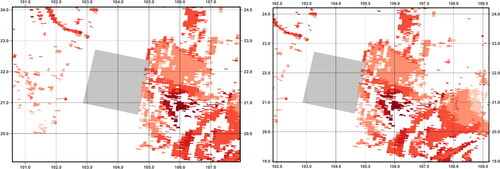
Table 4. Landsat 8 AOD and MODIS AOD.
I have performed image matching on the portion of the Landsat image that overlaps a 3 km × 3 km MODIS pixel and averaged the values of the Landsat pixels in this box, then compared them with the value of the MODIS pixels. The number of pixels in the result is the sum of all Landsat overlaps in a scene. The number of pixels may vary due to the size of the overlap or the influence of clouds, shadows, and water. After that, we perform an average of AOD Landsat 8 value in a 3 × 3 km pixel of MODIS. As can be seen in , we found that the Landsat 8 data corresponding to MODIS data in terms of sampling time usually only overlap a very small part on the edge of the MODIS images. Therefore, there would be errors in the spectral reflection obtained by the L1 image area of the edges (although it was corrected before publication). As this was also an input for AOD retrieval algorithms, there might be some difficulties and inaccuracies when comparing AOD products. Moreover, the acquisition times of MODIS and Landsat 8 satellites are some hours difference, which leads to AOD variation because of the weather condition changing.
In addition, the correlation between the MODIS AOD of the Nghia Do station area and the corresponding station data was higher than that at Son La station, which can be explained by the characteristics of the mountain area with changes in cloud cover in a short period of time.
Based on the AOD comparison results obtained from the Landsat 8 with a resolution of 30 m compared to the MODIS AOD of 3 km, we found that there was consistency in the spatial distribution of aerosols ( and ).
Figure 9. Evaluation Landsat 8 AOD 30 m with MODIS AOD 3 km at Landsat 8 path/row = 128/045. (a,b) are line and scatter plots Landsat 8 with path/row = 128/045 and MODIS/Terra on 08 July 2015 (Son La) respectively; (c,d) are line and scatter plots Landsat 8 with path/row = 128/045 on 30 June 2018 (Son La) respectively.
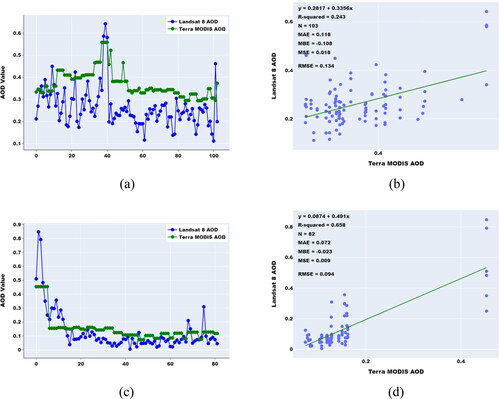
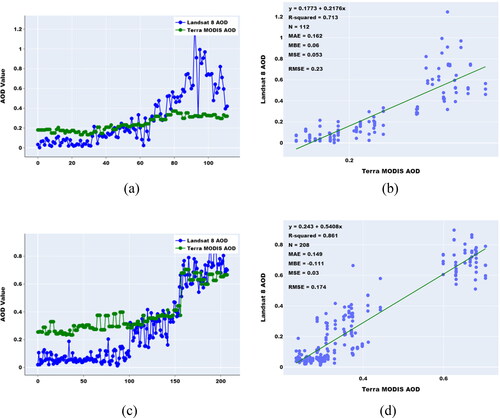
Figure 10. Evaluation Landsat 8 AOD 30 m with MODIS AOD 3 km at Landsat 8 path/row = 127/045. (a,b) are line and scatter plots Landsat 8 with path/row = 127/045 and MODIS/Terra on 01 July 2015 (Hanoi); (c,d) are line and scatter plots Landsat 8 with path/row = 127/045 and MODIS/Terra on 07 June 2018 (Hanoi).
6. Conclusions
In this paper, we proposed an AOD retrieval algorithm for the Landsat 8 satellite at a resolution of 30 m based on the second-generation MODIS Dark Target method. In this algorithm, a new surface reflectance relationship is built directly from Landsat 8 imagery which is then used in conjunction with Fmask and the Aster digital elevation model for AOD retrieval in urban areas with complex surfaces.
With this approach, we obtained accurate results in comparison with AERONET station data, specifically the correlation coefficient was 0.99 and RMSE was 0.20 for Son La station and at Nghia Do station the correlation coefficient
was 0.97 with RMSE being 0.33. For the Bac Lieu station, the correlation was lower, but this result also corresponds to other research in the area (Thanh et al. Citation2015). At the same time, when compared to MODIS AOD at a resolution of 3 km, the results were promising with RMSE from 0.09 to 0.23, which shows the consensus in the spatial distribution of aerosols.
From this study, we found that the MODIS DT algorithm applied to Landsat 8 can be used to retrieve AOD with high accuracy across many land areas with different surfaces, especially for urban areas and industrial parks that need high spatial resolution for monitoring pollution levels. Our algorithm has only been developed and evaluated in typical urban areas in Vietnam such as Son La, Hanoi and Bac Lieu because these areas have higher pollution levels and more complex surfaces. At the same time, there are AERONET stations providing AOD data during the study to evaluate the AOD obtained from the algorithm. In the future, we will apply the algorithm to different areas to verify the results of the algorithm with different surface types, aerosol models and other meteorological conditions that affect the AOD retrieval results.
However, with high-resolution spectral reflectance data on complex surfaces, it is inevitable that errors can occur during processing, and when applied to perform a wide-ranging recall, certain processing techniques and parallel calculation need to be applied along with the algorithms in order to reduce the computational load and the execution time.
The limitation of this algorithm is that it cannot handle some outliers leading to uncertain cases in the AOD results. Due to the influence of the parameters in the aerosol model, the background aerosol model or the difference between the two sensors MODIS and Landsat 8.
Disclosure statement
No potential conflict of interest was reported by the author(s).
Data availability statement
The data that support the findings of this study are available in Open Science Framework at https://osf.io/azxbd/?view_only=ce55dafa25454b61a60cb7d6fdd6b58c.
These data were derived from the following resources available in the public domain:
https://earthexplorer.usgs.gov/
References
- AERONET Documents. 1997. http://aeronet.gsfc.nasa.gov/new_web/Documents/AERONET_V3_AOD.pdf.
- Bilal M, Nichol JE, Bleiweiss MP, Dubois D. 2013. A Simplified high-resolution MODIS aerosol retrieval algorithm (SARA) for use over mixed surfaces. Remote Sens Environ. 136:135–145. doi: 10.1016/j.rse.2013.04.014.
- Bilal M, Nichol JE, Chan PW. 2014. Validation and accuracy assessment of a simplified aerosol retrieval algorithm (SARA) over Beijing under low and high aerosol loadings and dust storms. Remote Sens Environ. 153:50–60. doi: 10.1016/j.rse.2014.07.015.
- Bodhaine BA, Wood NB, Dutton EG, Slusser JR. 1999. On Rayleigh optical depth calculations. J Atmos Oceanic Technol. 16(11):1854–1861. doi: 10.1175/1520-0426(1999)016<1854:ORODC>2.0.CO;2.
- Cao Y, Fang X, Wang J, Li G, Cao Y, Li Y. 2020. Measuring the urban particulate matter island effect with rapid urban expansion. IJERPH. 17(15):5535. doi: 10.3390/ijerph17155535.
- Cattrall C, Carder KL, Gordon HR. 2003. Columnar aerosol single-scattering albedo and phase function retrieved from sky radiance over the ocean: measurements of Saharan dust. J Geophys Res: Atmos. 108(D9). doi: 10.1029/2002JD002497.
- Chen PY, Srinivasan R, Fedosejevs G, Kiniry JR. 2003. Evaluating different NDVI composite techniques using NOAA-14 AVHRR data. Int J Remote Sens. 24(17):3403–3412. doi: 10.1080/0143116021000021279.
- Chen T, Li M, Luo L, Deng S, Zhou R, Chen D. 2020. Simulating the effects of land urbanization on regional meteorology and air quality in Yangtze River Delta, China. Appl Geogr. 120:102228. doi: 10.1016/j.apgeog.2020.102228.
- Chudnovsky A, Tang C, Lyapustin A, Wang Y, Schwartz J, Koutrakis P. 2013. A critical assessment of high-resolution aerosol optical depth retrievals for fine particulate matter predictions. Atmos Chem Phys. 13(21):10907–10917. doi: 10.5194/acp-13-10907-2013.
- Clarke AD, Collins WG, Rasch PJ, Kapustin VN, Moore K, Howell S, Fuelberg HE. 2001. Dust and pollution transport on global scales: aerosol measurements and model predictions. J Geophys Res. 106(D23):32,555–532,569.
- Feizizadeh B, Blaschke T. 2013. Examining urban heat island relations to land use and air pollution: multiple endmember spectral mixture analysis for thermal remote sensing. IEEE J Sel Top Appl Earth Observations Remote Sensing. 6(3):1749–1756. doi: 10.1109/JSTARS.2013.2263425.
- Fraser RS. 1976. Satellite measurement of mass of Sahara dust in the atmosphere. Appl Opt. 15(10):2471–2479. doi: 10.1364/AO.15.002471.
- Fujisada H, Bailey G, Kelly G, Hara S, Abrams M. 2005. ASTER DEM performance. IEEE Trans Geosci Remote Sensing. 43(12):2707–2714. doi: 10.1109/TGRS.2005.847924.
- Fujisada H, Urai M, Iwasaki A. 2011. Advanced methodology for ASTER DEM generation. IEEE Trans Geosci Remote Sensing. 49(12):5080–5091. doi: 10.1109/TGRS.2011.2158223.
- Fujisada H, Urai M, Iwasaki A. 2012. Technical methodology for ASTER global DEM. IEEE Trans Geosci Remote Sensing. 50(10):3725–3736. doi: 10.1109/TGRS.2012.2187300.
- Ganie MA, Nusrath A. 2016. Determining the vegetation indices (NDVI) from Landsat 8 satellite data. IJAR. 4(8):1459–1463. doi: 10.21474/IJAR01/1348.
- Ge B, Li Z, Liu L, Yang L, Chen X, Hou W, Zhang Y, Li D, Li L, Qie L. 2019. A dark target method for Himawari-8/AHI aerosol retrieval: application and validation. IEEE Trans Geosci Remote Sensing. 57(1):381–394. doi: 10.1109/TGRS.2018.2854743.
- Gupta P, Christopher SA, Wang J, Gehrig R, Lee Y, Kumar N. 2006. Satellite remote sensing of particulate matter and air quality assessment over global cities. Atmos Environ. 40(30):5880–5892. doi: 10.1016/j.atmosenv.2006.03.016.
- Ha , PV, Truong , NX, Laffly , D, Jourdan , A, Thanh , NTN.2019.Evaluation of maximum likelihood estimation and regression methods for fusion of multiple satellite Aerosol Optical Depth data over Vietnam. 2019 11th International Conference on Knowledge and Systems Engineering (KSE); Oct 24-26 2019
- Halim NDA, Latif MT, Mohamed AF, Maulud KNA, Idrus S, Azhari A, Othman M, Sofwan NM. 2020. Spatial assessment of land use impact on air quality in mega urban regions, Malaysia. Sustainable Cities and Society. 63:102436. doi: 10.1016/j.scs.2020.102436.
- Hansen JE, Travis LD. 1974. Light scattering in planetary atmospheres. Space Sci Rev. 16(4):527–610. doi: 10.1007/BF00168069.
- Hauser A, Oesch D, Foppa N, Wunderle S. 2005. NOAA AVHRR derived aerosol optical depth over land. J Geophys Res. 110(D8): d 08204. doi: 10.1029/2004JD005439.
- Henderson BG, Chylek P. 2005. The effect of spatial resolution on satellite aerosol optical depth retrieval. IEEE Trans Geosci Remote Sensing. 43(9):1984–1990. doi: 10.1109/TGRS.2005.852078.
- Herman JR, Bhartia PK, Torres O, Hsu C, Seftor C, Celarier E. 1997. Global distribution of UV-absorbing aerosols from Nimbus 7/TOMS data. J Geophys Res. 102(D14):16,911–916,922.
- Holben BN. 1986. Characteristics of maximum-value composite images from temporal AVHRR data. Int J Remote Sens. 7(11):1417–1434. doi: 10.1080/01431168608948945.
- Holben BN, Tanré D, Smirnov A, Eck TF, Slutsker I, Abuhassan N, Zibordi G. 2001. An emerging ground-based aerosol climatology: aerosol optical depth from AERONET. J Geophys Res. 106(D11):12,067–012,097.
- Hsu NC, Tsay S-C, King MD, Herman JR. 2004. Aerosol properties over bright reflecting source regions. IEEE Trans Geosci Remote Sensing. 42(3):557–569. doi: 10.1109/TGRS.2004.824067.
- Hsu NC, Tsay S-C, King MD, Herman JR. 2006. Deep blue retrievals of Asian aerosol properties during ACE-Asia. IEEE Trans Geosci Remote Sensing. 44(11):3180–3195. doi: 10.1109/TGRS.2006.879540.
- Huang J, Arnott WP, Barnard JC, Holmes HA. 2021. Theoretical uncertainty analysis of satellite retrieved aerosol optical depth associated with surface albedo and aerosol optical properties. Remote Sensing. 13(3):344. doi: 10.3390/rs13030344.
- Jackson JM, Liu H, Laszlo I, Kondragunta S, Remer LA, Huang J, Huang H-C. 2013. Suomi-NPP VIIRS aerosol algorithms and data products. J Geophys Res Atmos. 118(22):12,673–12,689. doi: 10.1002/2013JD020449.
- Jin Y, Hao Z, Chen J, He D, Tian Q, Mao Z, Pan D. 2021. Retrieval of urban aerosol optical depth from Landsat 8 OLI in Nanjing, China. Remote Sens. 13(3):415. doi: 10.3390/rs13030415.
- Kahn RA, Gaitley BJ, Martonchik JV, Diner DJ, Crean KA, Holben B. 2005. Multiangle imaging spectroradiometer (MISR) global aerosol optical depth validation based on 2 years of coincident aerosol robotic network (AERONET) observations. J Geophys Res. 110(D10): d 10S04. doi: 10.1029/2004JD004706.
- Kaufman YJ, Tanré D, Boucher O. 2002. A satellite view of aerosols in the climate system. Nature. 419(6903):215–223. doi: 10.1038/nature01091.
- Kaufman YJ, Tanré D, Gordon HR, Nakajima T, Lenoble J, Frouin R, Teillet PM. 1997. Passive remote sensing of tropospheric aerosol and atmospheric correction for the aerosol effect. J Geophys Res. 102(D14):16,815–816,830.
- Kaufman YJ, Wald AE, Remer LA, Gao B-C, Li R-R, Flynn L. 1997. The MODIS 2.1-μmchannel-correlationwith visible reflectance for use in remote sensing of aerosol.IEEE Trans Geosci Remote Sensing. 35(5):1286–1298. doi: 10.1109/36.628795.
- Landsat Angles Creation. 2018. [accessed 2018 March 21]. https://www.usgs.gov/media/files/landsat-89-angles-creation-tools-readme.
- Leroy M, Deuzé JL, Bréon FM, Hautecoeur O, Herman M, Buriez JC, Roujean JL. 1997. Retrieval of atmospheric properties and surface bidirectional reflectances over land from POLDER/ADEOS. J Geophys Res. 102(D14):17023–17037.
- Levy RC, Mattoo S, Munchak LA, Remer LA, Sayer AM, Patadia F, Hsu NC. 2013. The collection 6 MODIS aerosol products over land and ocean. Atmos Meas Tech. 6(11):2989–3034. doi: 10.5194/amt-6-2989-2013.
- Levy RC, Remer LA, Dubovik O. 2007. Global aerosol optical properties and application to moderate resolution imaging spectroradiometer aerosol retrieval over land. J Geophys Res. 112: d 13210.
- Levy RC, Remer LA, Kleidman RG, Mattoo S, Ichoku C, Kahn R, Eck TF. 2010. Global evaluation of the collection 5 MODIS dark-target aerosol products over land. Atmos Chem Phys Discuss. 10(6):14815–14873.
- Levy RC, Remer LA, Mattoo S, Vermote EF, Kaufman YJ. 2007. Second-generation operational algorithm: retrieval of aerosol properties over land from inversion of moderate resolution imaging spectroradiometer spectral reflectance. J Geophys Res. 112:D13211.
- Li C, Lau AK-H, Mao J, Chu DA. 2005. Retrieval, validation, and application of the 1-km aerosol optical depth from MODIS measurements over Hong Kong. IEEE Trans Geosci Remote Sensing. 43(11):2650–2658. doi: 10.1109/TGRS.2005.856627.
- Li C, Zhang K, Dai Z, Ma Z, Liu X. 2020. Investigation of the impact of land-use distribution on PM2.5 in Weifang: seasonal variations. IJERPH. 17(14):5135. doi: 10.3390/ijerph17145135.
- Li L, Yang J, Wang Y. 2014. An improved dark object method to retrieve 500 m-resolution AOT (aerosol optical thickness) image from MODIS data: a case study in the Pearl River Delta area, China. ISPRS J Photogramm Remote Sens. 89(2):1–12. doi: 10.1016/j.isprsjprs.2013.12.008.
- Li Y, Xue Y, de Leeuw GD, Li C, Yang L, Hou T, Marir F. 2013. Retrieval of aerosol optical depth and surface reflectance over land from NOAA AVHRR data. Remote Sens Environ. 133(133):1–20. doi: 10.1016/j.rse.2013.01.020.
- Li Z, Niu F, Fan J, Liu Y, Rosenfeld D, Ding Y. 2011. Long-term impacts of aerosols on the vertical development of clouds and precipitation. Nature Geosci. 4(12):888–894. doi: 10.1038/ngeo1313.
- Lin H, Li S, Xing J, He T, Yang J, Wang Q. 2021. High resolution aerosol optical depth retrieval over urban areas from Landsat-8 OLI images. Atmos Environ. 261:118591. doi: 10.1016/j.atmosenv.2021.118591.
- Luo N, Wong MS, Zhao W, Yan X, Xiao F. 2015. Improved aerosol retrieval algorithm using Landsat images and its application for PM10, monitoring over urban areas. Atmos Res. 153:264–275. doi: 10.1016/j.atmosres.2014.08.012.
- Lyapustin A, Wang Y, Laszlo I, Kahn R, Korkin S, Remer L, Levy R, Reid JS. 2011. Multi-angle implementation of atmospheric correction (MAIAC): 2. Aerosol algorithm. J Geophys Res. 116(D3):D03211. doi: 10.1029/2010JD014986.
- Martin RV. 2008. Satellite remote sensing of surface air quality. Atmos Environ. 42(34):7823–7843. doi: 10.1016/j.atmosenv.2008.07.018.
- Mei L, Rozanov V, Vountas M, Burrows JP, Levy RC, Lotz W. 2017. Retrieval of aerosol optical properties using MERIS observations: algorithm and some first results. Remote Sens Environ. 197:125–140. doi: 10.1016/j.rse.2016.11.015.
- Mei L, Strandgren J, Rozanov V, Vountas M, Burrows JP, Wang Y. 2019. A study of the impact of spatial resolution on the estimation of particle matter concentration from the aerosol optical depth retrieved from satellite observations. Int J Remote Sens. 40(18):7084–7112. doi: 10.1080/01431161.2019.1601279.
- Mei L, Xue Y, Kokhanovsky AA, von Hoyningen-Huene WV, de Leeuw G, Burrows JP. 2013. Retrieval of aerosol optical depth over land surfaces from AVHRR data. Atmos Meas Tech Discuss. 6(1):2227–2251.
- Mishchenko MI, Travis LD. 1997. Satellite retrieval of aerosol properties over the ocean using measurements of reflected sunlight: effect of instrumental errors and aerosol absorption. J Geophys Res. 102(D12):13543–13553.
- MOD04_3K. [accessed 2018 April 20]. https://ladsweb.modaps.eosdis.nasa.gov/missions-and-measurements/products/MOD04_3K.
- Norton CC, Mosher FR, Hinton B, Martin DW, Santek D, Kuhlow W. 1980. A model for calculating desert aerosol turbidity over the oceans from geostationary satellite data. J Appl Meteor. 19(6):633–644. doi: 10.1175/1520-0450(1980)019<0633:AMFCDA>2.0.CO;2.
- Oo MM, Jerg M, Hernandez E, Picon A, Gross BM, Moshary F, Ahmed SA. 2010. Improved MODIS aerosol retrieval using modified VIS/SWIR surface albedo ratio over urban scenes. IEEE Trans Geosci Remote Sensing. 48(3):983–1000. doi: 10.1109/TGRS.2009.2028333.
- Python Fmask. [accessed 2018 Sep 3]. https://www.pythonfmask.org/.
- Ramanathan V, Crutzen PJ, Lelieveld J, Mitra AP, Althausen D, Anderson J, Valero FPJ. 2001. Indian ocean experiment: an integrated analysis of the climate forcing and effects of the great Indo-Asian haze. J Geophys Res. 106(D22):28,371–328,398.
- Remer LA, Kaufman YJ, Tanré D, Mattoo S, Chu DA, Martins JV, Li R-R, Ichoku C, Levy RC, Kleidman RG, et al. 2005. The MODIS aerosol algorithm, products and validation. Journal of the Atmospheric Sciences. 62(4):947–973. doi: 10.1175/JAS3385.1.
- Remer LA, Mattoo S, Levy RC, Munchak LA. 2013. MODIS 3 km aerosol product: algorithm and global perspective. Atmos Meas Tech. 6(7):1829–1844. doi: 10.5194/amt-6-1829-2013.
- Sayer AM, Hsu NC, Bettenhausen C, Ahmad Z, Holben BN, Smirnov A, Zhang J. 2012. Seawifs ocean aerosol retrieval (SOAR): algorithm, validation, and comparison with other data sets. J Geophys Res. 117:D03206.
- Seong N-H, Jung D, Kim J, Han K-S. 2020. Evaluation of NDVI estimation considering atmospheric and BRDF correction through Himawari-8/AHI. Asia-Pacific J Atmos Sci. 56(2):265–274. doi: 10.1007/s13143-019-00167-0.
- Smirnov A, Holben BN, Eck TF, Dubovik O, Slutsker I. 2000. Cloud screening and quality control algorithms for the AERONET database. Remote Sens Environ. 73(3):337–349. doi: 10.1016/S0034-4257(00)00109-7.
- Solar Illumination and Sensor Viewing Angle Coefficient Files. 2018. [accessed 2018 Sep 3]. https://www.usgs.gov/landsat-missions/solar-illumination-and-sensor-viewing-angle-coefficient-files.
- Sun K, C X, Zhu Z, Zhang T. 2017. High resolution aerosol optical depth retrieval using Gaofen-1WFV camera data. Remote Sens. 9(1):89. doi: 10.3390/rs9010089.
- Sun L, Wei J, Bilal M, Tian X, Jia C, Guo Y, Mi X. 2016. Aerosol optical depth retrieval over bright areas using Landsat 8 OLI images. Remote Sens. 8(1):23. doi: 10.3390/rs8010023.
- Thanh PX, Anh NX, Khuong PL, Thuy DN. 2015. Optical thickness characteristics of aerosol aerosols from AERONET Vietnam station data and comparing them with MODIS data. Vietnam J Earth Sci. 37(3):252–263.
- Tian X, Liu Q, Song Z, Dou B, Li X. 2018. Aerosol optical depth retrieval from Landsat 8 OLI images over urban areas supported by MODIS BRDF/Albedo data. IEEE Geosci Remote Sens Lett. 15(7):976–980. doi: 10.1109/LGRS.2018.2827200.
- Torres O, Bhartia PK, Herman JR, Sinyuk A, Ginoux P, Holben B. 2002. A long-term record of aerosol optical depth from TOMS observations and comparison to AERONET measurements. J Atmos Sci. 59(3):398–413. doi: 10.1175/1520-0469(2002)059<0398:ALTROA>2.0.CO;2.
- Using the USGS Landsat Level-1 Data Product. 2018. [accessed 2018 Sep 3]. https://www.usgs.gov/landsat-missions/using-usgs-landsat-level-1-data-product.
- Van de Hulst HC. 1948. Scattering in a planetary atmosphere. Astrophys J. 107:220–246. doi: 10.1086/145005.
- Wang Y, Chen L, Li S, Wang X, Yu C, Si Y, Zhang Z. 2017. Interference of heavy aerosol loading on the VIIRS aerosol optical depth (AOD) retrieval algorithm. Remote Sens. 9(4):397. doi: 10.3390/rs9040397.
- Wei J, Huang B, Sun L, Zhang Z, Wang L, Bilal M. 2017. A simple and universal aerosol retrieval algorithm for Landsat series images over complex surfaces. J Geophys Res Atmos. 122(24):13,338–13,355. doi: 10.1002/2017JD026922.
- Weng Q, Yang S. 2006. Urban air pollution patterns, land use, and thermal landscape: an examination of the linkage using GIS. Environ Monit Assess. 117(1–3):463–489. doi: 10.1007/s10661-006-0888-9.
- Yamaguchi Y, Kahle A, Tsu H, Kawakami T, Pniel M. 1998. Overview of advanced spaceborne thermal emission and reflection radiometer (ASTER). IEEE Trans Geosci Remote Sens. 36(4):1062–1071. doi: 10.1109/36.700991.
- Zanaga D, Van De Kerchove R, Daems D, De Keersmaecker W, Brockmann C, Kirches G, Wevers J, Cartus O. 2022. ESA WorldCover 10 m 2021 v200 (Version v200) [Data set]. Zenodo. https://doi.org/10.5281/zenodo.7254221.
- Zhang H, Kondragunta S, Laszlo I, Liu H, Remer LA, Huang J, Superczynski S, Ciren P. 2016. An enhanced VIIRS aerosol optical thickness (AOT) retrieval algorithm over land using a global surface reflectance ratio database. J Geophys Res Atmos. 121(18):10717–10738. doi: 10.1002/2016JD024859.
- Zhong B, Wu S, Yang A, Liu Q. 2017. An improved aerosol optical depth retrieval algorithm for moderate to high spatial resolution optical remotely sensed imagery. Remote Sens. 9(6):555. doi: 10.3390/rs9060555.
- Zhu Z, Wang S, Woodcock CE. 2015. Improvement and expansion of the Fmask algorithm: cloud, cloud shadow, and snow detection for Landsats 4–7, 8, and Sentinel 2 images. Remote Sens Environ. 159:269–277. doi: 10.1016/j.rse.2014.12.014.
- Zhu Z, Woodcock CE. 2012. Object-based cloud and cloud shadow detection in Landsat imagery. Remote Sens Environ. 118:83–94. doi: 10.1016/j.rse.2011.10.028.
Appendix A
TOA reflectance calculation
To separate the effects of the atmosphere from the TOA reflectance from the Landsat 8 L1 data, which is Digital Number (DN) data, we calculated the reflectance at the top of the atmosphere - TOA Reflectance (Using the USGS Landsat Level-1 Data Product) for each band. Bands 2 to 7 of the L1 data can be converted to the TOA reflectance using the rescaling coefficients, which is given in the metadata:
(2)
(2)
where:
TOA planetary reflectance
Band-specific multiplicative rescaling factor
Band-specific additive rescaling factor
Quantized and calibrated standard product pixel values (DN)
TOA reflectance with a correction for the sun angle is then:
(29)
(29)
where:
TOA planetary reflectance
Local sun elevation angle
Local solar zenith angle;
= 90° −
The output of this step is TOA reflectance at each band at a resolution of 30 m.