
 ?Mathematical formulae have been encoded as MathML and are displayed in this HTML version using MathJax in order to improve their display. Uncheck the box to turn MathJax off. This feature requires Javascript. Click on a formula to zoom.
Abstract
Wise-use of land resources determines sustainability of environment and human welfare. But, the ongoing land-use change constrains environmental sustainability. Thus, this study aims to quantify past and future land-use change trend with its associated drivers in Koore’s agricultural landscape of Southern Ethiopia. To quantify the change trends, geospatial tools were applied. A CA–Markov model was used to predict land-use changes. Relative Importance Index was used to identify major drivers of the change. The result of the study showed agroforestry, built-up and cultivation rise by 192%, 152% and 18% at the expense of natural environment. Population growth and agricultural expansion are among the leading land-use change drivers. CA–Markov model revealed a continued increment of anthropogenically modified land-use classes which adversely affect the sustainability of the landscape. Information on spatiotemporal dynamics has been confirmed as effectual measure for nature conservation, agriculture, urban planners, and policymakers to plan sustainable development actions.
1. Introduction
The sustainability of humans’ welfare depends on the wise use of environmental resources such as soil, water, vegetation, and others (Mucova et al. Citation2018). However, several interwoven earth systems are anthropogenically influenced and changing the normal provision of the global natural environment (Khwarahm et al. Citation2021). Land-Use/Land Cover (LULC) change is one of the fundamental concerns in the changing of the global environment and adversely affects its sustainability (Yirsaw et al. Citation2017; Tariq and Shu Citation2020; Khwarahm Citation2021; Debnath et al. Citation2022).
The past 300 years’ path of worldwide LULC change has been recognized by gains in agriculture and losses in natural forest (Leta et al. Citation2021). Globally, the critical modifications of LULC could be related to unending population growth (Abebe et al. Citation2022; Tariq et al. Citation2021a; Nath et al. Citation2023). This is linked with the intense agricultural development, expansion of residential and industrial areas, and limitless extraction of natural resources (Tolessa et al. Citation2017; Mucova et al. Citation2018). Globally, every year millions of hectares of forest are burned (Tariq et al. Citation2021b). For instance, FAO (Citation2020) estimated that about 420 million ha of global forest land degraded with 10 million hectares of annual deforestation since 1990.
Like the rest of the world, in Africa, the level and intensity of exploitation of natural resources have led to significant changes in land attributes (Mucova et al. Citation2018). According to FAO (Citation2011) report, about 27.4% of African lands (almost 500 million hectares) are degraded. Particularly, very rapid changes are recognizable in Ethiopia with a 0.97% annual deforestation rate which is the highest rate of change in Africa (Marchant et al. Citation2018). Around the nineteenth century, about 40% of the landmass of Ethiopia that was covered by forest has reduced below to 3% in the early 1990s (EFAP Citation1994). As the FAO Forest Resources Assessment report verified the highest net annual forest loss in Ethiopia was 2.8 million ha between 2010 and 2015 (FAO Citation2015). Other studies also justified that the trend of LULC change in Ethiopia is mainly from the natural vegetation to cultivation land (Abebe et al. Citation2022; Kuma et al. Citation2022). Land degradation due to LULC change which has a direct link with decline in agricultural produce, led to detrimental impacts on the livelihood of the people (Tolessa et al. Citation2017; Shiferaw et al. Citation2019). Consequently, the country has been known as a food-insecure country in the world with 10.2 million people being food-insecure every year in the recent human memory (FAO Citation2016).
Understanding the earlier, current, and future LULC changes is a step to guarantee effective land- use planning and sustainable land resources management (Yirsaw et al. Citation2017; Tariq and Shu Citation2020). Cognizing this, currently, different scholars of various academic areas in Ethiopia, have been greatly attracted to the issues of LULC changes analysis (e.g. Tolessa et al. Citation2017; Abebe et al. Citation2022; Leta et al. Citation2021; Kuma et al. Citation2022). Majorities of these studies are spatially concentrated on highlands and northern parts of the country by focusing on LULC change detection and associated drivers while lacking prediction of the change in the future. More, the limited studies which modeled LULC change in the country like Temesgen et al. (Citation2021) conducted in the Gedeo-Abaya landscape and Leta et al. (Citation2021) in Nashe Watershed, Upper Blue Nile Basin, Ethiopia are not even proximate to the current study landscape.
Since there are numerous models to simulate LULC changes, often their complications for the stochastic change and dynamic nature of natural and socioeconomic variables should be in consideration (Leta et al. Citation2021). As it was stated by Yirsaw et al. (Citation2017), some of the models are Agent-based (Xie et al. Citation2007), CLUE (Han et al. Citation2015), Cellular Automata (CA) and Markov chain (Guan et al. Citation2011). A multidisciplinary model that combines elements of various modeling techniques has been suggested in developing projections of future LULC change (Tariq and Shu Citation2020; Leta et al. Citation2021; Debnath et al. Citation2022).
CA–Markov model is a combination of Cellular Automata and transition probability matrices generated by cross-tabulation of two different images (Risma and Paharuddin Citation2019). It is the most effective method for modeling the probability of spatiotemporal change in LULC along with a geographic information system (Liping et al. Citation2018; Hoque et al. Citation2021; Khwarahm et al. Citation2021; Debnath et al. Citation2022; Tariq et al. Citation2022a). According to Temesgen et al. (Citation2021), a CA–Markov LULC change model is used to estimate the pattern of geo-spatial alteration in occasion by taking into account the locality relationship and a conversion map of the LULC to be considered. These hybridizing two methods can realize improved imitation of LULC discrepancy in both spatially and measured magnitudes (Tariq and Shu Citation2020; Leta et al. Citation2021). More, the use of the CA-Markov model in LULC change studies has advantages due to its dynamic simulation capability; high efficiency with data, simple calibration; and ability to simulate multiple land covers and complex patterns (Liping et al. Citation2018; Khwarahm et al. Citation2021). Consequently, we used CA-Markov model with IDRISI Selva 17.0 software to realize improved imitation of multiple land covers and complex patterns of Koore’s agricultural landscape.
Koore’s agricultural landscape which is structured in catenary Mountain and has a double-faced hillside in eastern and western directions; contributes a lot to the health of Lake Chamo and Nech Sar National Park. Historically, it was a mosaic landscape that encompassed wider natural forests, woodland, bush land, grazing land, wetlands, agroforests as well as streams that were often bordered by woody vegetation (ADFEDO, 2020). As land is a limited resource to competing human demands, currently the study landscape’s wider natural habitats are anthropogenically disturbed and lost its natural capacity to deliver ecosystem services (ADAO, 2021). To reverse this situation, measures have been taken through integrated watershed management approach. Regardless of the efforts made, the landscape is experiencing noticeable environmental problems such as deforestation, and land degradation resulted decline in land productivity. This pressure led to under sustenance the community and resulting in food aided for survival, inaccessibility of potable water and loss of biodiversity (ADFEDO, 2020).
Mainly inappropriate land-use, lack of livelihood diversification, insecurity, and political unrest that related to political regime shift during1990/1991 and 2018/2019 threatens Koore’s agricultural landscape. This phenomenon calls for generation of scientific information regarding to LULC changes, associated potential drivers, and its future prediction to develop appropriate land-use plan. Thus, modeling of LULC changes is the focus of the current scientific examination of researchers to have informed planning decisions to develop environmentally sound development policies and strategies (Yirsaw et al. Citation2017). Therefore, this research was conducted to respond to the following research questions: (1) Which LULC classes changed in to others in the past three decades (1990–2020) in the study landscape?; (2) Which LULC classes will be changed in to others based on a business-as-usual scenario for the year 2035?; and (3) What are the potential drivers of LULC change in the study landscape? This study is significantly important to provide empirical evidence on the past and future pattern of LULC changes and driving forces of the changes for natural resources managers, environmental protection experts, and policymakers to develop a land-use plan that concern sustainable land management of the studied landscape.
2. Methods and materials
2.1. Study area description
Koore’s agricultural landscape is found in Southern Nations Nationalities and People’s Regional State and covers about 141,190.7 ha. It is bounded by longitudes of 37˚ 32′ 14ʺ to 38˚ 00′ 33ʺE and latitudes of 5˚ 35′ 58ʺ to 5˚ 59′ 53ʺN. It is located at about 210 km to the South East of the Regional capital city, Hawassa, and 485 km from the capital city of Ethiopia, Addis Ababa. It is bordered by Buriji District from the south, by Lake Chamo and Nech Sar National Park from the west, and Oromia National Regional State from the east and north. Topographically, it is steeply sloped (25%), hills (20%), undulated (25%), and gentle to plane (30%) (ADAO, 2020) ().
Figure 1. Map of study landscape.
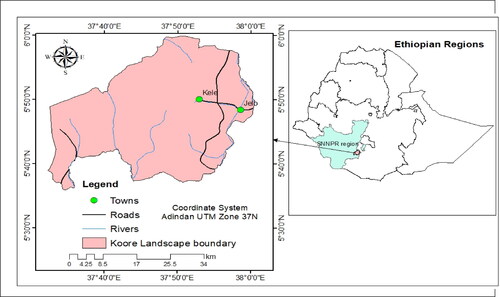
As a part of Chamo – Abaya basin, its LULC change characteristics are representative for the well-being of Lake Chamo and Nech Sar National Park. The climatic condition of the study landscape is tropical humid or highland (Dega) altitude of above 2300 m.a.s.l, tropical sub-humid or midland (Weyina Dega) mid-altitude of between 1500 and 2300 m.a.s.l and semi-arid or lowland (Kolla) altitude of below 1500 m.a.s.l with their respective shares of 32%, 30%, and 38% of the total area of the landscape respectively (ADFEDO, 2018). It has a bimodal rainfall distribution of long rain (belg) that falls between March to June and the short rain (meher) that falls between August to October. The mean total precipitation varies spatially from 801–1000 mm per annum. The average monthly temperature ranges from 12 °C to 25 °C (ADAO, 2019). The texture of the soil is predominantly sandy loams and clay along the gradient varying from grey to red and brown, and sands or dark clays are found in the flood plains (ADAO, 2016). Currently the study landscape is inhabited with the total population of 238,698. From this about 120,218 are males where as about 118,480 are females. Its population density is 149 people per km2 (ADFEDO, 2020). Of the total population, 90% live in rural areas. Their livelihood is based on rain-fed mixed (crop-livestock) agriculture that is supplemented by traditional small-scale irrigation. The rest 10% are urban dwellers.
2.2. Data acquisition
In this study, change-detection analysis used multiple sets of spatiotemporal Landsat images for 1990, 2005, and 2020 to establish LULC changes in Koore’s agricultural landscape. The reason to prefer the year 1990 is to capture the LULC condition of the study landscape in a military regime that ended in 1991. This helped to compare its change with the political regime of the Ethiopian People Revolutionary Democratic Front (EPRDF) government by taking the 2005 year Landsat image. Again, as 2018/2019 was a time of mass political movement against the old EPRDF government, 2020 year is desired to evaluate the result of this mass political movement-led power vacuum period on the study landscape LULC.
The primary and ancillary data that were used for analysis were collected from different sources. The primary data included cloud-free Landsat images (path 168; raw 056) of Thematic Mapper (TM), Enhanced Thematic Mapper (ETM+), and Operational Land Imager (OLI) of 30 m spatial resolution. All these images were acquired free of charge from the United States Geological Survey (USGS) website available at (https://earthexplorer.usgs.gov).
The selection of these satellite images was entirely based on the quality (cloud-free) and long time series availability, and the suitability of the seasons for collecting field data (Tariq et al. Citation2022b). As the effects of solar elucidation angle induced by the rugged terrain nature of site may cause different reflectance for the same cover type, the acquisition dates of images were as close to each other as possible to minimize troubles related to seasonal variations.
Ancillary data like a topographic map (at a scale of 1:50000), which covers the entire study landscape was obtained from the Ethiopian Mapping Agency. Besides, aerial photography and Google Earth map were used for classification and accuracy improvement.
2.3. Image processing
In this study, ERDAS imagine 2015 software was applied to perform standard image processing techniques (extraction, geometric correction or geo-referencing, atmospheric and topographic correction, layer stacking, image enhancement, and sub-setting or clipping), and image classification. All images were registered to the Universal Transverse Mercator (UTM) projection framework, zone 37 N and datum of World Geodetic System-84 (WGS84) projection parameters to guarantee consistency between datasets during analyses. When we used ArcGIS 10.5 for map preparation, IDRISI Selva 17.0 software was applied to LULC change prediction. The two main image pre-processing techniques are geometric and radiometric corrections, which enhance the quality of remote sensing images for further analysis. Hence, as it is recommended by Mohajane et al. (Citation2018), for this study all images were geometrically corrected and acquired in Level 1 terrain-corrected (L1T). To reduce errors in the digital numbers of images and improve its interpretability radiometric correction is made (Hoque et al. Citation2021; Nath et al. Citation2023).
The image processing chain was performed also using the open-source Quantum GIS software (Version QGIS 3.10) (QGIS, https://qgis.org/en/site/). Atmospheric correction was applied through the Semi-Automatic Classification Plug-in (Mohajane et al. Citation2018). This was done based on the Dark Object Subtraction (DOS) algorithm (Alam et al. Citation2020). This study has applied a radiometric correction for the image of TM, ETM+, and OLI for the respective year of 1990, 2005, and 2020. The conversion process was done for each band of the TM, ETM+, and OLI of 30-meter resolution. For all images, calibration was achieved by converting raw digital numbers (DN) into sensor spectral radiance (Mohajane et al. Citation2018), using EquationEquation (1)(1)
(1) :
(1)
(1)
Where; Ll is the spectral radiance at the sensor’s aperture, DN is the digital number of the quantized calibrated pixel value, Llmax is the maximum spectral radiance that is scaled to QCALlmax, Llmin is the minimum spectral radiance that is scaled to QCALlmin, QCALlmax is the maximum quantized calibrated pixel value in DN (corresponding to Llmax) and QCALlmin is the minimum quantized calibrated pixel value in DN (corresponding to Llmin). Then, the radiance is converted into top-of-atmosphere (TOA) reflectance using EquationEquation (2)(2)
(2) :
(2)
(2)
Where; ρ = Unitless planetary reflectance, L = Spectral radiance at sensor aperture, d = the Earth-Sun distance which is on the date of imaging, ESun = Mean solar exoatmospheric irradiance, π= Mathematical constant equal to ∼3.14159 [unitless], θs = Solar zenith angle [degrees]. Additionally, in ETM+ (2005), strips have been removed by using the plugin of a Landsat-7 toolbox.
2.4. LULC classification
To classify LULC categories, data of training sites were randomly distributed and employed to locate training pixels for each LULC classes. The training sites for a current image generated by GPS reading supported high-resolution Google Earth images. For older historical images training sites were assigned with the aid of raw image visual interpretation, by local elders’ information and the researchers’ local knowledge (Temesgen et al. Citation2021; Kuma et al. Citation2022). In the evaluation stage, signature editions have been done by deleting, merging, or renaming until the most satisfactory result was achieved.
To obtain LULC information from the multiband raster imageries through the process of image interpretation and classification, supervised classification of Maximum Likelihood Classifier (MLC) has been widely used (Khwarahm et al. Citation2021; Debnath et al. Citation2022; Kuma et al. Citation2022). This is mainly it minimizes classification error by taking into account the variance-covariance within the class distributions, and merging constituent spectral class signatures to obtain those for rationalized classes. More its availability and that it does not require an extended training process make it preferable. Thus, this study used the MLC with the integration of field and Google Earth verification, which is the common image classification technique (Alam et al. Citation2020; Nath et al. Citation2023).
For monitoring LULC change, it is necessary to have at least data from two time periods for comparison (Mohajane et al. Citation2018). Accordingly, for the years 1990, 2005, and 2020 LULC map was prepared from Landsat (TM, ETM+, and OLI) respectively. Assisted by field observation, expert opinions, and photographs of particular sites, ten classes of LULC were identified (). GPS has been used for post-classification. Thus, field visits were performed for ground validation of ambiguous land covers to enable further refinement of the LULC classification. Then, multitemporal raster layers were generated and their corresponding statistics were compared for estimation of the LULC change. A comparison of change extent within LULC classes and between the study periods was done. For each LULC class of each study period’s percentage of area, percentage change, the annual rate of change, and net persistent were calculated using EquationEquation (3) (4) (5)(5)
(5) , and Equation(6)
(6)
(6) respectively.
(3)
(3)
(4)
(4)
(5)
(5)
(6)
(6)
Table 1. Contextual description of the LULC classes.
2.5. Accuracy assessment
Due to the LULC classification is subject to some errors, the output needs to be tested for assessing accuracy using a reliable statistical technique (Alam et al. Citation2020). In determining the accurateness of LULC classes, the number of reference pixel is an imperative factor (Tolessa et al. Citation2017). LULC maps are usually accompanied by an accuracy assessment index that includes a clear description of the sampling design, an error matrix, proportion of the area of each category according to the map, and descriptive accuracy measures (Sharma et al. Citation2018). Accordingly producer accuracy, user accuracy, overall accuracy, and kappa index were calculated as per formulas used by other researchers (e.g. Kuma et al. Citation2022; Debnath et al. Citation2022; Nath et al. Citation2023). The overall accuracy and Kappa coefficient were computed using EquationEquation (7(7)
(7) and Equation8)
(8)
(8) .
(7)
(7)
(8)
(8)
Where r is the number of rows in the matrix, xii expresses the total number of correctly classified pixels in row i and column i, xi + and x + i are the marginal totals of row i and column i.
In this study, confusion matrix was used to assess the accuracy of all raster layers of 1990, 2005, and 2020. The classification accuracy of 1990 and 2005 was done with the support of local community discussion and history of Google Earth. The 2020 classification was assessed based on field and Google Earth reference data. The total reference data for each year’s classification were 460. Finally a stratified random sampling design was adopted for accuracy assessment.
2.6. LULC change prediction
2.6.1. CA-Markov LULC change prediction model
The Markov chain model defines the LULC transition from one time (t1) to the next (t2) to predict future change at a time, to project probabilities of land use changes for the future (Wang et al. Citation2020; Tariq and Shu Citation2020; Nath et al. Citation2023). The known probabilities from past changes are used to envisage future changes (Tariq and Shu Citation2020; Temesgen et al. Citation2021). According to Yirsaw et al. (Citation2017), the conversion probability matrix is a text file that records the probability that each land cover class will change to every other class. The change matrix is a text file that records the number of pixels that are predictable to change from each land cover class to each other land cover class over the specified number of time units (Leta et al. Citation2021). In both of these files, the rows represent the older land cover categories and the columns represent the newer categories (Yirsaw et al. Citation2017). The probability images report the probability that each land cover class could be found at each pixel after the specified number of time units (Temesgen et al. Citation2021). These images are calculated as projections from the latter of the two input land cover images (Wang et al. Citation2020; Debnath et al. Citation2022). As per Liping et al. (Citation2018) and Wang et al. (Citation2020), the Markovian chain analysis, S(t,t + 1) = Pij × S(t) is calculated by EquationEquation (9)(9)
(9) .
(9)
(9)
Where, S(t) is the system status at the time of t, S(t + 1) is the system status at time t + 1, is the Markov probability matrix, and Pij stands for the probability of converting from current state i to another state j in the next time period.
In the CA–Markov model, a CA model is used to forecast the patterns of spatial changes over time by considering the neighborhood configuration and a transition map of the LULC to be considered (Yirsaw et al. Citation2017; Tariq and Shu Citation2020). So, CA–Markov model is a combination of CA and transition probability matrices generated by cross-tabulation of two different images (Risma and Paharuddin Citation2019; Debnath et al. Citation2022; Nath et al. Citation2023). The requirements of the CA-Markov module were added to the module. Constraints and factors were established to determine which lands were to be considered for further interventions. The constraints were standardized into a Boolean character of 0 and 1, while the factors were standardized to a continuous scale of suitability from least suitable to most suitable. The constraints included distance from infrastructures, elevation, and slope. The requirements of the CA-Markov module were added to the module one by one: basic land cover which is the later land cover image that have used with Markov (the map of 2020) as the 2035 map had to be predicted, Markov transition areas file which was created using the 2005 and 2020 maps and a transition suitability image collection. Then, the number of iterations was set to 15 with one iteration for each year (2020 to 2035). Finally, the module gave LULC image for 2035 as a predicted LULC.
2.6.2. CA-Markov model validation
Validate provides a method to measure agreement between two categorical (integer or byte) images, a comparison map, and a reference map. The comparison map is the result of a simulation or classification model whose validity is being assessed against a reference map that depicts reality (Tariq and Shu Citation2020). To ensure that the model is reliable in predicting a LULC for a specific project year, it must be validated using the existing two maps. The first one is the real LULC of the year 2020, and the second map is a simulated LULC map of 2020. The validate module IDRISI selva 17.0 was used for validating the model by producing several parameters. It was utilized due to its ability to produce a Kappa index of agreement between the simulated and real map for the same time point for each class (Yirsaw et al. Citation2017; Tariq and Shu Citation2020; Temesgen et al. Citation2021; Debnath et al. Citation2022; Nath et al. Citation2023). Accordingly the predictive power of the model was examined by comparing the reference and simulated LULC maps of 2020 and using the kappa index.
The validate module used for validating the model kappa for no information (Kno), kappa for location (Klocation), and kappa for standard (Kstandard) parameters are used to identify the accuracy of the model (). According to Khwarahm (Citation2021); Leta et al. (Citation2021) and Debnath et al. (Citation2022), Kno information is the overall agreement of the projected and reference map indicates the; Klocation is used to compute the spatial accuracy in the overall landscape from the simulated and reference map; and Kstandard is the ratio of inaccurately allocations by chance to the correct assignments is kappa for standard.
Table 2. Kappa index CA-Markov model validation result.
2.7. Socioeconomic data collection method
Though remotely sensed data are vital in LULC change studies, they cannot provide complete answers to the questions like why and how changes are occurring (Lambin et al. Citation2003). Hence, to fully address the complex trends of LULC dynamics, it is mandatory to incorporate other socio-economic and institutional data. So, socioeconomic aspects primary data were collected through a series of semi-structured questionnaires from 150 respondents that have been sampled according to Cochran (Citation1963). Besides, a thorough field visit, 12 key informant interview, and 3 focus group discussions were used to capture the insight of the community regarding LULC change and its drivers. Content analysis was used for data obtained from focus groups and key informants. Relative Importance Index (RII) was used to identify potential drivers of LULC change for the study landscape. Potential drivers of LULC change are drivers with the higher value of RII. According to Azman et al. (Citation2019), RII is calculated by using the EquationEquation (10)(10)
(10) .
(10)
(10)
Where: W = Weighting given to each factor by the respondents, A = the highest weight in research, and n = respondents’ Total number ().
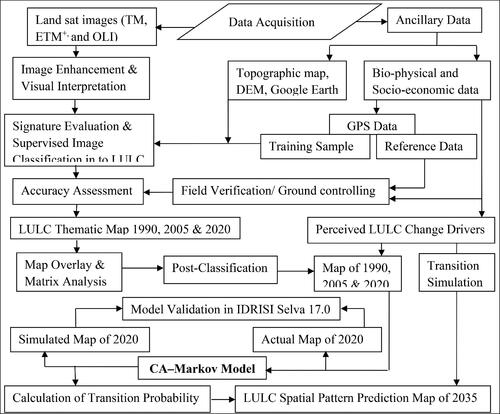
Figure 2. Methodological flow chart of LULC change detection and modeling.
3. Results
3.1. LULC class identification and accuracy assessment
Koore’s agricultural landscape has undergone considerable LULC changes over the recent last three decades. Imagery analysis made for two consecutive periods of 1990 to 2005 and 2005 to 2020 extracted about ten different LULC classes that ranging from the small to large area coverage (). In order to have accurate information derived from remotely sensed data, we have used 460 testing sites for each reference year images classification. The overall classification accuracy of 1990, 2005, and 2020 is 88.47%, 89.84% and 90.15% respectively (). According to Congalton and Green (Citation2009), the classification overall accuracy result of 1990, 2005, and 2020 which is >85% () implied that our landsat imagery classification is a high level of conformity between the classified image and the ground reality it represents. Besides, Viera and Garrett (Citation2005) concluded that Kappa coefficient depicts values from 0.81 to 0.99, 0.61to 0.80, 0.41 to 0.60, and 0.21 to 0.40 to be used as strong, considerable, sensible, and fair agreements respectively. So, kappa statistics results of the present study which lay between 0.81 − 0.99 indicated strong agreement between the classified image and the ground reality (). The accuracy assessment results of this study is consistent with some other studies conducted by the Kuma et al. (Citation2022) in Bilate catchment, Leta et al. (Citation2021) in Nashe watershed, and Temesgen et al. (Citation2021) in Gedeo-Abaya landscape.
Table 3. Accuracy assessment results of classified images.
Table 4. LULC classes and their changed shares in 1990, 2005 and 2020.
3.2. LULC change dynamics of koore’s agricultural landscape
3.2.1. General LULC change trends of the landscape
For the identified ten LULC classes, the results of 1990 to 2005 and 2005 to 2020 study periods showed continues increment in cultivation land, agroforestry, built-up/settlement and bare land. On the other hand forest, woodland, grazing land, shrub/bush land, and wetland of the studied landscape exhibited shrinkage (, ).
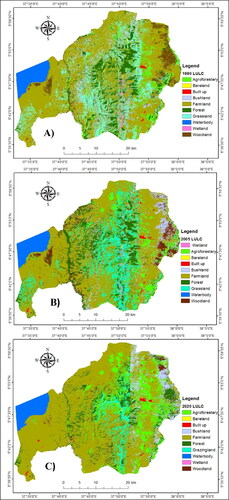
Figure 3. LULC Maps of 1990 (a), 2005 (B), and 2020 (C).
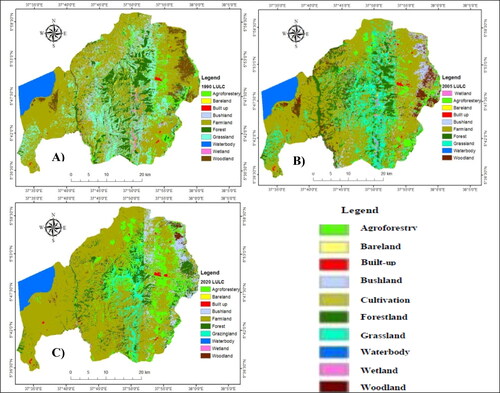
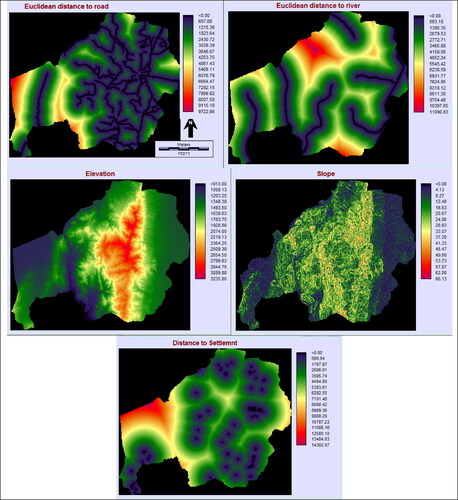
Figure 4. Suitability maps of spatial drivers.
In 1990, 2005 and 2020 study reference years, cultivation land was covered area of 49.54%, 53.45% and 58.17% respectively (). According to the result, it shared almost half and/or greater coverage of the total studied landscape. According to the imagery analysis result, over the three decades cultivation land exhibited totally 17.49% gain at 1.17% annual rate of change (). LULC change transition matrix result showed the conversion of high amount of hectares of grazing land, forest, bush/shrub land, and woodland in to cultivation (). In the study periods 1990-2005 and 2005-2020, agroforestry increased dramatically by 44.41% and, 101.85% with 2.96%, and 6.79% annual change rates respectively (). Over three decades, it showed 191.49% gain which exhibited second highest annual change rate 12.77% next to built-up/settlement (). Over the study periods, the highest transition of land to agroforestry occurred from cultivation and forest land-use classes ().
Table 5. LULC change statistics (in hectares).
Table 6. LULC change transition matrix of 1990–2005 in hectares.
Table 7. LULC change transition matrix of 2005–2020 in hectares.
Table 8. LULC change transition matrix of 1990–2020 in hectares.
Over the study periods of 1990–2005, and 2005–2020, built-up/settlement coverage was increased by 54.56% at 3.64% and 228.89% at 15.26% annual change rates respectively (). Whereas bare land exhibited considerably rise in the 2005–2020 study periods by 151.21% at 10.08% annual rate of increment (). According to the result of imagery analysis of the study period 1990–2005, forest land is decreased by 11.33% at a change rate of 0.76% annually (). Similarly at the 2005–2020 stay periods its coverage was declined by 10.05% at a change rate of 0.67 annually. Over the study periods its reduction was scored to 20.25% at a change rate 1.35% per a year (). Change transition matrix result showed the conversion of high amount of hectares of forest in to cultivation and agroforestry (). For 1990–2005 and 2005–2020 study periods, grazing land was decreased by 15.59% and 67.46% at a change rate of 1.04% and 4.5% per year respectively (). The overall stud periods result revealed spatial decline of grazing land by 72.54% at a change rate of 4.84% annually (). As the LULC change detection result showed that the highest grazing land was changed in to cultivation land over the study periods ().
At the beginning of the reference year wood and shrub/bush lands accounted to 4.8% and 8.05% from the total coverage of the study landscape, respectively (). Over the two study periods, woodland cover shrieked by 14.53% and 47.33% at annual rate of change 0.97% and 3.16% respectively (). Overall the study periods, shrub/bush land scored a reduction by 29.89% at a change rate of 1.99% per a year (). According to the area transition matrix result wood and shrub/bush land was mainly converted into cultivation land (). In the studied landscape, the coverage of wetland and water body at the first reference year of the study was 0.73% and 4.52%, respectively (). In the second study period, wetland showed highest shrinkage by losing its 82.93% portion at 5.53% annual rate of change (). Over all the studied periods, it exhibited 83.49% reduction at a change rate of 5.75% annually (). Over the study periods, wetland mainly converted in to cultivation, agroforestry, and grazing land (). Even though water body is the most stable land use class in the study landscape, it showed 5.79% shrinkage in the first study period. During this period, highest amount of area it lost was gained by cultivation and grazing land (). Then, it exhibited increasing trend with the magnitude of 3.37% in 2005–2020 study period (). But, it showed reduction in overall study periods by 2.61% at 0.17% change rate per year ().
3.3. Potential LULC change drivers of koore’s agricultural landscape
A Relative Importance Index (RII) analysis result revealed agricultural expansion (0.80) followed by indiscriminate cutting of trees for fuel/charcoal, house construction (0.74), and mono cropping culture (0.70) as a top ranked proximity LULC change drivers (). As proximity drivers of LULC change function at the local community level, they directly reflected how and why local land covers are modified and converted (Lambin et al. Citation2003). The top ranked underlying drivers of LULC change in the studied landscape are unprecedented population growth (0.83) which followed by land degradation (0.79), lack of livelihood options (0.72), lack of law enforcement (0.71), and political instability (0.69) ().
Table 9. Identified potential LULC change drivers of the landscape.
3.4. LULC change modeling and its future change trend
3.4.1. LULC change modeling and validation
To model LULC change, CA-Markov chain analysis which widely applied (Khwarahm et al. Citation2021; Tariq and Mumtaz Citation2023; Debnath et al. Citation2022; Tariq et al. Citation2022c; Nath et al. Citation2023) was applied with IDRISI Selva 17.0 software. The suitability atlas contains a series of suitability maps, which are usually built through the multi-criteria evaluation (MCE) (Liping et al. Citation2018) was used. The LULC prediction of the current study landscape was based on change in a driver’s impact. Five spatial drivers such as distance to road, river, and settlement, slope and elevation were used (). River, slope, and elevation data were derived from the DEM data of study area with a resolution of 30 × 30 m. The road data was digitized from 1:50,000 Ethio-topo maps. Settlements were extracted from LULC map of 2020. The effects of drivers were first evaluated using MCE transition rules and resulted in generating potential suitable maps ().
Table 10. Driver factors and their weight.
According to Temesgen et al. (Citation2021), the closer the distance between the nuclear cell and neighbor, the weight factor will be the larger. Liping et al. (Citation2018) stated that the weight factor is combined with the probabilities of transition to predict the state of adjacent grid cells, so that land use change is not a completely random decision. It was observed that variable such as distance from roads, rivers, and residence, elevation and slope are considered as useful variables of transitions based on their weighted factors value orderly (). According to Leta et al. (Citation2021), topography has effects on the spread and extent of urban distribution, forest and range land conversion to agricultural land, and other driver variables proximity for stream, urban areas, and roads also play an important role in land use change.
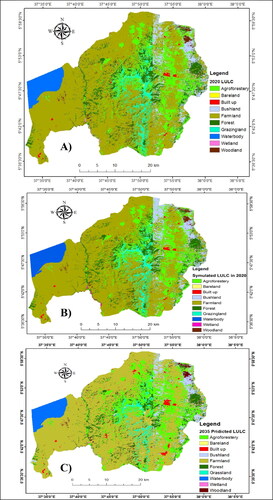
Applying the CA-Markov LULC change prediction model, the predicted distribution and coverage of different LULC types of the study landscape for the year 2035 are presented in and . The predictive power of the model was examined by comparing the actual and simulated LULC maps of 2020 and using the kappa indices. The validate module IDRISI Selva 17.0 software was used for validating the model by producing several parameters; mainly Kno, Klocation, and Kstandard that are used to identify the accuracy of the model. According to Khwarahm (Citation2021), the model is considered to be validated if the Kstandard (kappa value) exceeds 70% where as Debnath et al. (Citation2022) stated that the CA–Markov model has greater predictive power if its kappa value is greater than 80%. In this study all values of Kappa indices are greater than 95%, meaning that the agreement between the predicted and the actual map of 2020 is relatively high, showing a strong projection ability of the model to utilize it for LULC change prediction in 2035 ().
Figure 5. A = Actual LULC map of 2020, B = simulated LULC map of 2020, and C = predicted LULC map of 2035.
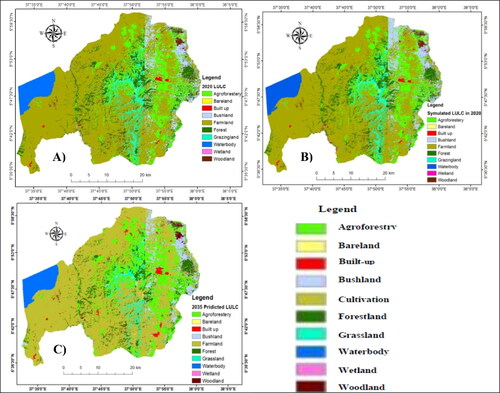
Table 11. Kappa index result of the model validation.
Visual comparison of the 2020 actual LULC map and simulated map ( and ) are reasonably similar. Shared area of all land use classes of actual and simulated maps also illustrates an acceptable range of decisions, in which the net area difference between the simulated and the actual maps of 2020 for all LULC types were less than 5% (). Regardless the extent of change of variations among classified land use types, the best agreement of change trends were observed with the past LULC changes and predicted LULC change results (). This high level of consistency among actual and predicted spatial land uses distribution confirms that the developed CA-Markov model is best fitted to predict LULC changes of Koore’s agricultural landscape in the year 2035.
Table 12. Actual and simulated LULC changes in 2020.
Table 13. LULC area coverage, its Percent, and rate of changes between 2020 and 2035.
3.4.2. Future LULC change trends in koore’s agricultural landscape
Future LULC change of Koore’s agricultural landscape has been predicted for the year 2035 (, ). The future time series distribution and conversion of LULC which analyzed by transition probability matrix is presented in . Besides, the LULC net change (gain/loss) was depicted by . Likely to the past three study decades, considerable change was observed between 2020 and 2035. The prediction result revealed substantial expansion of agroforestry, cultivation land, built-up/settlement and bare lands by the extent of change 3770.49 ha, 4040.90 ha, 580.41 ha and 171.2 ha at 1.26%, 0.33%, 1.81% and 2.62% annual rate of change respectively ().
Figure 6. A = 1990, 2005, 2020, and 2035 coverage of LULC classes; B = Net change of past three decades; C = net change of LULC classes over prediction period.
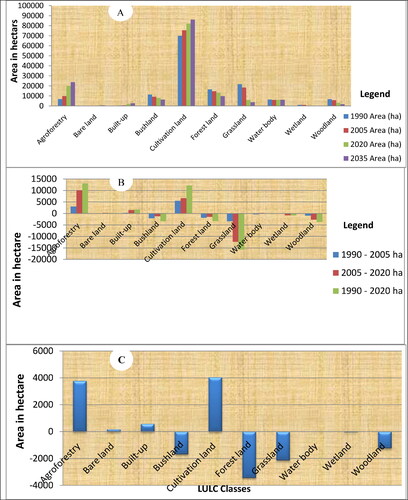
Table 14. LULC change transition matrix of 2020–2035 in hectares.
3.4.3. Future inter-class conversion trends of LULC change
Over the prediction period, the highest gain was reflected by cultivation land and agroforestry. Mainly for the observed progressive increment in these two land use classes, the continued conversion of natural vegetation classes is noted from transition probability matrix (). For instance, in the coming 15 years, 49.62% woodland, 43.65% grazing land, 21.67% bush/shrub land, and 17.15% of forest land would be converted into cultivation land (). In the same study period, agroforestry land use class would gain high amount of area from cultivation, forest, and bush/shrub land use classes (). Temesgen et al. (Citation2021) reported a similar finding that indicated the conversion of wood/shrub land, farmland and reverine forest dominantly in to agroforestry. Over 2020–2035; forest, bush/shrub, grazing land, and woodland would exhibited the highest loss by 5031.3 ha, 3665.4 ha, 2871.5 ha, and 1734.5 ha respectively (). The lowest loss could be scored by water body, wetland, built-up/settlement, and bare land. While the highest gain would be observed in cultivation and agroforestry, the lowest gain would be seen in wetland and water body.
As it is presented in , bare land and built-up/settlement would showed the highest value of net persistence compared to other land use classes. This implied their better change resisting endurance. As built-up/settlement is a very limited area that allowed for constructions like house and other infrastructures, its probability to be changed in to other land use classes is minimal. Since bare lands are rock out crops, extremely eroded steep slopes, and road construction side cuts; also it takes a long period of time to be changed in to other land use classes. Thus, it would reflect high level of change resistance in this study. This finding is similar to the finding of Kuma et al. (Citation2022) that indicated high net persistent value for the similar land use classes. On other hand; woodland (-0.95), grazing land (-0.69), and forest (-0.41) land-use classes would showed lower net persistent (). These lower values of net persistent reflected their high level of vulnerability in response to LULC change driving forces in Koore’s agricultural landscape. This is mainly would be credited for the past growing human population whose livelihood mainly based on agricultural activities and extracting forest resources.
4. Discussion
Cultivation land is a dominant land-use class in the studied landscape (). This can be linked with that 90% of the total population whose livelihood is based on rain-fed mixed (crop-livestock) agriculture living in rural setting. Detailed field checks confirmed that the cultivation land is still expanding in a greater extent. This finding implied susceptibility of the landscape from anthropogenic actions. It confirms the findings of Abebe et al. (Citation2022) that have been conducted in Gubalafito district, Northeastern Ethiopia and Kuma et al. (Citation2022) of Bilate catchment, southern Ethiopia that reported more than half of the studied catchments were cultivation land. Population growth, lack of livelihood options, inappropriate farming trends associated land degradation, market based mono-cropping culture which pushes farmers to have more arable land to produce more, and institutional weakness to enforce land use policy triggered the increase of cultivation land (). This finding is in line with the finding of Godebo et al. (Citation2018) and Abebe et al. (Citation2022). Tariq et al. (Citation2022b) also reported that pressure on natural resources due to population growth led to rise in cultivation land.
According to the focus group discussants and key informants, besides to population pressure to land resources, the first reference year of the study (1990) is the period at which Ethiopian military regime faced massive civilian war. This resulted in weakening its governance thus exacerbating the conversion of pristine environment mainly to cultivation land. In line with this finding, Tolessa et al. (Citation2017), Shiferaw et al. (Citation2019) and Leta et al. (Citation2021) indicated that expansion of cultivation land mainly due to ineffective land resources governance and excessive population pressure toward land resources. Besides, focus group discussions held reflected market-oriented high value crops production and mono-cropping development strategy of the country contributes for the expansion of cultivation land in the studied landscape. This finding is also justified by studies conducted in Ethiopia (e.g. Tolessa et al. Citation2017; Abebe et al. Citation2022) that concluded the policy that promoted industrial crops of high return and food self-sufficiency crop production has been realized expansion of cultivation.
Over the study periods agroforestry showed progressive increment (). This finding indicated motivation created in farmers to practice agroforestry system due to its multi-species benefits in the agricultural systems. It is in line with the finding of Temesgen et al. (Citation2021) that stated adoption of agroforestry system for its guarantee to sustain ecological services. According to 75 years old key informant: before 30 years ago, we did not worried about house construction material, wood for fire, animals feeding and land for cultivation since we were accessed everything from our surroundings freely including farmland. But since to two – three decades, competition on land resources in the surroundings is getting high. Consequently, today we are facing shortage of forest products and land for cultivation. Thus, our community starts to expand agroforestry as a mechanism to survive in the changing landscape. This notation implied that agroforestry is an alternative source of environmental services for the community. The finding of Temesgen et al. (Citation2021) that recognized agroforestry as a chief source of ecosystem services for local dwellers is in line with this finding. Focus group discussants reflected that cultivation land which used for annual cropping gradually changed to agroforestry. Their opinion is sound match with the imagery analysis results that cultivation land more contributes for the expansion of agroforestry (). Factors like shortage of cultivation land and degradation, increased risk of crop failure, and gradually developed awareness about multi-use of agroforestry pointed by the discussants for its expansion.
Built-up/settlement showed considerable increment specifically in the second study period (). Key informants said that, The main reason for the small coverage of earlier period of built-up/settlement was dispersal population settlement trend which dominated by coffee-enset based multi-strata home garden agroforestry. For today’s increment in built-up/settlement areas, responsible factors are state-sponsored resettlement program undertaken on food unsecured households, development program led displacement, and expansion of urban areas. This informant also justified the result of imagery analysis that showed high increment of buil-up/settlement in the second study period in the studied landscape (). The factors that have been identified for raising the land under built-up/settlement also reported by other studies (e.g. Dibaba et al. Citation2020; Leta et al. Citation2021; Kuma et al. Citation2022) are similar with this finding. More, other studies which conducted in other countries has reported raise in cultivation land (e.g. Khwarahm Citation2021; Tariq et al. Citation2021a; Tariq and Mumtaz Citation2023).
Bare land showed the highest increment in the second study period (). It is some parts of the landscape which is highly eroded and drained its natural nutrients to support vegetation. Since it included exposed rocks and some intensively cultivated steep slopes, this could have a direct link with inappropriate land use trends of the community. The result of this study is in line with the conclusion of previous studies (Abebe et al. Citation2022; Kuma et al. Citation2022), which reported high levels of exposed land in their study sites due to inappropriate land use practices.
Continued reduction of forest over the study periods at a change rate 1.35% per a year was observed (). Its annual change rate is higher than annual deforestation rate (0.97%) of the country (Marchant et al. Citation2018). This finding revealed that a very rapid deforestation that undertaking in the study landscape. As it has been noted from focus group desiccants and detailed field visit, some forested areas in the study landscape were destructed due to human interferences. According to their reflection, this was mainly happened during mass opposition that faced the EPRDF government in 2019/20. As per their opinion the mass opposition resulted in power vacuum government which is incapable to control the destruction of natural environment. This is consistent with the finding of many LULC studies conducted in Ethiopia (e.g. Tolessa et al. Citation2017; Shiferaw et al. Citation2019; Abebe et al. Citation2022). Studies in other countries also revealed decline in vegetation cover (e.g. Tariq et al. Citation2021a; Debnath et al. Citation2022). In contrast to the finding of our study, Kuma et al. (Citation2022) reported raise of forest coverage between 2002 and 2018 in Bilate catchment, southern Ethiopia. For the increment of forest in his study sites, he reasoned out degrade land rehabilitation programs and Eucalyptus plantation by framers.
Grazing land is showed continued shrinkage in the studied landscape (). Since the livelihood of inhabitants in the study landscape is based on mixed agriculture (crop-animal) husbandry system, the continued reduction of grazing land implied decline of cattle carrying capacity of the landscape. From held focus group discussions; land graving for cultivation, over grazing, fire and drought are responsible factors for the persisted decline of grazing land. These factors were also justified by the result of survey as they are responsible drivers of LULC change in the study landscape (). This finding conform the finding of Shiferaw et al. (Citation2019) that reported 600,000 ha (or 25%) of the grazing land areas that have been lost in Awash basin due to overgrazing, fire and drought. Some studies conducted in Ethiopia (Godebo et al. Citation2018; Temesgen et al. Citation2021) have reported a rapid reduction in grazing land due to ban of fire, drought, expansion of cultivation and continued human disturbances linked to overgrazing practices. In line with this finding Tariq et al. (Citation2021b) concluded as forest fire is a significant threat that destroyed forest ecology in Pakistan. On the other hand, Dibaba et al. (Citation2020) have reported the increase in grazing land due to the restoration activities undertaken by government and non-governmental organizations.
Woodland is declined over all the study periods in the study landscape (). This is credited to the agricultural land expansion which is associated with extensive trees cutting. There are other studies that reported a decline in woodland in Ethiopian (e.g. Godebo et al. Citation2018; Temesgen et al. Citation2021). In the study periods, woodland class was the main contributor for cultivation land () implied slash of trees from the woodland for cropping purpose. Up to the collapse of Ethiopian military regime which known by its campaign based degraded land rehabilitation and tree-planting programs, the studied landscape woodland cover was better. But at the last study period, the remained woodland class cover of the landscape is below half of its military regime. This indicated the negative impact of political regime shifts on land resources. This finding is in line with the finding reported by Tolessa et al. (Citation2017) that stated devastation of natural environment during power vacuum period of government changing occasion.
Followed the rapid reduction of shrub/bush land at 1.99% annual rate of change (), the computed transition matrix showed the major LULC classes that it contributed for were cultivation and built-up/settlement (). Key informants pointed that shrub/bush land modification could be attributed to cutting of trees for firewood and shrub/bush slash for cultivation. This could be related to fast growth in human population. This finding is in line with the finding of Godebo et al. (Citation2018) studied in the Bilate Alaba Sub-watershed, Southern Ethiopia and Temesgen et al. (Citation2021) studied in Gedeo-Abaya, south eastern escarpment.
The finding of this study showed the decline of wetland in the study landscape over the study periods (). Key informants interview revealed that deforestation led siltation, drought, rapid population growth-led cultivation land expansion, grazing and lack of adequate management are considered as potential causes for the degradation of wetland ecology in the study landscape. This finding confirms the finding of previous studies (Dibaba et al. Citation2020; Zekarias et al. Citation2021) that reported shrinkage of wetland due to crop farming, livestock grazing and settlement. As well our landsat imagery analysis result indicated a slight increment of water body in the last study period (). As it was verified by site visit, water level of the lake Chamo has increased and expanding toward the southern alluvial plain and threatening the farmlands. The lateral expansion of the lake is facilitated by sediment deposition form the degraded adjacent farms. This implied situation of progressive sediment siltation of the lake that resulted in rise of its water level. This finding is in line with the finding of (Zekarias et al. Citation2021) that reported the recent years’ Lake Chamo water level is raised due to siltation.
This study revealed agricultural expansion, indiscriminate cutting of trees for fuel, house construction, and mono cropping culture among a top ranked proximity LULC change drivers (). Key informants noted that the expansion of cultivation land is mainly due to its encroachment in to other land use classes. This finding confirmed the conclusion of Shiferaw et al. (Citation2019) that stated expansion of agricultural land is driven by seekers of extra agricultural produces for survival. As it was revealed at focus group discussion the study area is inaccessible of hydroelectric power. As a result the community is totally dependent on biomass energy. More the community is reliant on forest products for their house unit construction and timbering. These phenomena favored for LULC change through deforestation. This finding is in line with the findings of (Godebo et al. Citation2018; Abebe et al. Citation2022; Temesgen et al. Citation2021) that stated extensive cutting of trees for the decline in woodland cover.
Unprecedented population growth, land degradation, lack of law enforcement, and political instability are listed as underlying drivers of LULC change in the study area (). It is evident that growth in population raises the need for arable land, biomass energy, and settlements. According to 80 years old elder: Nowadays variety of tree species which were predominantly found in the area, were steadily disappears and at present no longer visible or are available in limited amounts and coverage. As the fertility of the farm land has exhausted, unlike the past, steep slopes are currently under cultivation. This statement ascribed the finding of (Shiferaw et al. Citation2019; Abebe et al. Citation2022; Leta et al. Citation2021; Kuma et al. Citation2022). This holds true if the human capital is underdeveloped to manage their environment, and lacked diversified means of livelihood. Besides, in series of formal group discussions held to identify the major driving forces of LULC changes, political regime shift is noted as it led to weaken governmental institutions. This in turn led in a season of ‘Null Law Enforcement’ thus farmers easily converted land in to cultivation land illegally. This finding is similar with the finding of Tolessa et al. (Citation2017) that recognized power vacuum in governance led to ruin of natural environment.
LULC change prediction result revealed expansion of anthropogenic induced land-use classes like cultivation land at the expense of pristine environment (). This is an apparent indicator of a continued human disturbance in the study landscape. Agricultural land expansion might be principally associated with the land demand for annual crop production. The finding of this study is in line with the research finding of Leta et al. (Citation2021). Studies in other countries also showed similar fashion of future change tendency in agricultural land (e.g. Khwarahm Citation2021; Tariq et al. Citation2021a; Debnath et al. Citation2022; Tariq and Mumtaz Citation2023). According to focus group discussion and key informants description, practicing of agroforestry is mainly credited for the local community’s coping up mechanisms to challenges they faced in the form of shortage of wood for house construction, energy, land degradation, and shortage of animal feed as a result of deforestation. This finding is in line with the finding of Temesgen et al. (Citation2021) that concluded the expansion of agroforestry system as a sustainable farming culture of Gedeo community.
As the result of LULC change prediction revealed for the prediction period (2020–2035), built-up/settlement and bare land increased (). The rise in built-up/settlement would be related to the fast growing population and the rise in demand for infrastructure development that can be provided followed settlement. Upcoming increment in bare land class would imply the continuation of community’s past trends (inappropriate use of arable land and intensive cultivation of steep sloped area) over the projection period. Similar study conducted in Nashe watershed by Leta et al. (Citation2021) reported related justification for the progressive incremental change trends in residences and bare land. Studies on similar theme which conducted out of Ethiopia indicated tendency of increment in built-up/settlements (e.g. Khwarahm Citation2021; Tariq et al. Citation2021a; Tariq et al. Citation2022a; Nath et al. Citation2023).
According to the result of LULC change modeling, natural environment classes (forest, woodland, grazing land, wetland, and shrub/bush) would exhibited reduction (). This finding confirmed that as past and currently observed trend of LULC change could be continued in the studied landscape at a business as a usual state of affairs. So the decrease in biomass would be the highest in the Koore agricultural landscape in the coming 15 years. This finding is parallel of Temesgen et al. (Citation2021) and Leta et al. (Citation2021) that reported occurrence of high pressure of change on woodland, grazing land, and forests in the future unless change controlling mechanisms would be adjusted and adopted in their study areas.
5. Conclusion and recommendations
Over the past three decades Koore’s agricultural landscape has been experiencing evident LULC change principally from natural environment classes to anthropogenic modified land-use classes. Consequently, the landscape has exhibiting alarming rate of increment in cultivation, built-up/settlement, and bare land at the expense of forest, woodland, grazing land, bush/shrub, and wetland. This implied that as the ongoing LULC change of the study landscape has adverse effects on its sustainability. Across the study landscape rapid population growth, agricultural land expansion, land degradation, high level of dependence on biomass energy, political instability and blanket cutting of trees remains a key driving agent of the ongoing LULC change.
CA-Markov model predicted incremental changes in anthropogenically induced land use classes such as built-up/settlement, bar land, cultivation, and agroforestry system. Other natural vegetation classes (forest, woodland, grazing land, bush/shrub, and wetland) would be declined at varied rate of change at state of anthropogenic LULC change driving forces would be kept as a usual. This put in mind the highest expectation of reduction in biomass that would occur in the Koore agricultural landscape. Even though the increment of practicing agroforestry system would has a paramount implication for environmental sustainability as well as biodiversity conservation in the studied landscape, fashion of decline which would kept in natural vegetation classes needs pressing intervention to reverse the situation.
Therefore, the studied landscape desires for a proper land use plan and sustainable land management practices that would focus on controlling encroachment of cultivation into natural land use classes. Agroforestry practice which is known by its multi benefited variety of woody species in agricultural systems should be scaled up by putting in place strategies that promote its practicing. Diversifying the means of livelihood of the community and providing alternative energy sources are mandatory to lessen adverse effect of the ongoing LULC change on natural environment in Koore’s agricultural landscape. Finally, this study proposes future studies on the impact of LULC change on biodiversity and ecosystem services.
Additional information
Questionnaire used for survey has been submitted as additional information for this paper.
Authors’ contributions
Aden Abdurahman conceptualization, data collection, analysis, writing of the draft manuscript, and editing; Kitessa Hundera and Eshetu Yirsaw given guidance for the paper, reviewing, commenting, and editing; Wondafiraw Nigussie, analysis and commenting. All authors read and approved the final manuscript.
Ethical approval
No parts of the study that concern about human and/or animal lab in this study.
Acknowledgments
We would like to thank Jimma university, Dilla University and the local government of Koore for providing some material support for the study. We, the authors are pleased to thank the USGS for the provision of Landsat data. We are also grateful to the study landscape local leaders, natural resources management experts, other key informants, focus group discussion participants, and sampled respondents who provided us with the required information. The authors are grateful to all the anonymous reviewers whose invaluable suggestions improved the quality of this manuscript.
Data availability statement
The data that has been used is confidential. All landsat images were acquired from the United States Geological Survey (USGS) website available at (https://earthexplorer.usgs.gov).
Disclosure statement
The authors declare that they have no conflict of interest.
Additional information
Funding
References
- Abebe G, Getachew D, Ewunetu A. 2022. Analyzing land use/land cover changes and its dynamics using remote sensing and GIS in Gubalafito district, Northeastern Ethiopia. SN Appl Sci. 4(1):30. doi: 10.1007/s42452-021-04915-8.
- Alam A, Sultan M, Maheen M. 2020. Using Landsat satellite data for assessing the land use and land cover change in Kashmir valley. Geo. Journal. 85(6):1529–1543. doi: 10.1007/s10708-019-10037-x.
- Azman N, Ramli M, Razman R. 2019. Relative importance index (RII) in ranking of quality factors on industrialized building system (IBS) projects in Malaysia. AIP Conf. Proc. 2129, 020029-1–020029-7; doi: 10.1063/1.5118037.
- Cochran G. 1963. Sampling techniques. 2nd edition. New York, USA: john Wiley and Sons, Inc.
- Congalton G, Green K. 2009. Assessing the accuracy of remotely sensed data: principles and practices, 2nd edn. CRC Press, Taylor & Francis Group, Boca Raton.
- Debnath J, Sahariah D, Lahon D, Nath N, Chand K, Meraj G, Farooq M, Kumar P, Kanga S, Suraj K, et al. 2022. Geospatial modeling to assess the past and future land use‑land cover changes in the Brahmaputra Valley, NE India, for sustainable land resource management. Environ Sci Pollut Res. doi: 10.1007/s11356-022-24248-2.
- Dibaba T, Demissie A, Miegel K. 2020. Drivers and Implications of Land Use/Land Cover Dynamics in Finchaa Catchment, Northwestern Ethiopia. Land. 9(4):113. doi: 10.3390/land9040113.
- EFAP. 1994. Ethiopian Forestry Action Program. Addis Abeba, Ethiopia: EFAP.
- FAO. 2011. The state of the world’s land and water resources for food and agriculture managing systems at risk. Food and Agriculture Organization of the United Nations, Rome.
- FAO. 2015. Global Forest Resources Assessment 2015: how have the world’s forests changed? Rome, Italy: Food and Agriculture Organization of The United Nations.
- FAO. 2016. Challenges facing agriculture and food security (Ethiopia).Rome: emergency and Rehabilitation Division, Food and Agriculture Organization of the United Nations.
- FAO. 2020. Global forest assessment resources 2020 (No.163). Forestry Paper. Rome, Italy.
- FDRE. 1994. Constitution of the Federal Democratic Republic of Ethiopia, Addis Ababa Ethiopia, pp. 50.
- Godebo M, Ulsido M, Jijo T, Geleto G. 2018. Influence of land use and land cover changes on ecosystem services in the Bilate Alaba Sub-watershed,Southern Ethiopia. Journal of Ecology and the Natural Environment. 10(9):. 28–238. DOI:10.5897/JENE2018.0709.
- Guan J, Li F, Inohae T, Su C, Nagaie T, Hokao K. 2011. Modeling urban land use change by the integration of cellular automaton and Markov model. Ecol. Model. 222(20-22):3761–3772. doi: 10.1016/j.ecolmodel.2011.09.009.
- Han H, Yang C, Song J. 2015. Scenario simulation and the prediction of land use and land cover change in Beijing, China. Sustainability. 7(4):4260–4279. doi: 10.3390/su7044260.
- Hoque M, Cui S, Islam I, Xu L, Ding S. 2021. Dynamics of plantation forest development and ecosystem carbon storage change in coastal Bangladesh. Ecological Indicators. 130:107954. doi: 10.1016/j.ecolind.2021.107954.
- Khwarahm N. 2021. Spatial modeling of land use and land cover change in Sulaimani, Iraq, using multitemporal satellite data. Environ Monit Assess. 193(3):148. doi: 10.1007/s10661-021-08959-6.
- Khwarahm N, Najmaddin P, Ararat K, Qader S. 2021. Past and future prediction of land cover land use change based on earth observation data by the CA–Markov model: a case study from Duhok governorate, Iraq. Arab J Geosci. 14(15):1544. doi: 10.1007/s12517-021-07984-6.
- Kuma H, Feyessa F, Demissie A. 2022. Land-use/land-cover changes and implications in Southern Ethiopia: evidence from remote sensing and informants. Heliyon. 8(3):e09071. doi: 10.1016/j.heliyon.2022.e09071.
- Lambin F, Geist J, Lepers E. 2003. Dynamics of land-use and land-cover change in tropical regions. Annu Rev Environ Resour. 28(1):205–241. doi: 10.1146/annurev.energy.28.050302.105459.
- Leta K, Demissie A, Tränckner J. 2021. Modeling and Prediction of Land Use Land Cover Change Dynamics Based on Land Change Modeler (LCM) in Nashe Watershed, Upper Blue Nile Basin, Ethiopia. Sustainability. 13(7):3740. doi: 10.3390/su13073740.
- Liping C, Yujun S, Saeed S. 2018. Monitoring and predicting land use and land cover changes using remote sensing and GIS techniques: a case study of a hilly area, Jiangle, China. PLoS ONE. 13(7):e0200493. doi: 10.1371/journal.pone.0200493.
- Marchant R, Richer S, Boles O, Capitani C, Courtney-Mustaphi CJ, Lane P, Prendergast ME, Stump D, De Cort G, Kaplan JO, et al. 2018. Drivers and trajectories of land cover change in East Africa: human and environmental interactions from 6000 years ago to present. Earth Sci. Rev. 178:322–378. doi: 10.1016/j.earscirev.2017.12.010.
- Mohajane M, Essahlaoui A, Oudija F, Hafyani M, Hmaidi A, Ouali A, Randazzo G, Teodoro A. 2018. Land Use/Land Cover (LULC) Using Landsat Data Series (MSS, TM, ETM + and OLI) in Azrou Forest, in the Central Middle Atlas of Morocco. Environments. 5(12):131. doi: 10.3390/environments5120131.
- Mucova A, Filho L, Azeiteiro M, Pereira J. 2018. Assessment of land use and land cover changes from 1979 to 2017 and biodiversity & land management approach in Quirimbas National Park, Northern Mozambique, Africa. Global Ecol Conserv. 16(447):e00447. doi: 10.1016/j.gecco.2018.e00447.
- Nath N, Sahariah D, Meraj G, Debnath J, Kumar P, Lahon D, Chand K, Farooq M, Chandan P, Singh SK, et al. 2023. Land Use and Land Cover Change Monitoring and Prediction of a UNESCOWorld Heritage Site: kaziranga Eco-Sensitive Zone Using Cellular Automata-Markov Model. Land. 12(1):151. doi: 10.3390/land12010151.
- Risma Z, Paharuddin F. 2019. Prediction of land use and land cover (LULC) changes using CA-Markov model in Mamuju Subdistrict. J. Phys.: Conf. Ser., 8, 082033, 1341. Conference Series 1341 082033. doi: 10.1088/1742-6596/1341/8/082033.
- RSA. 2007. Southern Nation Nationalities and Peoples of Regional State ―Regional Statistical Agency Abstract‖. Hawassa.
- Sharma J, Prasad R, Mishra N, Yadav P, Bala R. 2018. Land use and Land cover classification of multispectral landsat-8 satellite imagery using discrete wavelet transform. The International Archives of the Photogrammetry, Remote Sensing and Spatial Information Sciences, XLII-5, ISPRS TC V Mid-Term Symposium “Geospatial Technology – Pixel to People, p. 20–23. November 2018.
- Shiferaw H, Schaffner U, Bewket W, Alamirew T, Zeleke G, Teketay D, Bekele K, Schaffner U, Eckert S. 2019. Modelling the current fractional cover of an invasive alien plant and drivers of its invasion in a dryland ecosystem. Sci Total Environ. 675:354–366. doi: 10.1038/s41598-018-36587-7.
- Tariq A, Mumtaz F. 2023. Modeling spatio-temporal assessment of land use land cover of Lahore and its impact on land surface temperature using multi-spectral remote sensing data. Environ Sci Pollut Res Int. 30(9):23908–23924. doi: 10.1007/s11356-022-23928-3.
- Tariq A, Mumtaz F, Majeed M, Zeng X. 2022a. Spatio-temporal assessment of land use land cover based on trajectories and cellular automata Markov modelling and its impact on land surface temperature of Lahore district Pakistan. Environ Monit Assess. 195(1):21. doi: 10.1007/s10661-022-10738-w.
- Tariq A, Shu H. 2020. CA-Markov chain analysis of seasonal land surface temperature and land use landcover change using optical multi-temporal satellite data of. Remote Sensing. 12(20):3402. doi: 10.3390/rs12203402.
- Tariq A, Shu H, Siddiqui S, Imran M, Farhan M. 2021a. Monitoring Land Use And Land Cover Changes Using Geospatial Techniques, A Case Study Of Fateh Jang, Attock, Pakistan. GES. 14(1):41–52. doi: 10.24057/2071-9388-2020-117.
- Tariq A, Shu H, Siddiqui S, Munir I, Sharifi A, Li Q, Lu L. 2021b. Spatio‑temporal analysis of forest fire events in the Margalla Hills, Islamabad, Pakistan using socio‑economic and environmental variable data with machine learning methods. Journal of Forest Resources. 32(3):12. doi: 10.1007/s11676-021-01354-4.
- Tariq A, Yan J, Gagnon A, Khan M, Mumtaz F. 2022b. Mapping of cropland, cropping patterns, and crop types by combining optical remote sensing images with decision tree classifier and random forest. Geo-Spatial Informantion Science. :1–19. doi: 10.1080/10095020.2022.2100287.
- Tariq A, Yan J, Mumtaz F. 2022c. Land change modeler and CA-Markov chain analysis for land use land cover change using satellite data of Peshawar, Pakistan. Physics and Chemistry of the Earth Parts A/B/C. 128:103286. doi: 10.1016/j.pce.2022.103286.
- Temesgen H, Wu W, Legesse A, Yirsaw E. 2021. Modeling and prediction of effects of land use change in an agroforestry dominated southeastern Rift-Valley escarpment of Ethiopia. Remote Sens Appl: soc Environ. 21:100469. DO -doi: 10.1016/j.rsase.2021.100469.
- Tolessa T, Senbeta F, Kidane M. 2017. The impact of land use/land cover change on ecosystem services in the central highlands of Ethiopia. Ecosyst Serv. 23:47–54. doi: 10.1016/j.ecoser.2016.11.010.
- Viera A, Garrett M. 2005. Understanding inter observer agreement: the kappa statistic. Fam. Med. 37(5):360–363.
- Wang S, Gebru M, Lamchin M, Kayastha B, Lee W. 2020. Land Use and Land Cover Change Detection and Prediction in the Kathmandu District of Nepal Using Remote Sensing and GIS. Sustainability. 12(9):3925. doi: 10.3390/su12093925.
- Xie C, Batty M, Zhao K. 2007. Simulating emergent urban form using agent-based modeling: desakota in the suzhou-wuxian region in China. Ann. Assoc. Am. Geogr. 97(3):477–495. doi: 10.1111/j.1467-8306.2007.00559.x.
- Yirsaw E, Wu W, Shi X, Temesgen H, Bekele B. 2017. Land use/land cover change modeling and the prediction of subsequent changes in ecosystem service values in a coastal area of China, the Su-Xi-Chang Region. Sustainability. 9(7):1204. doi: 10.3390/su9071204.
- Zekarias T, Vanum G, Kebede Y, Gelaw A. 2021. Geospatial Analysis of Wetland Dynamics on Lake Abaya-Chamo, The Main Rift Valley of Ethiopia. J.Heliyon. 7(9):e07943. doi.org/10.1016 doi: 10.1016/j.heliyon.2021.e07943.
Appendix A.
LULC maps of 1990, 2005, and 2020
Figure A1. A = Map of 1990, B = map of 2005, C = map of 2020.
Appendix B.
Actual and simulated LULC map of 2020 and predicted LULC map of 2035
Figure B1. A = Actual LULC map of 2020, B = simulated LULC map of 2020, and C = predicted LULC map of 2035.
Appendix C.
LULC accuracy assessment of 1990, 2005, and 2020
Table C1. LULC accuracy assessment in 1990.
Table C2. LULC accuracy assessment in 2005.
Table C3. LULC accuracy assessment in 2020.