
Abstract
The earth’s surface linear features, expressing geological lineaments, play a key role in identifying hydrothermal alteration and mineralization zones, as well as in understanding tectonic settings of a region. The objective of this investigation is to utilize a method for extracting lineaments automatically, which will be integrated and applied to identify geological-based lineaments by making use of remote sensing data. The study will further examine the structural pattern and temporal-spatial evolution of the lineaments and establish their connection with the primary active faults present in the Kabul Block. Multi-sensor data from radar (DEM (Digital Elevation Model)-5m, Sentinel-1B GRD (Ground Range Detected)) and optical sensors (Sentinel-2 MSI (Multispectral Instrument) and ASTER) were processed using spatial and spectral filters before automatic lineament extraction. LINE-module algorithm was applied to various illuminated hill-shades of DEM-5m, filtered HH (Horizonal-Horizonal) and VH (Vertical-Horizontal) of Sentinel-1GRD and PC1 (Principle Component) of Sentinel-2A MSI, and ASTER data to detect linear surface features. Extensive testing was conducted to verify the accuracy of extracted lineaments and to exclude any artificial lineaments in the study area. The radar and optical data results were compared while taking into consideration the geological and tectonic settings of the study area to select the most appropriate extracted lineaments. The DEM-5m and Sentinel-1B GRD showed the best result for identifying lineaments, and these were found to be highly correlated with previously available data in the Kabul Block. The final results of DEM-5m and Sentinel-1B GRD were further analyzed. The extracted lineaments were found to trend predominantly in a NW-SE and NE-SW directions, which is consistent with the results of other data. Temporal evolution and spatial distribution reveal that a high density of the lineaments is associated with Paleogene and Quaternary formations, while a low density is observed in Proterozoic, Paleozoic, and Mesozoic formations. The west and southwest edges of the Kabul Block are controlled by compressive stress trending NNW-SSE, while the north and southeast margins are influenced by NE-SW and ∼ N-S trending compressive stress.
Introduction
Lineaments refer to mappable naturally occurring linear features of the earth’s surface that can be contrasted from the adjacent features by the distinct patterns (Pal et al. Citation2006; Ahmadi and Pekkan Citation2021; Xu et al. Citation2022). They can represent crests of ridges, drainage lines, coastlines, the boundary of rock formation, or any artificial structures (De Oliveira Andrades Filho and De FáTima Rossetti Citation2012; Narayan et al. Citation2017; Soliman and Han Citation2019). Based on Ahmadi and Pekkan (Citation2021), the lineaments can be considered under two classifications; genetical and topological. Lineaments in the case of genetical can be geologic (resulting from tectonic activities), geomorphologic or topographic (due to geomorphologic processes), and pseudo in nature. From a topological perspective, lineaments can be categorized as positive (linear ridges) and negative (linear valleys, drainages, faults, fractures, and joints). In geological studies, the lineaments are applied for many purposes, for example, lithological mapping (Pal et al. Citation2007; Binam Mandeng et al. Citation2018; Yamusa et al. Citation2018; Es-Sabbar et al. Citation2020; Ahmadi and Kalkan Citation2021; Farah et al. Citation2021), hydrothermal alteration zones mapping (Githenya et al. Citation2019; Nait Amara et al. Citation2019; Sheikhrahimi et al. Citation2019; Abdelouhed et al. Citation2021; Maleki et al. Citation2021; Abdelkader et al. Citation2022; Badawi et al. Citation2022; El-Desoky et al. Citation2022), morphotectonics and active fault detections (Akram et al. Citation2019; Elhag and Alshamsi Citation2019; Msaddek et al. Citation2019; Pandey and Sharma Citation2019; Sahoo and Pal Citation2019; Pecsmány et al. Citation2021; Viveen et al. Citation2021; Chouhan et al. Citation2022; Sarkar et al. Citation2022), ore deposits and mineral prospecting and exploration (Yousefi et al. Citation2018; Lakshmi Keshava Kiran Kumar et al. Citation2020; Mohammadpour et al. Citation2020; Ahmadi and Uygucgil Citation2021; Guha et al. Citation2021; Shebl et al. Citation2021; Tende et al. Citation2021; Shirazi et al. Citation2022; Timkin et al. Citation2022), hydrogeology and groundwater exploration (Akinluyi et al. Citation2018; Ahmed et al. Citation2019; Al-Djazouli et al. Citation2019; Oyedele Citation2019; Epuh et al. Citation2020; Tagnon et al. Citation2020; Ahmadi et al. Citation2021; Shebl et al. Citation2022), hydrocarbon prospecting and exploration (Innocent et al. Citation2019; Akanji et al. Citation2020; Kokinou and Panagiotakis Citation2020; Ngoroyemoto Citation2021; Saha Citation2022), geothermal potentials (Saepuloh et al. Citation2018; Kanda et al. Citation2019; Barkah and Daud Citation2021; Awoyemi et al. Citation2022; Joel et al. Citation2022), landslides mapping (Mallick et al. Citation2018; Basu and Pal Citation2019; Singh et al. Citation2020; Lahai et al. Citation2021; Sadiq et al. Citation2022) and construction engineering projects (Radaideh et al. Citation2016; Kapilan and Elangovan Citation2018; Sigtryggsdóttir and Snæbjörnsson Citation2019; Othman et al. Citation2020; Mallick Citation2021).
Geological lineaments can be detected either automatically or manually. Automatic geological lineament detection is considered faster and more efficient than manual (visual) interpretation, which depends more on the analyst’s experience. The accurate extraction of lineaments that express geological meaning is a challenging task (Seyitoğlu et al. Citation2019). It requires analysts to have more experience and geologic perspectives to monitor the extracted lineaments carefully and avoid confusing them with non-geological lineaments (Ahmadi and Pekkan Citation2021; Dhara et al. Citation2022). During the last few decades, a wide range of remote sensing datasets and algorithms, with their robust capability in geological studies, have helped scientists obtain objective results with automatic approaches rather than manual techniques. Various optical data, such as Landsat series data, ASTER, Sentinel-2MSI (Wang and Howarth Citation1990; Rowan and Mars Citation2003; Ramli et al. Citation2010; Elhag and Alshamsi Citation2019; Sichugova et al. Citation2021), radar data e.g. InSAR, Sentinel-1B, ALOS PALSAR, DEM (Pour and Hashim Citation2015; Adiri et al. Citation2017; Elmahdy et al. Citation2021; Ghosh et al. Citation2021), and geophysical data (Lesage et al. Citation2019; Kemgang Ghomsi et al. Citation2022; Naprstek and Smith Citation2022; Pham et al. Citation2022) have been examined to detect and analyze the geological lineaments worldwide.
The earliest mapping of geological lineaments dates back to 1975 by Podwysocki et al. (Citation1975) in the Anadarko basin, Oklahoma, and Colorado Plateau. In this study, the authors used a computer-aided automated lineament extraction technique by examining the high-pass filtering on Landsat-1 data. The number of lineaments that were identified during the extraction process exceeded the number present on the map. However, the analysts raised the possibility of artifact lineaments in the study. Another automated lineament extraction technique, the Segment Tracing Algorithm (STA) was proposed by Koike et al. (Citation1995). In this study, the authors examined the algorithm over the mountainous areas of southwestern Japan on Landsat TM data. The authors defined their algorithm based on its capability to trace only continuous valleys and extract more lineaments paralleling the sun’s azimuth and those located in shadow areas over usual filtering methods. Mavrantza and Argialas (Citation2003) applied several linear and non-linear spatial high pass filters and edge detection algorithms, such as Canny, Rothwell, and Black’s anisotropic edge detectors, for automatic lineament detection on Landsat – ETM + in Alevrada in Central Greece. A MATLAB-based toolbox, TecLines (Tectonic Lineament Analysis), was introduced by Rahnama and Gloaguen (Citation2014) to locate and quantify the lineament patterns using satellite data and DEMs. The toolbox works based on frequency and spatial filters, tensor voting, Hough transform, and polynomial fitting. Another computer-aided tool for automatic lineament detection, LINDA (Lineament Detection and Analysis), was developed by Masoud and Koike (Citation2017). The authors tested the tool with DEM and Landsat ETM + within the Southeastern Deserts of Egypt to verify its functions and capabilities. Recently, several researchers have used the Line module of PCI Geomatica on DEM-derived shaded relief being illuminated with multiple illumination directions and other remote sensing data over different locations worldwide (Akram et al. Citation2019; Ghosh et al. Citation2021; Kamal El-Din et al. Citation2021; Shebl and Csámer Citation2021; Abdelouhed et al. Citation2022; Tende et al. Citation2022; Ranjbari et al. Citation2023).
Limited studies on structural analysis expressing geological lineaments have been carried out in Afghanistan, there is no detailed associated investigation within the Kabul Block. Only a few preliminary studies in the form of reports or local journal articles, on the lineament analysis focus on areas rather than the Kabul Block. The report by Hubbard et al. (Citation2012) evaluated the lineaments across 24 AIOs (Areas of Interests for mineral occurrences) described by Peters et al. (Citation2011). In this report, the authors attempted to identify and extract all linear structures that were mappable by using remote sensing data. Structural investigations of Afghanistan using remote sensing, geophysical, and field data were conducted by Saibi et al. (Citation2016). In this study, the authors discussed the whole structural condition of the country by examining the regional data. Another study by Rustami et al. (Citation2017) investigated the structural and tectonic evolution of Central Afghanistan using remote sensing and gravity data. Within the framework of this study, the authors analyzed the lineaments and then integrated them with the gravity data to better understand the 3D geology of the study area. Mohammadi et al. (Citation2020) assessed the lineaments of the Aynak Copper mines, located southwest of the Kabul Block, in their work published in the conference proceeding. In this study, the authors examined ALOS PALSAR and Landsat 8 OLI/TIRS data for automatic lineament extraction, whereas QuickBird was used for manual lineaments extraction.
Based on an extensive literature review of automatic geological lineament extraction, there is currently a lack of accurate and specific approaches available for the geological-based extraction of lineaments, both globally and within Afghanistan. Many of the automated algorithms currently in use produce subjective outputs that are prone to the creation of artifact linear features. Their applicability is highly dependent on various factors, such as data quality and the study area. This highlights the need for a more robust and objective approach to extracting geological lineaments in this region. Moreover, despite the considerable amount of research conducted in the Kabul Block, there is a significant gap in the detailed assessment of geological lineaments in this region. In particular, there is a lack of research on the validation, structural analysis, temporal evolution, and spatial distribution of these lineaments, which are crucial for understanding the geological and tectonic implications of the area. Therefore, the present study aims to fill this gap by combining radar and optical data to extract geological lineaments and conduct a detailed analysis of their characteristics and implications. The findings of this study will not only contribute to a better understanding of the geology and tectonic processes of the Kabul Block but also provide a more objective approach to the extraction of geological lineaments in similar regions globally. Therefore, this study is carried out in the Kabul Block and aims to: 1) map the geological lineaments using the integrated algorithms via the combination of optical and radar data, 2) assess the accuracy to distinguish them from artifacts, 3) analyze the structural architecture and descriptive statistics, 4) investigate the temporal evolution of the extracted geological lineament based on the geological age of units, and 5) validate the results based on the active fault segments of the study area. The output of this study can significantly contribute to further investigation associated with detailed neotectonics study, lithological mapping, mineral exploration, hydrogeological studies, seismic and earthquake hazard assessment, and construction projects.
Geographic and geologic settings
The NE-SW trending Kabul Block in eastern Afghanistan is located between 69°15/59.07//- 68°28/37.65//E and 35°09/50.54//- 33°28/53//N with an average elevation of 2678 m. It is characterized by an elongate oval shape, about 200 km in length and 70 km wide (). Based on the orogenic segments divisions in Afghanistan, the Kabul Block is a part of the Himalayan-Alpine realm that represents the collision of the Indian Plate with the Afghan promontory of the Eurasian Plate, which began at about 55 Ma in the southeastern corner of Afghanistan () (Khan and Clyde Citation2013; Siehl Citation2017). The Kabul Block with other Afghan Central Blocks (Farah and Helmand), adjoins the Indian and Eurasian continental plates by suture zones (Collett and Faryad Citation2015; Ahmadi and Uygucgil Citation2021). In the north, it is separated from the Eurasian Plate by the Herat-Panjsher Suture Zone. Meanwhile, in the southeast, the Katawaz basin and Waziristan ophiolitic complex indicate the joining of the Indian Plate (Treloar and Izatt Citation1993). The Kabul Block is limited by the active fault zones resulting in separation from the adjacent Afghan Blocks. To the west, the Chaman fault zone separates it from the Helmand Block; to the north, the Herat and Panjsher fault zones detach it from the Hindu Kush Block; to the northeast, the Sarobi fault zone acts as the border with the Nuristan Block, while in the southeast, it is separated by the Gardiz fault, a splay of Chaman fault zone from Katawaz basin () (Wheeler et al. Citation2005; Ahmadi and Uygucgil Citation2021). The Chaman Fault Zone (CFZ) is a well-recognized left-lateral strike-slip with displacement ranging from 50 m to 10 km, regional drag folds, and releasing stepover structures. The continental right-lateral Herat Fault Zone (HFZ) to the north and northwest of the Kabul Block controls the development of an escape wedge accommodated by the Charikar normal fault between HFZ and CFZ. The eastern margin of the Kabul Block, bounded by the Sarobi Fault Zone (SFZ), positioned between two left-lateral strike fault zones of Chaman and Konar, is influenced by the restraining stepover structure (Ahmadi et al. Citation2022).
Figure 1. Simplified neotectonics and geologic settings of the Kabul Block and surroundings; A) the orogenic segments and structural settings of Afghanistan and Kabul Block modified after (Wheeler et al. Citation2005; Abdullah et al. Citation2008; Siehl Citation2017), B) The simplified geological map of the Kabul Block adapted after (Abdullah et al. Citation2008; Ahmadi and Uygucgil Citation2021), with major faults indicated by red lines from (Ruleman et al. Citation2007; Abdullah et al. Citation2008). fault segments represented by black lines have been adapted from (Ahmadi et al. Citation2022).
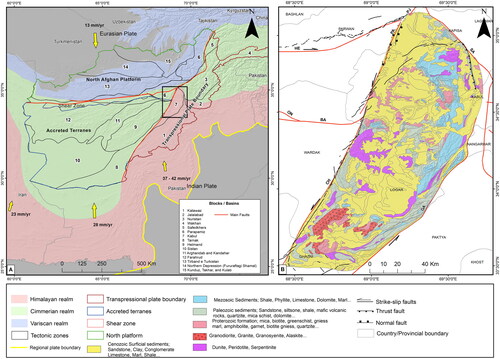
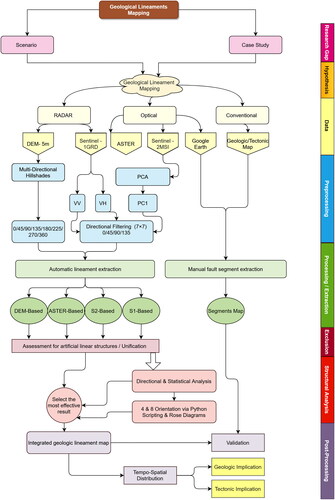
Figure 2. Flowchart showing the entire procedure of the methodology.
The Precambrian rocks constitute the basement of Kabul Block, which are exposed in the hills around Kabul city and are classified into two (Bohannon Citation2010), three (Abdullah et al. Citation2008), or four (Karapetov et al. Citation1981) formations (Khair Khana, Sherdarwaza, Kharog, and Welayati) (). The Archean age granulite facies in the Khair Khana hills, northwest of Kabul city, are attributed to the Khair Khana formation (Faryad et al. Citation2016). The Sherdarwaza formation is composed of gneiss and migmatite with minor marble, amphibolite, and quartzite (Abdullah et al. Citation2008). The formation is distributed over a vast area in the hills bounding Kabul city, in the Koh-i-Safe Mountains to the northeast, and in the south of the block (Faryad et al. Citation2013). The Kharog formation consists of metaquartzite, schist, gneiss, amphibolite, and marble that occur over the Kharog Mountains, south of Kabul, and overlies the Sherdarwaza formation (Abdullah et al. Citation2008; Faryad et al. Citation2016). The Welayati formation, which is exposed to the south and northeast of Kabul, consists of schist and amphibolite of the Neoproterozoic age () (Abdullah et al. Citation2008; Faryad et al. Citation2016). The Vendian – Cambrian sequence corps out in the south of Kabul and separated into Loy Khwar and Gulkhamid formations unconformably overlying Welayati formations. The Loy Khwar formation hosts the copper mineralization in the Aynak copper mine and is composed of dolomite marble, carbonaceous quartz-schist, quartzite, conglomerate, meta-sandstone, and tuffs (Bohannon Citation2010; Ahmadi and Uygucgil Citation2021). According to Abdullah et al. (Citation2008), the Carboniferous – Permian sequence distribution in the south of Kabul Block is composed of low-grade phyllite and slate, lenses of limestone, dolomite, sandstone, conglomerate, and minor volcanics (). The Permian-Jurassic formations are attributed to Khengil Series, consist of carbonate rocks occurring on the eastern margin of the Kabul Block (Abdullah et al. Citation2008; Faryad et al. Citation2016). The covering sequences (Neogene – Holocene) are characterized by the fine-grained sediments and conglomerate, separated into the Lataband Series, which is distributed throughout the Kabul Block, particularly in the basins (Bohannon Citation2010) (). The intrusive masses are reported in limited sections of the Kabul Block, with two distinct types of igneous rocks, ultramafics and granitoid occurring over this block. The ultramafic complexes are exposed along the eastern and southwestern margins of the Kabul Block, composed of peridotite with minor dunite, harzburgite, and serpentinite (Benham et al. Citation2009; Ahmadi and Kalkan Citation2021). An Eocene-Oligocene granitoid body is reported in the south of the Kabul Block, which intrudes the Precambrian basement and Carboniferous-Permian meta-sediments (Abdullah et al. Citation2008) ().
Materials and methods
The methodology deployed in this study is divided into three phases: preprocessing, processing/extraction, and post-processing. The required data are provided, enhanced, and subjected to the processing/extraction step in the preprocessing stage. The selected parameters and initial operations are defined in the second step, and the results are forwarded to the post-processing step for verification and further analysis. The entire procedure of methodology is illustrated in . Google Earth Engine (GEE) cloud computing platform was employed to acquire and download remote sensing datasets. ENVI 5.3, PCI Geomatic 2016, and Global Mapper Pro were used for enhancement, filtering, and automatic lineament extraction and analysis, while IMB SPSS Statistics 22 and ArcGIS Desktop 10.7.1 were utilized for structural analysis, descriptive statistics, tempo-spatial interpretation, and visualizations. Moreover, the obtained results were compared with the manually determined fault segments carried out by Ahmadi et al. (Citation2022). Lastly, Google Earth Pro and Esri base map imageries were used for verifications.
Datasets
Since manual extraction and detection of geological lineaments is more subjective than automatic extraction due to requiring more time, experienced analysts, however, automatic lineament extraction is also challenging because most of the time they can be confused with the artifacts due to vegetation coverage, built-up distribution, and other environmental factors. Therefore, in this study, hybrid data, including radar and optical sensors, were used to tackle this challenge. DEM-5m and Sentinel-1 GRD (Ground Rang Detection) were examined as a part of radar data. At the same time, Sentinel − 2 MSI (Multispectral Instrument) and ASTER (Advanced Spaceborne Thermal Emission and Reflection Radiometer) were tested in the case of optical data.
A Digital Elevation Model (DEM) with 5 m spatial resolution was generated on 3 August 2008 using an Intermap STAR-3i airborne interferometric SAR system mounted on a LearJet 35 A aircraft. The data was provided by the Ministry of Mines and Petroleum of Afghanistan. The Sentinel-1B SAR GRD was launched on 3 April 2014, and provides data from a dual-polarization C-band Synthetic Aperture Radar (SAR) instrument at 5.405 GHz. The S1 collection includes GRD scenes, each with spatial resolutions of 10, 25, or 40 meters. For this study, the date interval between 20–30 July 2021 was selected, and band C with two polarization (VV and VH) was directly loaded from GEE. Time gaps between the datasets have not affect to the results because the geological structures being studied are unlikely to be significantly affected by changes occurring over the span of several years. However, it is worth noting that any artifacts present in the study area may be more sensitive to such changes. While these artifacts are not the focus of the study, they may still be impacted and therefore should be taken into consideration when interpreting the results. During the extraction of lineaments, an important step in the study, measures were taken to remove any artifacts that could potentially interfere with the accuracy of the data. This validation and checking process was crucial in ensuring that the extracted lineaments were representative of the underlying geological structures, and not influenced by extraneous factors. By removing any artifacts, the researchers were able to improve the validity and reliability of the results, ultimately leading to a more robust and accurate analysis. The ASTER sensor provides multispectral imagery launched on the Terra platform of the NASA Earth Observing System (EOS) on December 18, 1999. It contains 14 spectral bands in the VNIR, SWIR, and TIR ranges with spatial resolutions of 15, 30, and 90 meters (Ahmadi and Kalkan Citation2021; Mashkoor et al. Citation2022). In the present study, using GEE, 9 bands (VNIR & SWIR) of ASTER data were downloaded between the dates 01.07.2007 and 20.07.2007.
Sentinel-2A MSI was launched on 23 June 2015, carrying a multispectral sensor to capture the objects by 13 spectral bands ranging from visible light to SWIR, having 10, 20, and 60 meters spatial resolutions (Mashkoor et al. Citation2022; Xu et al. Citation2022). Only 6 bands (Edge – SWIR) of S2 between the date interval 24.07.2021–30.07.2021 were used in this study.
Data processing and geological lineament extraction
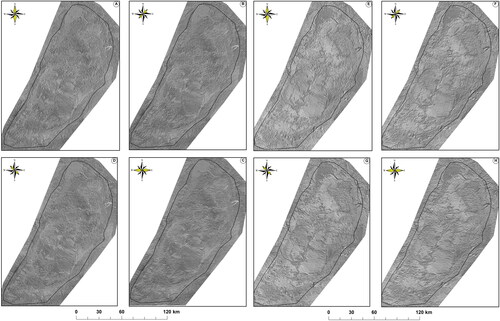
As illustrated in , all the data were subjected to spatial and spectral filtering to enhance and significantly visualize the expressed geomorphology. The high spatial resolution DEM data was spatially filtered and generated shaded relief images. Using azimuthal directions across numerous orientations, shaded relief images were generated in 8 directions, including 0°, 45°, 90°, 135°, 180°, 225°, 270°, and 315 (). The benefits of these azimuthal directions were to effectively extract lineaments across 360°. The unification process was carried out to create a single lineament map by integrating all eight directions. In this process, the geoprocessing tools of merge and intersect in the ArcMap environment were used. Further, an exclusion process was performed to remove artificial lineaments. Removing artifacts posed a particular challenge due to its time-consuming nature. However, recognizing the significance of obtaining precise and reliable outcomes, the authors dedicated substantial efforts to address this issue appropriately. They employed meticulous techniques and procedures to discern between natural lineaments and potential artifacts, taking into account various factors such as scale, context, and visual consistency. In cases where artifacts were identified, they were carefully excluded from the final analysis, ensuring that only authentic lineaments were considered. Overall, this methodological approach employed a rigorous and thorough process of comparing the extracted lineaments with high-resolution imagery and base maps in ArcMap. Through diligent verification and the careful removal of artifacts, the researchers strived to enhance the accuracy and credibility of the final results. The Ground Range Detected (GRD) Sentinel–1 SAR was downloaded using GEE, which was already preprocessed by following the steps such as apply orbit file, RGD border noise removal, thermal noise removal, radiometric calibration, and terrain correction. The downloaded Sentinel-1 data was underwent Prewitt filtering, which is considered one of the Nonlinear Edge Detection Filtering (Ahmadi and Pekkan Citation2021). We applied a 7 × 7 Prewitt filter to four directions, namely N-S, NE-SW, E-W, and NW-SE, to detect more direction-edged features representing geological lineaments (). The multispectral bands of Sentinel–2 MSI and ASTER data were enhanced using two stages: the first stage involved applying the Principle Component Analysis (PCA), and the second stage involved applying directional filtering. PCA is the common multivariate statistical technique used to reduce the data dimensionality by generating an uncorrelated image with higher contrast than the original image (Ahmadi and Pekkan Citation2021; Ahmadi and Uygucgil Citation2021). The first three generated PC images have the highest variation; therefore, we selected PC1 and subjected it to directional filtering. A 7 × 7 directional filtering was applied in four directions, e (N-S, NE-SW, E-W, and NW-SE), onto PC1 of Sentinel-2MSI and ASTER data (). Four sets of lineaments dissolved to create a final map of lineament for this data. During the automatic lineament extraction process, some artificial linear structures over the built-up areas were confused with naturally occurring linear features. An extensive manual lineament verification was conducted to exclude these confused lineaments.
Figure 3. Generated shaded relief images from DEM-5m after the azimuthal filter into eight directions: A) 00°, B) 45°, C) 90°, D) 135°, E) 180°, F) 225°, G) 270°, and H) 315°.
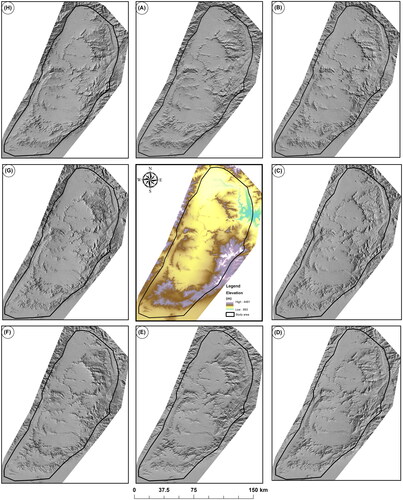
Figure 4. Sentinel-1B GRD with VV polarization after Prewitt filter in four directions A) 00° (N-S), B) 45° (NE-SW), C) 90° (E-W), and D) 135° (NW-SE), Sentinel 1B GRD with VH polarization after Prewitt filter into four directions A) 00° (N-S), B) 45° (NE-SW), C) 90° (E-W), and D) 135° (NW-SE).
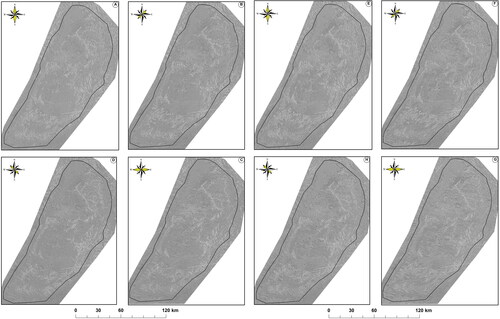
Figure 5. PC1 of Sentinel-2A MSI data after directional filtering into four directions A) 00° (N-S), B) 45° (NE-SW), C) 90° (E-W), and D) 135° (NW-SE), PC1 of ASTER data after directional filtering into four directions A) 00° (N-S), B) 45° (NE-SW), C) 90° (E-W), and D) 135° (NW-SE).
Two main stages are involved in automatic lineament extraction; The first stage is edges detection, followed by the sudden changes of the values around the neighboring pixels, while the second stage is line/curve detection (Javhar et al. Citation2019; Ahmadi and Pekkan Citation2021). In this study, the LINE module of PCI Geomatica was used that operates based on the Segment Tracing Algorithm (STA) and Canny algorithm. In this module, six parameters that should be considered before running the algorithms are categorized into two groups: edge detection and line/curve detection. RADI (filter radius) is measured in pixels (3-8), and GTHR (Edge Gradient Threshold) is measured between (10-70), which are the diagnostic parameters of this first category. The second category includes LTHR (Curve Length Threshold) in pixel (10), FTHR (Line Fitting Threshold) in pixel (2-5), ATHR (Angular Difference Threshold) in angle (3-20), and DTHR (Linking Distance Threshold) in pixel (10-45). Due to the large extent of the study area, it is not possible to effectively visualize all the entire detected lineaments a single map. Therefore, the study area was divided into four clockwise zones, and the extracted lineaments were described in each zone based on the selected dataset. The extracted lineaments were checked for their accuracy, and a major manual exclusion was carried out to target only naturally occurring geological-based lineaments. Finally, the most effective extracted lineaments were selected and forwarded to further analysis, such as temporal evolution and other spatial analysis.
Results
Shaded relief images generated from DEM-5m
The lineaments were extracted from eight directions of multi-illumination hill-shade images of DEM-5m. The initial lineament extraction process from the eight sets of azimuth directions showed that both frequency and azimuth direction statistics of the lineaments achieved by the multi-illumination hill-shade images follow the same pattern. As descriptive statistics shown in , a total of 414,069 geological-based lineaments ranging from 10 to 948.31 m were extracted from DEM-5m across the Kabul Block. The majority of primary lineaments trend NW-SE and WNW-ESE, while in the secondary group, lineaments are distributed NE-SW and ENE-WSW (see ). The linear features extracted exhibit a tendency towards regions of high rugged topography and complex geological settings. Due to the large size of the study area, the results are presented in four separate zones (see , and ).
Figure 6. Orientation trends of the extracted lineaments from radar (DEM and Sentinel-1B GRD) and optical data (Sentinel-2A MSI and ASTER) into eight and four directions in the entire Kabul Block.
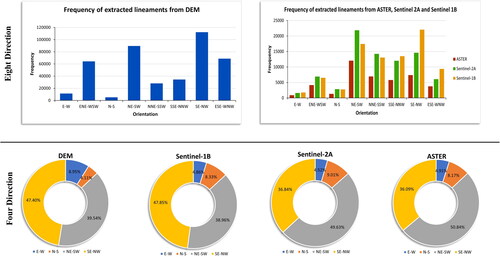
Figure 7. Distribution of lineaments and their orientation pattern in Zone-I extracted from radar data; a) DEM-5m and b) Sentinel-1B GRD.
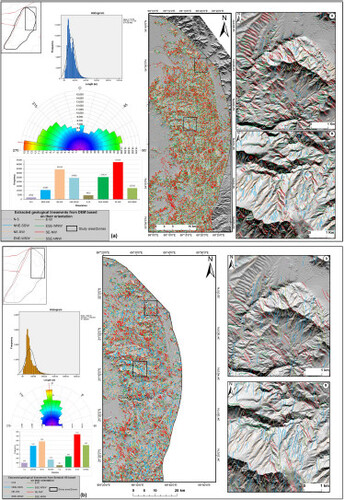
Figure 8. Extracted lineaments superimposed on shaded relief image in Zone-1 of Kabul Block with their spatial pattern based on optical data a) Sentinel-2A MSI and b) ASTER.
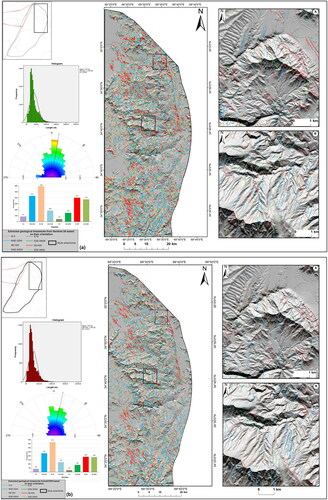
Table 1. The brief statistics of the extracted geological-based lineaments from radar and optical data over the entire Kabul Block.
Filtered VV and VH of Sentinel-1 GRD
The analysis of the filtered Sentinel-1B GRD with two polarizations, HH and VH, provided two sets of lineaments, which were then processed to select a single map due to high duplicity and similar orientation patterns. After assessing of extracted lineaments, a total of 86,438 geological-based linear features were extracted, ranging from 16.2 − 2469.92 m over the entire Kabul Block (). In comparison with the results from DEM-5m, a smaller number of lineaments were extracted from Sentinel-1GRD due to its lower spatial resolution. Although the patterns of lineaments appear to be the same, the sizes differ (). The rose diagram analysis of the extracted lineaments shows that the primary lineament is trending NW-SW and NNW-SSE, respectively, while the NE-SW and NNW-SSW orientations are considered as secondary trending of the extracted lineaments, which are also observed in all selected zones (, and and ). Similarly, to the final map of DEM-derived lineaments, the Sentinel-1GRD-generated lineaments are distributed throughout the rugged topographical areas. The entire area is divided into four zones, which will be discussed further.
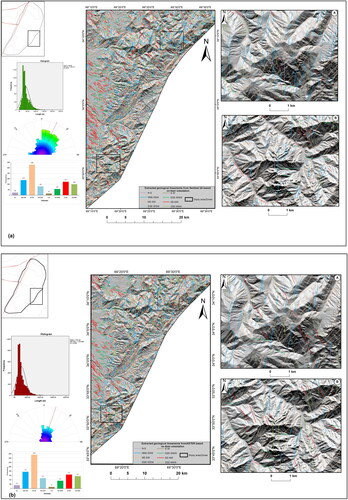
Figure 9. Distribution of the extracted lineaments within the Zone-II of Kabul Block from; a) DEM-5m and b) Sentinel-1B GRD.
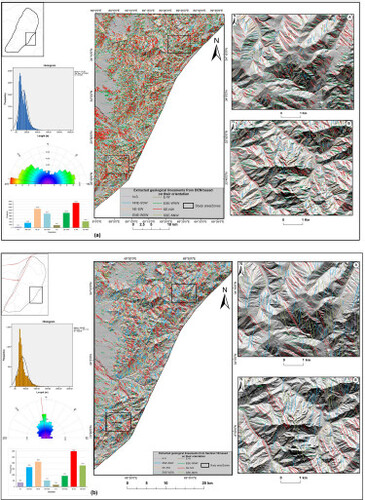
Figure 10. Distribution of the extracted lineaments within the Zone-II of Kabul Block from; a) Sentinel-2A MSI and b) ASTER.
Directional filtered PCA-based bands of Sentinel-2MSI
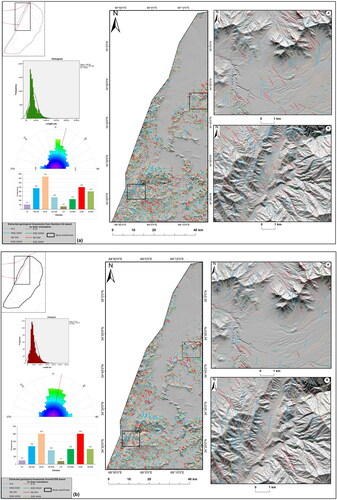
Four sets of lineaments were also created from the filtered Sentinel-2MSI. These sets were N-S, NE-SW, E-W, and NW-SE, and were merged into a single lineament map using the same approach. As shown in , a total of 80,243 lineaments varying in length between 40 − 2436.47 m were extracted from this data. Based on the descriptive statistics and structural analysis of the extracted lineaments, NE-SW and NNE-SSW oriented lineaments predominate as the primary distribution, while NW-SW and NNW-SSE trending lineaments are observed as the secondary distribution. Like other data-derived lineaments, E-W and N-S trending linear features are considered the least-distributed extracted lineaments from Sentinel-2MSI (, and ).
Figure 11. Distribution of extracted lineaments superimposed on hill-shade images within Zone-III and their associated magnified areas from a) DEM-5m and b) Sentinel-1B GRD.
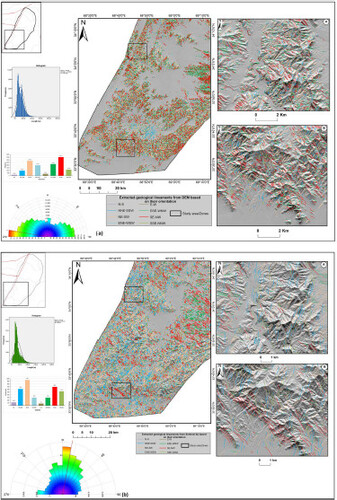
Figure 12. Distribution of extracted lineaments superimposed on hill-shade images within Zone-III and their associated magnified areas from: a) Sentinel-2A MSI and b) ASTER.
Directional filtered PCA-based bands of ASTER
A total of 42,443 lineaments with a length of between 0.46–3722.17 m were extracted, showing the lowest number of lineaments extracted from DEM-5m, Sentinel-1GRD, and Sentinel-2MSI (). As illustrated in , and , the primary predominant lineaments trend NE-SW and NNE-SSW, while the secondary predominant lineaments are distributed with NW-SE and NNW-SSE orientation. The overall patterns of oriented lineaments from ASTER data are almost the same as other radar and optical data; however, a significant difference is observed in lineament numbers and lengths.
Zone-I
Zone-I covers the northeast margin of the Kabul Block and is characterized by the Sarobi fault zone, as well as various igneous, metamorphic, and sedimentary rocks. A summary of the general statistic of the extracted lineaments for this zone is presented in . Radar data (DEM-5m and sentinel-1B GRD) extracted a higher number of lineaments for this zone compared to optical data (Sentinel-2A MSI and ASTER) ( and ). The primary orientation of extracted lineaments from radar data is NW-SE, while the secondary orientation is considered to be NE-SW (). For optical data, the primary dominant extracted lineaments trend NE-SW, and the secondary dominant lineaments are in NW-SE directions. Positive and negative topologies are revealed in the magnified regions, indicating the sequence of lineaments ( and ). Negative lineaments mostly represent valleys, trenches, fractures, and joints, while positive lineaments represent elevated topography or ridges. The extracted lineaments from both types of data are concentrated northeast, center, and south of the zone, which are characterized by tectonic deformation and a high rate of changes in topography. Flat areas, including artificial structures and wide valleys in the northwest, east, and west of Zone-I, have significantly fewer or no lineaments ( and ). This regularity confirms the reliability of the extracted lineaments.
Table 2. Summary of the descriptive statistics of the detected lineaments over the zones I-II-III-IV from radar and optic data.
Zone-II
Zone-II is located in the southern part of the Kabul Block and covers the NE-SW trending edge. The zone is surrounded by the Gardiz fault, which is NE-SW splay of the Chaman Fault Zone to the east. As shown in and and , there is a significant difference in the number of lineaments detected by radar and optical data. In Zone-II, 59,498 and 10,510 lineaments were extracted from DEM-5m and Sentinel-1GRD, respectively, while these numbers decreased to 8,151 and 4,594 from Sentinel-2MSI and ASTER data ( and ). Consequently, the number of extracted lineaments is inversely proportional to their length. The average length of the lineaments from DEM-5m is 132.02 m, while the average length of the lineaments extracted from ASTER data is 532.43 m.
Zone-III
This zone mainly covers the southern and southwestern extensions of the Kabul Block. It is limited by the Chaman Fault Zone to the west and Gardiz Fault to the east. Based on the structural analysis and descriptive statistics of the detected lineaments, 13,1782 lineaments with an average length of 119.27 m were detected from DEM-5m, 30,614 lineaments with an average length of 290.99 m were detected from Sentinel-1GRD, 35,807 lineaments with an average length of 316.23 m were detected from Sentinel-2A MSI, and 17,812 lineaments with the average length of 519.86 m were detected from ASTER data (). As illustrated in and , the mean length of lineaments decreases with the increase in the number of lineaments. The frequency distribution revealed that a higher number of detected lineaments are seen within the length of <200 m for DEM-5m and <400 m for Sentinel 1B GRD and Sentinel-2A MSI. The results from DEM-5m data could effectively reflect the topographical situation of Zone-III over the eastern, southern, and northwestern parts, where the areas are more deformed, and more lineaments were detected.
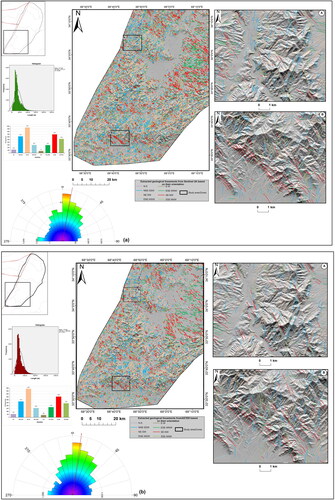
Zone-IV
This zone covers the northwest edge of the northern Kabul Block and is surrounded by the northern extension of the Chaman Fault Zone. In addition to its high rough topography, the region is characterized by a plain called (the Shomali Plain) and urban sites. Moreover, extensive vegetation coverage is available in the northwest corner of the zone, which might make the task of lineament detection using optic data complex. Considering the summary of extracted lineaments presented in , the highest number of lineaments with the smallest length were also extracted in this zone by DEM-5m, while the lowest number with the largest length is associated with ASTER data ( and ). The trending pattern of detected lineaments by radar and optical data is similar to other zones, with primary NW-SE, WNW-ESE, and NNW-SSE trending () and secondary NE-SW, ENE-WSW, and NNE-SSW trending for radar and vise verse are for optical data (). Most extracted lineaments are distributed within eastern, southern, and southwestern parts where igneous complexes occur.
Figure 13. Superimposition of the detected lineaments with their spatial patterns on a shaded relief map over the Zone-IV generated from: a) DEM-5m and b) Sentinel-1B GRD.
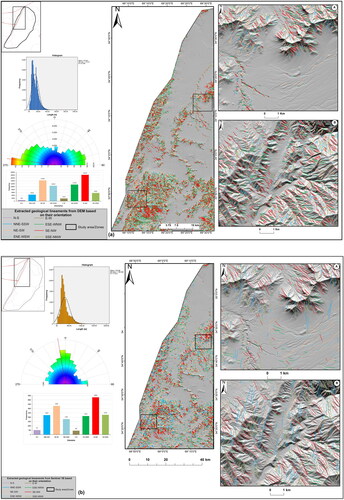
Figure 14. Spatial pattern and distribution of detected lineaments overlayed on hill-shade images from: a) Sentinel-2A MSI and b) ASTER.
Discussions
Automatic lineament detection using radar and optical data is an effective method for identifying naturally occurring lineaments that express geological features across the entire Kabul Block. However, as noted in a review study by Ahmadi and Pekkan (Citation2021), a single approach for the extraction of lineaments expressing geological structures might not be effective, and a hybrid method that combines automatic and manual approaches is often suggested.
The detection of accurate geological lineaments is a challenging task that requires a robust extraction approach and skilled experts, as highlighted in relevant literature, such as (Ghosh et al. Citation2021; Abdelouhed et al. Citation2022; Tende et al. Citation2022).
The current study introduces innovative methodologies for extracting geological lineaments that align with the geology and tectonics of the study area. Previous literature has utilized a combination of optical and radar data to extract lineaments, but often relied on a single method or algorithm. In contrast, our methodology encompasses a broad spectrum of geological lineaments and incorporates structural analysis.
To ensure robustness, we employed an automatic extraction algorithm complemented by a comprehensive visual inspection to obtain optimal results. Subsequently, the obtained outcomes were compared against active fault lines, geological and tectonic maps, regional reality, and the shear tectonic model. Furthermore, we conducted a detailed examination of the temporal evolution and spatial distribution of the identified lineaments.
This comprehensive approach allowed us to delve into the geological lineament structures in greater detail, providing insights into their implications within the geological and tectonic context. Our study addresses certain gaps in prior research, which did not extensively analyze these aspects.
The outputs of this study are considered the first comprehensive investigation of lineament distribution, their pattern configuration, and temporal evolution within the Kabul Block. Previous studies, such as Hubbard et al. (2012), Saibi et al. (Citation2016), and Rustami et al. (Citation2017), have extracted lineaments in other regions of Afghanistan using limited methods and validations.
Even though, still further research could expand upon the findings of this study by utilizing a wider range of data sources and incorporating additional validation techniques. Additionally, incorporating machine learning algorithms and other artificial intelligence techniques may enhance the accuracy and efficiency of lineament detection. The extracted lineaments vary in terms of numbers, lengths, and orientations. While similarities in orientation can be observed across the entire datasets, differences are noted in the numbers and lengths of the lineaments. Due to its higher spatial resolution, the radar datasets, particularly DEM-5m, were able to effectively detect a higher number of lineaments with smaller lengths compared to the optical data. Primary lineaments trending in the NW-SE, WNW-ESE, and NNW-SSE directions, as well as secondary lineaments trending in the NE-SW and ENE-WSW directions, were detected by DEM-5m and Sentinel-1B GRD. In contrast, the orientation of primary lineaments was replaced by secondary lineaments in the case of Sentinel-2A MSI and ASTER datasets. The orientation of extracted geological lineaments particularly along the active fault zones (Chaman, Sarobi, and Gardiz) are consistent with the trending of main fault lines reported by (Wheeler et al. Citation2005; Abdullah et al. Citation2008; Shnizai Citation2020; Ahmadi et al. Citation2022).
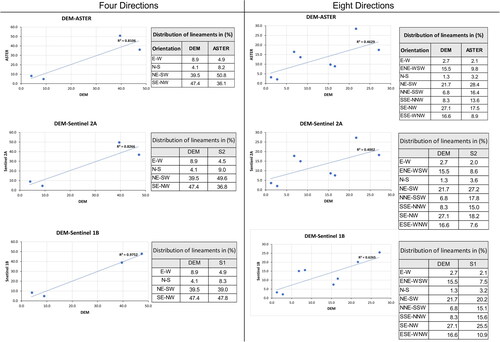
Correlation analysis of the detected lineaments’ orientation pattern for four and eight directions was conducted to understand the interrelationship of radar and optical data effectively. Based on the analysis, in terms of four directions, the highest correlation is observed between the results of DEM-5m and Sentinel-1B GRD with a linear regression value of (R2 = 0.9752). A moderate correlation is suggested between DEM-5m and Sentinel-2A MSI (R2 = 0.8266), while the lowest correlation is found between DEM-5m and ASTER data (R2 = 0.8106) (). In the case of eight directions, where DEM-5m and Sentinel-1B GRD are highly correlated (R2 = 0.6265), DEM-5m and ASTER are moderately correlated (R2 = 0.4629), while low correlation is observed between DEM-5m and Sentinel-2A MSI (R2 = 0.4002) (). The analysis was done based on the percentage of the trending of lineament. The linear regression value for the eight directions is lower than the four directions because the minor division of directions is considered a part of the major divisions.
Figure 15. Linear regression plot for the correlation analysis of the detected lineaments from radar (DEM-5m and Sentinel-1B GRD) and optical (Sentinel-2A MSI and ASTER) data.
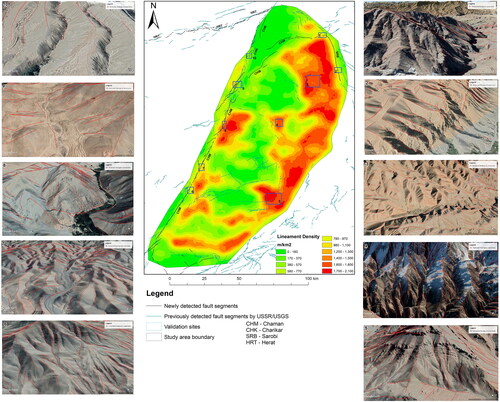
Considering the effective results obtained from radar data, DEM-5m was selected for the further analysis of densities, temporal evolution and spatial distribution, while Sentinel-1B GRD was deployed for geologic and tectonics implications. For validation purposes, a lineament density analysis was conducted for the entire Kabul Block to show the spatial concentration of lineaments per unit area. A classification map of lineament density was prepared in GIS environment for better understanding and visualization (). As observed, most of the concentrated extracted lineaments (High density) are located within northeastern and eastern areas (Zone – I &II). Ten randomly selected areas from high and moderate densities were chosen to check for verification using 3D high-spatial resolution images of Google Earth Pro. As illustrated in , the detected lineaments are placed over the ridges, valleys, edges of lithological units, or stream channels, confirming the correct differentiation of lineament in the area. Given the geological map of the Kabul Block and provided density map, high-density values are observed in igneous formations. Moreover, the gradient colors between the high, moderate, and low densities reveal the lithological boundaries and active fault zone.
Figure 16. Thematic map showing the spatial density of lineaments superimposed by active fault segments: black fault lines from (Ahmadi et al. Citation2022), and light Blue fault lines are from (Wheeler et al. Citation2005; Abdullah et al. Citation2008).
Geologic and neotectonic implications
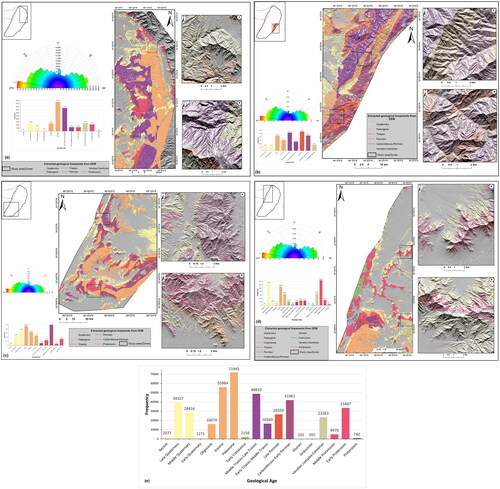
The temporal evolution and spatial distribution of lineaments was presented in four distinct zones due to the large dimensionality of the study area. As shown in , four major clustered ages of lineaments, i.e. Proterozoic, Paleozoic, Mesozoic, and Cenozoic, and ten minor clustered ages, i.e. Proterozoic, Vendian-Cambrian, Ordovician, Silurian, Carboniferous, Permian, Triassic, Cretaceous, Paleogene, and Quaternary were recognized. Based on the frequency of the extracted lineaments in Zone-I, the prominent lineaments trend in Paleogene formations over the eastern and southern regions, and fewer lineaments are seen in Proterozoic formations in the central and east regions (). In Zone-II, most of the lineaments are observed on Paleogene and Triassic formations in the eastern, south-eastern, and southern parts. In contrast, fewer attributed to the lineaments are attributed to the Vendian-Cambrian formations in northwestern regions (). This temporal evolution pattern is also observed within Zone-III, where the prominent distribution of the lineaments is observed in Paleogene and Quaternary formations in the central and southern regions, with fewer attributed to the Proterozoic formation (). Various lithological units occur in Zone-IV, and more Proterozoic formations are distributed in this zone. Therefore, Cenozoic and Proterozoic aged lineaments are considered in the southwestern, southern, and southeastern parts (). Based on the overall temporal and spatial analysis over the entire Kabul Block, the abundant number of extracted lineaments are well documented in Cenozoic (Paleogene and Quaternary) formations, while moderate to a low number of lineaments are represented in Proterozoic (early and middle Proterozoic, Vendian – Cambrian), Paleozoic (Ordovician, Carboniferous, and Permian), and Mesozoic (Triassic and Cretaceous) formations ().
Figure 17. Thematic maps showing the tempo-spatial analysis of the lineament trends over the Kabul Block; a) Zone-I, b) Zone-II, c) Zone-III, d) Zone-IV, and e) overall statistics.
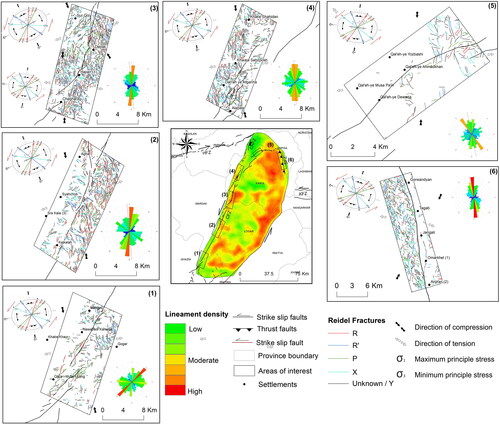
The stress field approximation based on the spatial pattern of the extracted lineaments was also carried out using the left and right-lateral Riedel shear tectonic model adapted by Wilcox et al. (Citation1973) []. In this model, the geometrical relationship of the major left-lateral fault zones with the lineaments was interpreted in six areas of interest by considering the fractures, e.g. Synthetic Fractures (R), Antithetic Fractures (Rˈ), Secondary Synthetic Fractures (P), and Secondary Antithetic Fractures (X). Considering the NE-SW trending of the main fault e.g. Chaman Fault Zone, the abundant system of the lineaments trending NNE-SSW in all selected areas can be interpreted as R-shear fractures; lineaments trending ∼ NNW-SSE can be interpreted as right-lateral Rˈ-fractures, and ENE-WSW and WNW-ESE trending lineaments can be interpreted as X and P – fractures respectively (see ). Moreover, the present-day stress tensor is characterized by the principle compressive axis (σ1) trending NNW-SSE in the western and southwestern Kabul Block and NE-SW in the northern regions of the Kabul Block (). The extensional stress (σ3) is dominant in the ENE-WSE direction in the western and southwestern regions and NW-SE in northern regions of the block (). In fact, both sides of the Kabul Block are influenced by left-lateral strike faults; the main Chaman Fault zone controls the western edge, while the eastern edge particularly northeastern along the Sarobi Fault Zone, is in a zone of stepover between two left-lateral fault zone of Chaman and Konar (Ahmadi et al. Citation2022). Therefore, the large-scale stress distribution forming Chaman, and Konar fault zone is slightly rotated in this region. As illustrated in , the Reidel shear model also confirms this condition by the consistency of X and Rˈ with the strike of the Sarobi Fault Zone and R and P with the main left-lateral fault zones.
Figure 18. Interpretation of strain ellipse and Riedel shear mechanism model in the western, southwestern, northern, and south-eastern regions of the Kabul Block; R, synthetic Riedel shears; R', antithetic Riedel shears; P, secondary synthetic Riedel shears; X, secondary antithetic Riedel shears.
Conclusions
This study presents the outcomes of an automated methodology developed for the detection of linear features, primarily focusing on geological lineaments. By employing a combination of spatial and spectral filters and algorithms, optical and radar data were processed. Specifically, Sentinel-2A MSI and ASTER imageries were utilized as sources of optical data, while DEM-5m and Sentinel-1B GRD were employed for radar data analysis.
The implemented approach enabled the extraction of geological lineaments through automated procedures. Subsequently, thorough examinations of their densities and structural patterns were conducted, leading to a deeper understanding of their geologic and tectonic implications within the Kabul Block.
The utilization of diverse data sources and advanced analysis techniques in this research contributes significantly to the academic domain. It enhances our knowledge of the geological characteristics of the study area and provides valuable insights into the underlying tectonic processes that shape the region. In this study, efforts were carried out solely to verify geological lineaments, including an exclusion process that resulted in the removal of artificial lineaments, comparison of results with previous tectonic/geologic maps, and manual detection of segments of active fault zones that made it possible to interpret the tectonic condition of these lineaments.
The distinction between naturally occurring geological lineaments and artifacts poses a considerable challenge, particularly when relying solely on optical data. However, our study revealed that radar data yielded more objective results in this regard. In order to overcome the challenges associated with artifact lineaments and accurately identify linear surface features, we employed a comprehensive approach that involved examining illumination from eight directions on hill-shaded images derived from DEM-5m. This meticulous analysis allowed us to address the complexities associated with differentiating between natural geological lineaments and artifacts, thus enhancing the reliability and robustness of our findings.
The analysis of radar data in this study demonstrates a strong alignment and distribution of the extracted lineaments with active fault lines and segments. This observation provides compelling evidence for the effectiveness and reliability of the methodology employed. The consistent concurrence between the identified lineaments and the known active fault lines reinforces the robustness of our approach and validates its capability in accurately capturing the geological features of the study area. In this study, we conducted lineament detection using various datasets. Specifically, from DEM-5m and Sentinel-1B GRD data, a total of 41,4069 lineaments were detected, with lengths ranging from 10 to 948.31 m and 86,438 lineaments ranging from 16.62 to 2469.91 m, respectively. Additionally, utilizing Sentinel-2A MSI and ASTER data, we identified 80,243 lineaments ranging from 40 to 2436.47 m and 42,443 lineaments ranging from 0.46 to 3722.17 m, respectively. The comprehensive analysis of these datasets allowed for a detailed characterization of the lineament population within the study area, encompassing a wide range of lengths and providing valuable insights into the geological features present.
The extracted lineament from DEM-5m showed a prominent NW-SE and NE-SW trend, which is consistent with the results obtained from Sentinel-1B GRD and optical data. Conversely, fewer lineaments exhibited a trend in the N-S and E-W directions. Our analysis of temporal evolution and spatial distribution of the extracted lineaments from DEM-5m revealed that abundant lineaments were formed on young sediments and formations of the Paleogene and Quaternary ages. In contrast, fewer numbers were observed on Proterozoic, Paleozoic, and Mesozoic formations. Furthermore, the high density of lineaments in the eastern and southeastern regions of the Kabul Block suggests that these areas are influenced by active regional structures and local active fault zones. Analysis of the Riedel Shear tectonic model of lineaments revealed that the maximum compressive stress in the western regions of the Kabul Block trend in NNW-SSE direction. However, in the northern regions and south-eastern regions, the trend shifts to NE-SW. The regions with high and moderate lineament density are recommended for further studies on neotectonics, as well as for prospecting of hydrothermal alteration and mineralization zones.
Acknowledgement
This work was made within the scope of the Ph.D. thesis of the first author (Hemayatullah AHMADI).
Disclosure statement
No potential conflict of interest was reported by the authors.
References
- Abdelkader MA, Watanabe Y, Shebl A, El-Dokouny HA, Dawoud M, Csámer Á. 2022. Effective delineation of rare metal-bearing granites from remote sensing data using machine learning methods: a case study from the Umm Naggat Area, Central Eastern Desert, Egypt. Ore Geol Rev. 150:105184. doi:10.1016/j.oregeorev.2022.105184.
- Abdelouhed F, Ahmed A, Abdellah A, Mohammed I, Mourabit Z. 2021. Contribution of gis and remote sensing in geological mapping, lineament extractions and hydrothermal alteration minerals mapping using aster satellite images: case study of central jebilets-morocco. Disaster Adv. 14(1):15–25.
- Abdelouhed F, Ahmed A, Abdellah A, Mohammed I, Zouhair O. 2022. Extraction and analysis of geological lineaments by combining ASTER-GDEM and Landsat 8 image data in the central high atlas of Morocco. Nat Hazards. 111(2):1907–1929. doi:10.1007/s11069-021-05122-9.
- Abdullah SH, Chmyriov VM, Dronov VI. 2008. Geology and mineral resources of Afghanistan. Vol. 1 & 2. British Geological Survey Occasional Publication
- Adiri Z, El Harti A, Jellouli A, Lhissou R, Maacha L, Azmi M, Zouhair M, Bachaoui EM. 2017. Comparison of Landsat-8, ASTER and Sentinel 1 satellite remote sensing data in automatic lineaments extraction: a case study of Sidi Flah-Bouskour inlier, Moroccan Anti Atlas. Adv Sp Res. 60(11):2355–2367. doi:10.1016/j.asr.2017.09.006.
- Ahmadi H, Kalkan K. 2021. Mapping of ophiolitic complex in logar and surrounding areas (SE Afghanistan) with ASTER data. J Indian Soc Remote Sens. 49(6):1271–1284. doi:10.1007/s12524-021-01319-4.
- Ahmadi H, Kaya O, Babadagi E, Savas T, Pekkan E. 2021. GIS – based groundwater potentiality mapping using AHP and FR models in central Antalya, Turkey. Environ Sci Proc. 5(1):11.
- Ahmadi H, Pekkan E, Seyitoğlu G. 2022. Neotectonics of Kabul block (SE Afghanistan) and surroundings: a new approach based on remote sensing data. Under review.
- Ahmadi H, Pekkan E. 2021. Fault-based geological lineaments extraction using remote sensing and GIS—a review. Geosciences. 11(5):183. doi:10.3390/geosciences11050183.
- Ahmadi H, Uygucgil H. 2021. Targeting iron prospective within the Kabul Block (SE Afghanistan) via hydrothermal alteration mapping using remote sensing techniques. Arab J Geosci. 14(3):183. doi:10.1007/s12517-020-06430-3.
- Ahmed A, El Ammawy M, Hewaidy AG, Moussa B, Abdel Hafz N, El Abd ES. 2019. Mapping of lineaments for groundwater assessment in the Desert Fringes East El-Minia, Eastern Desert, Egypt. Environ Monit Assess. 191(9):1–22. doi:10.1007/s10661-019-7721-8.
- Akanji AO, Sanuade OA, Osinowo OO, Okafor O. 2020. Interpretation of high resolution aeromagnetic data for hydrocarbon exploration in Bornu Basin, Northeastern, Nigeria. Ann Geophys. 63(2):1–15.
- Akinluyi FO, Olorunfemi MO, Bayowa OG. 2018. Investigation of the influence of lineaments, lineament intersections and geology on groundwater yield in the basement complex terrain of Ondo State, Southwestern Nigeria. Appl Water Sci. 8(1):1–13. doi:10.1007/s13201-018-0686-x.
- Akram MS, Mirza K, Zeeshan M, Ali I. 2019. Correlation of tectonics with geologic lineaments interpreted from remote sensing data for Kandiah Valley, Khyber-Pakhtunkhwa, Pakistan. J Geol Soc India. 93(5):607–613. doi:10.1007/s12594-019-1224-7.
- Al-Djazouli MO, Elmorabiti K, Zoheir B, Rahimi A, Amellah O. 2019. Use of Landsat-8 OLI data for delineating fracture systems in subsoil regions: implications for groundwater prospection in the Waddai area, eastern Chad. Arab J Geosci. 12(7):1–15. doi:10.1007/s12517-019-4354-8.
- Awoyemi MO, Falade SC, Arogundade AB, Hammed OS, Ajama OD, Falade AH, Adebiyi LS, Dopamu KO, Alejolowo EA. 2022. Magnetically inferred regional heat flow and geological structures in parts of Chad Basin, Nigeria and their implications for geothermal and hydrocarbon prospects. J Pet Sci Eng. 213:110388. doi:10.1016/j.petrol.2022.110388.
- Badawi M, Abdelatif M, Shebl A, Makroum F, Shalaby A, Németh N. 2022. Mapping structurally controlled alterations sparked by hydrothermal activity in the Fatira‐Abu Zawal Area, Eastern Desert, Egypt. Acta Geol Sin 97:662–680.
- Barkah A, Daud Y. 2021. Identification of structural Geologyat the Tangkuban Parahu geothermal area, West Java based on remote sensing and gravity data. In: AIP Conference Proceedings. Vol. 2320. AIP Publishing LLC. https://aip.scitation.org/doi/abs/10.1063/5.0038809. doi:10.1063/5.0038809.
- Basu T, Pal S. 2019. RS-GIS based morphometrical and geological multi-criteria approach to the landslide susceptibility mapping in Gish River Basin, West Bengal, India. Adv Sp Res. 63(3):1253–1269. doi:10.1016/j.asr.2018.10.033.
- Benham AJ, Kováč P, Petterson MG, Rojkovic I, Styles MT, Gunn AG, Mckervey JA, Wasy A. 2009. Chromite and PGE in the logar ophiolite complex Afghanistan. Trans Institutions Min Metall Sect B Appl Earth Sci. 118(2):45–58.
- Binam Mandeng EP, Bondjè Bidjeck LM, Takodjou Wambo JD, Taku A, Bineli Betsi T, Solange Ipan A, Tchami Nfada L, Bitom Dieudonné L. 2018. Lithologic and structural mapping of the Abiete–Toko gold district in southern Cameroon, using Landsat 7 ETM+/SRTM. Comptes Rendus Geosci. 350(3):130–140. doi:10.1016/j.crte.2017.11.003.
- Bohannon RG. 2010. Geologic and topographic maps of the Kabul North 30’ × 60’ Quadrangle, Afghanistan. US Geol Surv Sci Investig Map 3120(188):34.
- Chouhan AK, Singh D, Pal SK, Choudhury P. 2022. Delineation of subsurface geological fractures in the Cambay rift and surrounding regions of NW India: an integrated approach using satellite derived EIGEN-6C4 gravity data. Geocarto Int. 37(1):268–283.
- Collett S, Faryad SW. 2015. Pressure-temperature evolution of Neoproterozoic metamorphism in the Welayati Formation (Kabul Block) Afghanistan. J Asian Earth Sci. 111:698–710.
- De Oliveira Andrades Filho C, De FáTima Rossetti D. 2012. Effectiveness of SRTM and ALOS-PALSAR data for identifying morphostructural lineaments in northeastern Brazil. Int J Remote Sens. 33(4):1058–1077. doi:10.1080/01431161.2010.549852.
- Dhara M, Baisantry M, Prusty G. 2022. Automatic extraction and analysis of lineament features using ASTER and Sentinel 1 SAR data. J Earth Syst Sci. 131(2):111. doi:10.1007/s12040-022-01851-y.
- El-Desoky HM, Shebl A, Abdel-Rahman AM, Fahmy W, El-Awny H, El-Sherif AM, El-Rahmany MM, Csámer Á. 2022. Multiscale mineralogical investigations for mineral potentiality mapping of Ras El-Kharit-Wadi Khashir district, Southern Eastern Desert, Egypt. Egypt J Remote Sens Sp Sci. 25(4):941–960. doi:10.1016/j.ejrs.2022.09.001.
- Elhag M, Alshamsi D. 2019. Integration of remote sensing and geographic information systems for geological fault detection on the island of Crete, Greece. Geosci Instrum Method Data Syst. 8(1):45–54. doi:10.5194/gi-8-45-2019.
- Elmahdy SI, Mohamed MM, Ali TA. 2021. Automated detection of lineaments express geological linear features of a tropical region using topographic fabric grain algorithm and the SRTM DEM. Geocarto Int. 36(1):76–95. doi:10.1080/10106049.2019.1594393.
- Epuh EE, Okolie CJ, Daramola OE, Ogunlade FS, Oyatayo FJ, Akinnusi SA, Emmanuel EOI. 2020. An integrated lineament extraction from satellite imagery and gravity anomaly maps for groundwater exploration in the Gongola Basin. Remote Sens Appl Soc Environ. 20:100346. doi:10.1016/j.rsase.2020.100346.
- Es-Sabbar B, Essalhi M, Essalhi A, Mhamdi HS. 2020. Lithological and structural lineament mapping from landsat 8 oli images in ras kammouna arid area (Eastern Anti-Atlas, Morocco). Econ Environ Geol. 53(4):425–440.
- Farah A, Algouti A, Algouti A, El Badaoui K, Errami M, Ifkirne M. 2021. Lithological mapping and automatic lineament extraction using Aster and Gdem data in the Imini-Ounilla-Asfalou district, South High Atlas of Marrakech, Morocco. E3S Web Conf. 240 :04002. doi:10.1051/e3sconf/202124004002.
- Faryad SW, Collett S, Finger F, Sergeev SA, Čopjaková R, Siman P. 2016. The Kabul Block (Afghanistan), a segment of the Columbia Supercontinent, with a Neoproterozoic metamorphic overprint. Gondwana Res. 34:221–240.
- Faryad SW, Collett S, Petterson M, Sergeev SA. 2013. Magmatism and metamorphism linked to the accretion of continental blocks south of the Hindu Kush, Afghanistan. Lithos 175–176:302–314.
- Ghosh S, Sivasankar T, Anand G. 2021. Performance evaluation of multi-parametric synthetic aperture radar data for geological lineament extraction. Int J Remote Sens. 42(7):2574–2593. doi:10.1080/01431161.2020.1856963.
- Githenya LK, Kariuki PC, Waswa AK. 2019. Application of remote sensing in mapping hydrothermal alteration zones and geological structures as areas of economic mineralization in Mwitika-Makongo Area, SE Kenya. J Environ Earth Sci. 9(11)
- Guha A, Chatterjee S, Oommen T, Kumar KV, Roy SK. 2021. Synergistic use of ASTER, L-band ALOS PALSAR, and hyperspectral AVIRIS-NG data for exploration of lode type gold deposit – A study in Hutti Maski Schist Belt, India. Ore Geol Rev. 128:103818. doi:10.1016/j.oregeorev.2020.103818.
- Hubbard, Bernard E., Mack, Thomas J., Thompson, Allyson L.,Lineament Analysis of Mineral Areas of Interest in Afghanistan, US Geological Survey, 2012
- Innocent AJ, Chidubem EO, Chibuzor NA. 2019. Analysis of aeromagnetic anomalies and structural lineaments for mineral and hydrocarbon exploration in Ikom and its environs southeastern Nigeria. J African Earth Sci. 151:274–285. doi:10.1016/j.jafrearsci.2018.12.011.
- Javhar A, Chen X, Bao A, Jamshed A, Yunus M, Jovid A, Latipa T. 2019. Comparison of multi-resolution optical Landsat-8, Sentinel-2 and radar Sentinel-1 data for automatic lineament extraction: a case study of Alichur area, SE Pamir. Remote Sens. 11(7):778. doi:10.3390/rs11070778.
- Joel PK, Louise-Clotilde OAM, Evariste N, Nfor N, Malquaire KPR, Philippe NN. 2022. Identification of geothermal reservoirs in south cameroon from a combined landsat 8 and amt data. Int J Geophys. 2022:1324766.
- Kamal El-Din GM, El-Noby E, Abdelkareem M, Hamimi Z. 2021. Using multispectral and radar remote sensing data for geological investigation, Qena-Safaga Shear Zone, Eastern Desert, Egypt. Arab J Geosci. 14(11):997 doi:10.1007/s12517-021-07130-2.
- Kanda I, Fujimitsu Y, Nishijima J. 2019. Geological structures controlling the placement and geometry of heat sources within the Menengai geothermal field, Kenya as evidenced by gravity study. Geothermics. 79:67–81. doi:10.1016/j.geothermics.2018.12.012.
- Kapilan S, Elangovan K. 2018. Potential landfill site selection for solid waste disposal using GIS and multi-criteria decision analysis (MCDA). J Cent South Univ. 25(3):570–585. doi:10.1007/s11771-018-3762-3.
- Karapetov S, Sorokin Y, Sytov Y, Report VC-U, Afghan U. 1981. 1981 U. Geological structure of Kabul town region (Report of Logar and Helmand prospecting-mapping group in 1979–1981).
- Kemgang Ghomsi FE, Kana JD, Aretouyap Z, Ribeiro-Filho N, Pham LT, Baldez R, Tenzer R, Mandal A, Nzeuga A. 2022. Main structural lineaments of the southern Cameroon volcanic line derived from aeromagnetic data. J African Earth Sci. 186:104418. doi:10.1016/j.jafrearsci.2021.104418.
- Khan IH, Clyde WC. 2013. Lower paleogene tectonostratigraphy of Balochistan: evidence for time-transgressive late paleocene-early eocene uplift. Geosci. 3(3):466–501. doi:10.3390/geosciences3030466.
- Koike K, Nagano S, Ohmi M. 1995. Lineament analysis of satellite images using a Segment Tracing Algorithm (STA). Comput Geosci. 21(9):1091–1104. doi:10.1016/0098-3004(95)00042-7.
- Kokinou E, Panagiotakis C. 2020. Automatic pattern recognition of tectonic lineaments in seafloor morphology to contribute in the structural analysis of potentially hydrocarbon-rich areas. Remote Sens. 12(10):1538. doi:10.3390/rs12101538.
- Lahai YA, Anderson KFE, Jalloh Y, Rogers I, Kamara M. 2021. A comparative geological, tectonic and geomorphological assessment of the Charlotte, Regent and Madina landslides, Western area, Sierra Leone. Geoenviron Disasters. 8(1):1–17. doi:10.1186/s40677-021-00187-x.
- Lakshmi Keshava Kiran Kumar P, Veeraswamy G, Raghubabu K, Balaji E. 2020. Geochemical characteristics of iron ore deposits and processing of Landsat-8 data (geology, geomorphology and lineaments) in semi-arid region and using geospatial techniques. Model Earth Syst Environ. 6(2):1245–1252. doi:10.1007/s40808-020-00754-5.
- Lesage G, Byrne K, Morris WA, Enkin RJ, Lee RG, Mir R, Hart CJR. 2019. Interpreting regional 3D fault networks from integrated geological and geophysical data sets: an example from the Guichon Creek batholith, British Columbia. J Struct Geol. 119:93–106. doi:10.1016/j.jsg.2018.12.007.
- Maleki M, Niroomand S, Farahbakhsh E, Modabberi S, Tajeddin HA. 2021. Hydrothermal alteration and structural mapping of the Qolqoleh-Kasnazan shear zone in Iran using remote sensing data. Arab J Geosci. 14(16):1576. doi:10.1007/s12517-021-07920-8.
- Mallick J, Singh RK, AlAwadh MA, Islam S, Khan RA, Qureshi MN. 2018. GIS-based landslide susceptibility evaluation using fuzzy-AHP multi-criteria decision-making techniques in the Abha Watershed, Saudi Arabia. Environ Earth Sci. 77(7):1–25. doi:10.1007/s12665-018-7451-1.
- Mallick J. 2021. Municipal solid waste landfill site selection based on fuzzy‐ahp and geoinformation techniques in ASIR region Saudi Arabia. Sustain. 13(3):1538. doi:10.3390/su13031538.
- Mashkoor R, Ahmadi H, Rahmani AB, Pekkan E. 2022. Detecting Li-bearing pegmatites using geospatial technology: the case of SW Konar Province, Eastern Afghanistan. Geocarto Int. 37 (26):14105–14126. doi:10.1080/10106049.2022.2086633.
- Masoud A, Koike K. 2017. Applicability of computer-aided comprehensive tool (LINDA: LINeament Detection and Analysis) and shaded digital elevation model for characterizing and interpreting morphotectonic features from lineaments. Comput Geosci. 106:89–100. doi:10.1016/j.cageo.2017.06.006.
- Mavrantza O, Argialas DP. 2003. Implementation and evaluation of spatial filtering and edge detection techniques for lineament mapping: case study - Alevrada, Central Greece. Remote Sens Environ Monit GIS Appl Geol II. 4886:417. doi:10.1117/12.463275.
- Mohammadi FA, Amin ZM, Ahmad AB. 2020. Lineament assessment of aynak copper mine using remote sensing approach. IOP Conf Ser earth Environ Sci. 540(1):012034. doi:10.1088/1755-1315/540/1/012034.
- Mohammadpour M, Bahroudi A, Abedi M. 2020. Automatic lineament extraction method in mineral exploration using CANNY algorithm and hough transform. Geotecton. 54(3):366–382. doi:10.1134/S0016852120030085.
- Msaddek MH, Moumni Y, Chenini I, Dlala M. 2019. Applicability of developed algorithm for semi-automated extraction and morphotectonic interpretation of lineaments using remotely sensed data, Southwestern Tunisia. Remote Sens Earth Syst Sci. 2(4):292–307. doi:10.1007/s41976-019-00028-4.
- Nait Amara B, Aissa DE, Maouche S, Braham M, Machane D, Guessoum N. 2019. Hydrothermal alteration mapping and structural features in the Guelma basin (Northeastern Algeria): contribution of Landsat-8 data. Arab J Geosci. 12(3):94. doi:10.1007/s12517-019-4224-4.
- Naprstek T, Smith R. 2022. Convolution neural networks applied to the interpretation of lineaments in aeromagnetic data. Geophysics. 87(1):JM1–JM13. doi:10.1190/geo2020-0779.1.
- Narayan S, Sahoo SD, Pal SK, Kumar U, Pathak VK, Majumdar TJ, Chouhan A. 2017. Delineation of structural features over a part of the Bay of Bengal using total and balanced horizontal derivative techniques. Geocarto Int. 32(4):351–366. doi:10.1080/10106049.2016.1140823.
- Ngoroyemoto TFK. 2021. Evaluating the implications of lineaments on petroleum fields: south Sumatra, Indonesia. J Appl Geol. 6(2):77. doi:10.22146/jag.58161.
- Othman AA, Al-Maamar AF, Al-Manmi DAMA, Liesenberg V, Hasan SE, Obaid AK, Al-Quraishi AMF. 2020. GIS-Based modeling for selection of dam sites in the Kurdistan Region, Iraq. IJGI. 9(4):244. doi:10.3390/ijgi9040244.
- Oyedele AA. 2019. Use of remote sensing and GIS techniques for groundwater exploration in the basement complex terrain of Ado-Ekiti, SW Nigeria. Appl Water Sci. 9(3):1–13. doi:10.1007/s13201-019-0917-9.
- Pal SK, Majumdar TJ, Bhattacharya AK. 2006. Extraction of linear and anomalous features using ERS SAR data over Singhbhum Shear Zone, Jharkhand using fast Fourier transform. Int J Remote Sens. 27(20):4513–4528. doi:10.1080/01431160600658172.
- Pal SK, Majumdar TJ, Bhattacharya AK. 2007. ERS-2 SAR and IRS-1C LISS III data fusion: a PCA approach to improve remote sensing based geological interpretation. ISPRS J Photogramm Remote Sens. 61(5):281–297. doi:10.1016/j.isprsjprs.2006.10.001.
- Pandey P, Sharma LN. 2019. Image processing techniques applied to satellite data for extracting lineaments using PCI geomatica and their morphotectonic interpretation in the parts of Northwestern Himalayan Frontal Thrust. J Indian Soc Remote Sens. 47(5):809–820. doi:10.1007/s12524-019-00962-2.
- Pecsmány P, Hegedűs A, Vágó J, Németh N. 2021. Directional analysis of drainage network and morphotectonic features in the south-eastern part of Bükk region. HunGeoBull. 70(2):175–187. doi:10.15201/hungeobull.70.2.6.
- Peters, Stephen G., King, Trude VV, Mack, Thomas J., Chornack, Michael P.,Summaries of important areas of mineral investment and production opportunities of nonfuel minerals in Afghanistan, US Department of the Interior, US Geological Survey, 2011
- Pham LT, Oliveira SP, Le MH, Trinh PT, Vu T, Van Duong VH, Ngo TNT, Do TD, Nguyen TH, Eldosouky AM, et al. 2022. Delineation of structural lineaments of the Southwest Sub-basin (East Vietnam Sea) using global marine gravity model from CryoSat-2 and Jason-1 satellites. Geocarto Int. 37 (25):7681–7698. doi:10.1080/10106049.2021.1981463.
- Podwysocki M, Moik J, Shoup W. 1975. Quantification of geological lineaments by manual and machine processing technique. In: NASA Earth Resources Survey Symposium. Houston, Texas: NASA. p. 885–903.
- Pour AB, Hashim M. 2015. Structural mapping using PALSAR data in the Central Gold Belt, Peninsular Malaysia. Ore Geol Rev. 64(1):13–22. doi:10.1016/j.oregeorev.2014.06.011.
- Radaideh OMA, Grasemann B, Melichar R, Mosar J. 2016. Detection and analysis of morphotectonic features utilizing satellite remote sensing and GIS: an example in SW Jordan. Geomorphology. 275:58–79. doi:10.1016/j.geomorph.2016.09.033.
- Rahnama M, Gloaguen R. 2014. TecLines: a matlab-based toolbox for tectonic lineament analysis from satellite images and DEMs, part 1: Line segment detection and extraction. Remote Sens. 6(7):5938–5958. doi:10.3390/rs6075938.
- Ramli MF, Yusof N, Yusoff MK, Juahir H, Shafri HZM. 2010. Lineament mapping and its application in landslide hazard assessment: a review. Bull Eng Geol Environ. 69(2):215–233. doi:10.1007/s10064-009-0255-5.
- Ranjbari MR, Vagheei R, Salehi H. 2023. Integration of Landsat-8 and Sentinel-1 dataset to extract geological lineaments in complex formations of Tepal mountain area, Shahrood, north Iran. Adv Sp Res. 71(1):936–945. doi:10.1016/j.asr.2022.08.061.
- Rowan LC, Mars JC. 2003. Lithologic mapping in the Mountain Pass, California area using Advanced Spaceborne Thermal Emission and Reflection Radiometer (ASTER) data. Remote Sens Environ. 84(3):350–366. doi:10.1016/S0034-4257(02)00127-X.
- Ruleman C a, Crone a J, Machette MN, Haller KM, Rukstales KS. 2007. Map and Database of Probable and Possible Quaternary Faults in Afghanistan. USGS Afghanistan Proj Prod No 150, Open-File Rep 2007–1103.
- Rustami S, Saadi NM, Aboud E, Yonezu K, Watanabe K. 2017. Investigating structural and tectonic evolution of central afghanistan using remote sensing and gravity data. J Geol Geophys. 6:6. doi:10.4172/2381-8719.1000313.
- Sadiq S, Muhammad U, Fuchs M. 2022. Investigation of landslides with natural lineaments derived from integrated manual and automatic techniques applied on geospatial data. Nat Hazards. 110(3):2141–2162. doi:10.1007/s11069-021-05028-6.
- Saepuloh A, Haeruddin H, Heriawan MN, Kubo T, Koike K, Malik D. 2018. Application of lineament density extracted from dual orbit of synthetic aperture radar (SAR) images to detecting fluids paths in the Wayang Windu geothermal field (West Java, Indonesia). Geothermics. 72:145–155.
- Saha SK. 2022. Remote sensing and geographic information system applications in hydrocarbon exploration: a review. J Indian Soc Remote Sens. 50:1457–1475.
- Sahoo SD, Pal SK. 2019. Mapping of structural lineaments and fracture zones around the central indian ridge (10°S–21°S) using EIGEN 6C4 bouguer gravity data. J Geol Soc India. 94(4):359–366. doi:10.1007/s12594-019-1323-5.
- Saibi H, Azizi M, Mogren S. 2016. Structural investigations of afghanistan deduced from remote sensing and potential field data. Acta Geophys. 64(4):978–1003. doi:10.1515/acgeo-2016-0046.
- Sarkar P, Mondal S, Pal SK, Roy PNS, Sahoo SD, Widyadwatmaja A, Gupta S, Gupta A. 2022. New insights on the tectonic framework using EIGEN6C4 gravity data, seismicity, and finite element stress analysis: an attempt to map earthquake vulnerable zones in parts of North-East India and surroundings. Phys Chem Earth. 127:103195. doi:10.1016/j.pce.2022.103195.
- Seyitoğlu G, Esat K, Kaypak B, Toori M, Aktuğ B. 2019. Internal deformation of turkish–iranian plateau in the hinterland of Bitlis–Zagros Suture Zone. In Tectonic and Structural Framework of the Zagros Fold-Thrust Belt (Ed.Farzipour Saein, A.). Vol. 3. Elsevier; p. 161–244.
- Shebl A, Abdelaziz MI, Ghazala H, Araffa SAS, Abdellatif M, Csámer Á. Á. 2022. Multi-criteria ground water potentiality mapping utilizing remote sensing and geophysical data: a case study within Sinai Peninsula, Egypt. Egypt J Remote Sens Sp Sci. 25(3):765–778. doi:10.1016/j.ejrs.2022.07.002.
- Shebl A, Abdellatif M, Elkhateeb SO, Csámer Á. 2021. Multisource data analysis for gold potentiality mapping of atalla area and its environs, Central Eastern Desert, Egypt. Miner 2021, Vol 11, Page 641. 11(6):641. doi:10.3390/min11060641.
- Shebl A, Csámer Á. 2021. Reappraisal of DEMs, Radar and optical datasets in lineaments extraction with emphasis on the spatial context. Remote Sens Appl Soc Environ. 24:100617.
- Sheikhrahimi A, Pour AB, Pradhan B, Zoheir B. 2019. Mapping hydrothermal alteration zones and lineaments associated with orogenic gold mineralization using ASTER data: A case study from the Sanandaj-Sirjan Zone, Iran. Adv Sp Res. 63(10):3315–3332. doi:10.1016/j.asr.2019.01.035.
- Shirazi A, Hezarkhani A, Pour AB. 2022. Fusion of Lineament Factor (LF) map analysis and multifractal technique for massive sulfide copper exploration: the Sahlabad Area, East Iran. Minerals. 12(5):549. doi:10.3390/min12050549.
- Shnizai Z. 2020. Mapping of active and presumed active faults in Afghanistan by interpretation of 1-arcsecond SRTM anaglyph images. J Seismol. 24(6):1131–1157. doi:10.1007/s10950-020-09933-4.
- Sichugova LV ,Jamolov AT ,Movlanov JJ. 2021. Statistical analysis of lineaments using landsat 8 data: a case study of the Fergana valley (East Uzbekistan). Tajas. 03(03):83–92. doi:10.37547/tajas/Volume03Issue03-14.
- Siehl A. 2017. Structural setting and evolution of the Afghan orogenic segment - A review. SP. 427:57–88. doi:10.1144/SP427.8.
- Sigtryggsdóttir FG, Snæbjörnsson JT. 2019. Geological challenges and geohazard monitoring of a mega engineering hydropower project in Iceland. Eng Geol. 259:105152.
- Singh K, Arya AK, Agarwal KK. 2020. Landslide occurrences along lineaments on NH-154A, Chamba, Himachal Pradesh; extracted from satellite data Landsat 8, India. J Indian Soc Remote Sens. 48(5):791–803. doi:10.1007/s12524-020-01113-8.
- Soliman A, Han L. 2019. Effects of vertical accuracy of digital elevation model (DEM) data on automatic lineaments extraction from shaded DEM. Adv Sp Res. 64(3):603–622. doi:10.1016/j.asr.2019.05.009.
- Tagnon BO, Assoma VT, Mangoua JMO, Douagui AG, Kouamé FK, Savané I. 2020. Contribution of SAR/RADARSAT-1 and ASAR/ENVISAT images to geological structural mapping and assessment of lineaments density in Divo-Oume area (Côte d’Ivoire). Egypt J Remote Sens Sp Sci. 23(2):231–241. doi:10.1016/j.ejrs.2018.12.001.
- Tende AW, Aminu MD, Amuda AK, Gajere JN, Usman H, Shinkafi F. 2021. A spatial reconnaissance survey for gold exploration in a schist belt. Heliyon. 7(11):e08406. doi:10.1016/j.heliyon.2021.e08406.
- Tende AW, Mustapha T, Fru MIN, Gajere JN, Aminu MD. 2022. Hybrid extraction of tectonic lineaments from digital elevation model. Appl Geomat. 14(2):163–180. doi:10.1007/s12518-022-00422-6.
- Timkin T, Abedini M, Ziaii M, Ghasemi MR. 2022. Geochemical and hydrothermal alteration patterns of the abrisham-rud porphyry Copper District, Semnan Province, Iran. Minerals. 12(1):103. doi:10.3390/min12010103.
- Treloar PJ, Izatt CN. 1993. Tectonics of the Himalayan collision between the Indian Plate and the Afghan Block: A synthesis. SP. 74(1):69–87. doi:10.1144/GSL.SP.1993.074.01.06.
- Viveen W, Baby P, Hurtado-Enríquez C. 2021. Assessing the accuracy of combined DEM-based lineament mapping and the normalised SL-index as a tool for active fault mapping. Tectonophysics. 813:228942. doi:10.1016/j.tecto.2021.228942.
- Wang J, Howarth PJ. 1990. Use of the Hough Transform in Automated Lineament Detection. IEEE Trans. Geosci. Remote Sensing 28(4):561–567. doi:10.1109/TGRS.1990.572949.
- Wheeler BL, Bufe CG, Johnson ML. 2005. Seismotectonic Map of Afghanistan, with Annotated Bibliography. US Geol Surv Open-File Rep. http://www.usgs.gov/pubprod.
- Wilcox RE, Harding TP, Seely DR. 1973. BASIC WRENCH TECTONICS. Am Assoc Pet Geol Bull. 57(1):74–96.
- Xu J, Wen X, Luo D, He P. 2022. Comparison of optical satellite images in different spectral ranges for automatic lineaments extraction. Arab J Geosci. 15(10):976. doi:10.1007/s12517-022-10258-4.
- Yamusa IB, Yamusa YB, Danbatta UA, Najime T. 2018. Geological and structural analysis using remote sensing for lineament and lithological mapping. IOP Conf Ser Earth Environ Sci. 169:12082.
- Yousefi T, Aliyari F, Abedini A, Calagari AA. 2018. Integrating geologic and Landsat-8 and ASTER remote sensing data for gold exploration: a case study from Zarshuran Carlin-type gold deposit, NW Iran. Arab J Geosci. [11(17):1–19. doi:10.1007/s12517-018-3822-x.