
 ?Mathematical formulae have been encoded as MathML and are displayed in this HTML version using MathJax in order to improve their display. Uncheck the box to turn MathJax off. This feature requires Javascript. Click on a formula to zoom.
Abstract
Urban expansion possesses significant negative impacts on the environment, particularly in forest areas worldwide. This study aimed to analyze urban expansion by using stochastic modeling with the CA-Markov chain and multi-scenario prospects in Mettu area, Ethiopia. The Landsat images of 1986, 2000, and 2021 were used. The results reveal built-up areas gained 27.2%, of which cropland and forest accounted for 11.4 and 6.4%, respectively, within the 1986–2021 period. Despite the potential decline in urban growth rates, the model revealed that the spatial extent will likely expand twofold before the 2040s. In the rapid development (RD) scenario, urban development due to population increase will occur, which is also prevalent in the proposed suitable urban expansion (PSUE) scenario, but the ecological and economic protection (EEP) scenario reveals very limited. The findings of this study will have far-reaching impacts on ecological and economic livelihoods unless green economy principles are effectively implemented.
1 Introduction
Urban area expansion is the physical area growth or spatial pattern expansion of formerly civic land uses (Cheng and Masser Citation2003; Xian and Crane Citation2005; Linard et al. Citation2013; Wakode et al. Citation2014; Nor et al. Citation2017; Anand et al. Citation2018; Aliani et al. Citation2019; Regassa et al. Citation2020; Zhang et al. Citation2022; Citation2023a). The spatial pattern of urban expansion has a direct connection with city dwellers growth (Sudhira et al. Citation2004; Kamusoko et al. Citation2009; Seto et al. Citation2010; Angel Citation2011; Karolien et al. Citation2012; Arsanjani et al. Citation2013; Chen et al. Citation2014; Kimutai and Watanabe 2016; Li et al. Citation2018; Abebe et al. Citation2019; Zhao et al. Citation2020; Rufino et al. Citation2021; Bajracharya and Sultana Citation2022; Mansour et al. Citation2023). Urban areas cover only a small proportion of the global terrestrial area but are home to over 50% of the global population (Liu et al. Citation2019; Deribew Citation2020; Lin et al. Citation2021; Amini et al. Citation2022; Guo et al. Citation2022; Xie et al. Citation2023), and this would grow to 60% in 2030 (UN Citation2016). In this regard, the United Nations (UN) in its report also stressed that over 5.87 million sq km of global land has a great probability of being converted into civic areas by 2030, of which 20% of the total has a three-fourths probability of urban expansion. In line with this, the world’s population’s urban share would be suppressed to ∼70% by 2050 (Terfa et al. Citation2019). However, the rapid-fire proliferation of the world’s population over the last century has triggered the alteration of the earth’s surface, mainly in urban areas, where more than half of the world’s population subsists (Addae and Oppelt Citation2019; Zhou et al. Citation2021; Huang et al. Citation2021a).
An increase in urban expansion and population, combined with a drop in average urban population viscosity as a result of peri-urban area expansion, is now extensively observed in numerous metropolises in the developing world when compared to the advanced world (Deribew Citation2019; Baig et al. Citation2022; Guo et al. Citation2022; Yang et al. Citation2022; Zhou et al. Citation2022; Tariq and Mumtaz Citation2023; Usman et al. Citation2023). The study also indicated that the natural population growth rate (4% a year) and the influx of rural-urban migration will lead to higher urban expansion rates in Africa than in other regions of the world, with urban land cover growth of more than twelvefold between 2000 and 2050 in Sub-Saharan Africa projected in some scenarios (Dadi et al. Citation2016; Abebe et al. Citation2023).
By African standards, urban expansion in Ethiopia is characterized by a low level of urbanization, where ∼18% of the total population lives in urban areas (Deribew Citation2020; Moisa et al. Citation2022). Nevertheless, the rates of urban encroachment on the outskirts of new urbanizing municipalities have been dramatic in recent decades (Minta et al. Citation2018; Abebe et al. Citation2019; Koroso et al. Citation2021; Wang et al. Citation2022b; Abebe et al. Citation2023; Asif et al. Citation2023; Shi et al. Citation2023; Xing et al. Citation2023). In this regard, the findings revealed that poor government policy, demographic dynamics, and biophysical constraints (e.g. poverty) have driven similar metamorphoses. The anticipated civic expansions were perceived to have socio-economic significance. In turn, willful expansion of the urban fabric into the girding circumferences negatively affects ecological areas and ecosystem services and poses socio-economic challenges for a wide range of actors. As a result, rapid civic expansion has resulted in more than 80% of natural niche loss in local areas of Wuhan, China (Ke et al. Citation2018; Li et al. Citation2023). Similar marvels have also occurred in foliage reduction in the Greater Accra metropolitan area, Ghana (Addae and Oppelt Citation2019), hydrological loss in the northeastern Brazilian region (Rufino et al. Citation2021), a trouble to social and environmental health in the Pune metropolis, India (Lakshmi et al. Citation2019), loss of biodiversity in Saga province, Japan (Guan et al. Citation2011), and food insecurity in Irbid city, Jordan (Gharaibeh et al. Citation2020), to mention a few.
The study area, Mettu Town, has been hosting refugees from the northern, eastern, and western parts of the country, and neighbors from South Sudan reside in the town and environs. Today, the small town is rapidly expanding to the outskirts of fertile farmland and crucial protected areas. Despite its small land area, urban land and its expansion have had a significant impact on the national environment. The rapid urban expansion to the outskirts of ecosystem areas is anticipated to worsen in the near future unless scenarios of urban land expansion and management actions are undertaken early. Recent studies also suggest rapid expansions in the peripheral areas, unless managed effectively, can lead to serious ecological degradation and socio-economic disparities in the future (Kantakumar et al. Citation2016; Deribew and Dalacho Citation2019; Li et al. Citation2020; Huang et al. Citation2021b; Chen et al. Citation2022; Li et al. Citation2022; Usman et al. Citation2023). In addition, urban expansion and sprawl causes several ecological problems including urban land losses, air pollution and social problems (Istanbullu et al. Citation2023; Tian et al. Citation2023; Zhang et al. Citation2023b).
Therefore, the prediction of urban land growth trends and extents has become a phenomenal technique for ecosystem preservation and restoration and sustainable socio-economic development decisions (Wang et al. Citation2022a; He et al. Citation2023; Moisa et al. Citation2022).
In recent decades, urban growth modeling based on stochastic models (SM) of cellular automata (CA) integrated with Markov chain (MC) and remote sensing data in an ArcGIS environment has attracted considerable attention (Guan et al. Citation2011; Moghadam and Helbich Citation2013; Fu et al. Citation2018; Yue et al. Citation2021; Azari et al. Citation2022; Tariq et al. Citation2022; Mostafa et al. Citation2023; Shang et al. Citation2023). Even though other models such as SLEUTH are applied in urban growth simulation (Saxena and Jat Citation2019), it is claimed that the simulation process is restricted by fixed factors that cannot incubate or change with factors in space and time. Likewise, the support vector machine (SVM) utilized in the complexity relations of urban growth patterns (Karimi et al. Citation2019) does not explain the weights of driving forces. Moreover, it is vivid that the CA model alone is not appropriate to make simulations due to its dependency only on spatial data. Therefore, the Cellular Automata-Markov chain (CA-MC) model integrated with remote sensing data is an appropriate model for spatiotemporal dynamics considering how biophysical and socioeconomic variables affect life in and around urban fringe areas (Rimal et al. Citation2017; Lu et al. Citation2018; Fitawok et al. 2020; Li et al. Citation2022; Zhu et al. Citation2022; Liu et al. Citation2023; Mostafa et al. Citation2023; Yin et al. Citation2023). Even though unplanned urban expansion due to influx migration is a serious concern, little research attention has been given on urban expansion scenarios prediction, and causes rapid loss of non-urban land to urban development in Mettu area. Consequently, the study did not consider developing alternative scenarios to protect forests and crop fields from future aggressive urban land expansions. Having evidence based information about the past and current urban expansion enables to predict future urban expansion for infrastructural development and better urban management in the study area. Integrated CA-MC model with remote sensing data to model and predict the urban growth trends and extent and to develop three scenarios: rapid development (RD), ecological and economic protection (EEP), and proposed suitable urban expansion (PSUE) based on the recent urban land cover was used in the present study. These have been applied to preserve and restore ecological and economic ecosystem services and urban economic growth in the study area. Despite the high rate of urban expansion in the protected areas, the stochastic model and scenario-based model for better urban management were not used in the prior studies of our study zone. Therefore, the present study aimed to fill the existing research gap by integrating urban growth model of CA-Markov chain with multi-scenario prospects, in Mettu area, forest priority area in southwestern Ethiopia. This study seeks to detect the spatial extent and trends of urban land use/land cover change, identify basic parameters for urban growth simulation, and forecast urban growth and monitoring rapid unplanned urban expansions. The result of this study endorse to the literatures in the areas of urban land use management, agronomy, urban/peri-urban forestry, ecosystem services, landscape ecology, and environmental pollution and research to investigate the triggers and implement the suggested scenarios using participatory campaign in the region.
2. Study area
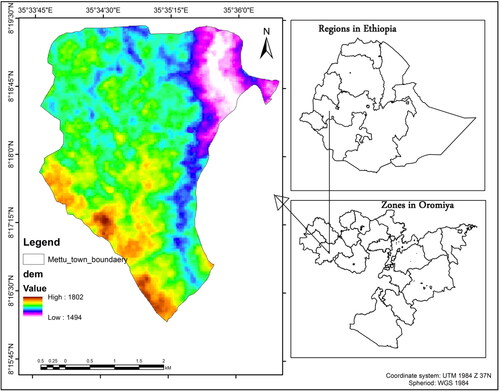
The Mettu area in southwestern Ethiopia covers 1626 ha and is located between 8° 15′ 52" to 8° 19′ 30" N and 35° 33′ 45" to 35° 36′ 52" E (). In terms of physiography, the study area is characterized by plains, plateaus, and mountains with elevations ranging from 1494 m in the northeast to 1802 m above mean sea level in the south and southwest, suggesting the area is physiographically very exposed to urban sprawl.
Figure 1. Location and topography of the study area.
Mettu is one of the fastest growing immigrant areas, with an increase in population and urbanization over the last few decades as a result of regional instability and national and cross-border refugees. In 2007 population census, Mettu had a total population close to 30,000, and this figure has surpassed by two folds in 2008 (CSA Citation2013). The organization, however reported that the proceeds level of the dwellers is per day 1$USA. Based on the figure, therefore, the population growth is growing even more briskly than denizens’ economy. Many outskirt villages have been agglomerated following poor urban management policies, despite the presence of vacant land or underdeveloped areas. The urban area and the outskirts of the study area are part of a forest priority zone, which is very rich in biodiversity and agriculturally more productive. This high rate of unplanned urban expansion has caused serious land use problems, such as the eternal loss of fertile farmland and the dense, moist, evergreen Afromontane forest. Hence, the area witness can formulate a resilient management strategy to escort future urban expansion and suggest suitable policies to control aggressive encroachments on fertile land and protected forest areas, thereby expediting decision-making processes.
The livelihood of the economy depends entirely on agriculture, forestry, shifting cultivation, and honeybee production. Mettu is one of the major tourist centers in the southwestern part of the country due to its ecotourism attractions and diverse biota. Yet, today, the ecological areas, fertile farmlands, and wetlands are rapidly being replaced by new settlement construction and free incentive investments, suggesting the remaining crop fields and biodiversity will be worsened in the near future.
3 Materials and methods
3.1. Data sources and Descriptions
To address the anticipated objectives of this study, cloud-free Landsat images of Thematic Mapper (TM of 1986), Enhanced Thematic Mapper Plus (ETM + of 2000), and Operational Land Imagery (OLI of 2021) at 30-meter resolution were freely accessed from the United States Geological Survey (USGS) via the Earth Explorer data system using https://earthexplorer.usgs.gov/ (). The former period was selected to evaluate resettlement policies, while the second period was chosen based on the availability of the data, and the final study period was selected to evaluate the status of recent urban expansion information in the study area. The satellite observation was used to determine the trends, extents, rates, and forecasts of urban expansion in the Mettu area.
Table 1. Descriptions of Input dataset used in the study.
Similarly, the Advanced Spaceborne Thermal Emission and Reflection (ASTER) Global Digital Elevation Model (GDEM) at 20-meter resolution was accessed by the USGS using the above links to generate topographical drivers (e.g. slope) for urban expansion scenarios. In addition to demographic data, accessibility parameters such as proximities to roads, urban centers, and forest edges were also applied as spatial data points to run the CA-MC model and develop scenarios for better urban management.
3.2. Remote sensing data analysis
3.2.1. Image preprocessing
Image preprocessing, including layer stacking, false color combination and sub-setting to the study area were applied for classification of urban land use land cover classes from Landsat images (Chander et al. Citation2009; Chima et al. Citation2018).
3.2.2. Sample size and accuracy assessment
Statistical compliance values of overall accuracies and Kappa tests have been developed for all classified images: 1986, 2000 and 2021. In this study, a total of 832 references of data points from each studied period were gathered, of which 632 and 200 points were employed for image classification and ground truth assessments, respectively. Hence, the classified data (row) and ground truth data (column) were compared in pivot table to evaluate the degree of accuracy level as (Chander et al. Citation2009). The producer (PAC), user (UAC) and overall accuracies (OAC), and Kappa coefficient (Khat) for 1986, 2000 and 2021 were computed accordingly (Equationequations 1-4).
(1)
(1)
(2)
(2)
(3)
(3)
(4)
(4)
3.3. Urban growth modeling and monitoring analysis
3.3.1. Patterns of urban land use change and urban growth mapping
Trends of urban land use land cove change (Yuan et al. Citation2005; Deribew and Dalacho Citation2019; Li et al. Citation2022), was used to assess the change results over the past three decades (1986–2021) using Equationequation 5(5)
(5) . The gross gains and losses of urban land use patterns for the 1986, 2000, and 2019 periods were calculated using Equationequations 6
(6)
(6) and Equation7
(7)
(7) , respectively (Weng Citation2001). Finally, the rate of urban growth and extents for the study periods were computed (Equationequation 8
(8)
(8) ) using the algorithm developed by Puyravaud (Citation2003).
(5)
(5)
Where: A1 and A2 are the area coverage of urban land at initial time (t1) and at final time (t2). The end result of positive and negative standards signifies the surges and drops in magnitude, respectively.
(6)
(6)
(7)
(7)
(8)
(8)
Where: Gij and Lij define the gross gains and losses, the proportions of landscape Pi+ and P+j that are occupied by class i and j in different time periods, and Pjj is represents unchanged class. P is the % of the r of class loss; Δt is the time interval in the study periods, ln is the base of natural algorithm function.
3.3.2. Modeling urban growth with an integrated stochastic model and calibration
In this study, stochastic modeling of the integrated CA-MC model was applied because, unlike other models, it deliberates both spatial and temporal changes. Moreover, it has an open structure that simplifies the integration of different external socio-economic, demographic, and environmental parameters that stimulate urban land expansion processes. The conversion rules of CA can be designed in many ways to consider these factors (Guan et al. Citation2011; Lu et al. Citation2018; Wu et al. Citation2023; Yuan et al. Citation2023). In this regard, proximity analysis (from road networks, crop fields, forest edges, drainage networks, environmentally sensitive areas, and urban centers), topographic variables (elevation, slope, land use/land cover, and underdeveloped areas), and demographic factors (population density) have been considered vital parameters in the analysis. Therefore, the stochastic empirical model is capable of integrating the neighborhood effects of the CA and the historical probability effects of the transition of the MC (Equationequations 9(9)
(9) , Equation10
(10)
(10) ), thus providing a more comprehensive prediction of the urban land change. The class-to-class transitional probability matrix (p) defines the likelihood of class changes considering the present pixel depends on its historical land in present time (t) and another time (t + 1), calculated as
(9)
(9)
(10)
(10)
Where: St is the state of pixel in the CA at present period, St +1 is the state of the pixel in the CA at period (t + 1), and Pij is the transition probability matrix.
Therefore, this study employed a recent satellite image taken in 2021 (OLI) to predict urban land use changes in 2038. To estimate the overall accuracy, the result obtained from CA-MC was validated using the error matrix as consulted by Pontius et al. (Citation2008).
3.3.3. Urban land encroachment management scenarios
The urban land expansion of Mettu was simulated until 2038 with the CA-MC model. The eyewitness and the analysis also showed that there would be a likelihood of ecological disruptions and socio-economic challenges before the 2040s. Hence, three scenarios: rapid urban development (RD), ecological and economic protection (EEP), and proposed suitable urban expansion (PSUE) were developed based on the satellite image taken in 2021. As a result, eleven driving factors, namely population density, distance from the forest edge, drainage, road network, built-up areas, urban centers, undeveloped areas, elevation, slope, crop field areas, and soil, were considered and analyzed. The RD scenario assumes urban development (e.g. investments, infrastructure, service sectors, and economic sectors) increases with an increasing population to satisfy the demand of the landless and unemployed, thereby achieving urban economic development opportunities. Under this scenario, however, multiple urban encroachments along the azimuth and locations were detected and identified. The second scenario assumes that all urban encroachments on protected areas and environmentally sensitive areas should be restricted and that off-farm activities and smokeless industries should be promoted and expanded using free incentive investments. As a result, the EEP scenario was developed in order to preserve ecosystem services while avoiding local temperature increases, thereby achieving sustainable urban economic development through a green economy strategy. The latter scenario proposes designing the town with no informal settlements and a minimal inflow of migrants, as well as creating minimal or stagnant urban growth in economically and environmentally low-valued areas for better urban life.
4. Results
4.1. Spatiotemporal analysis of urban expansion
The urban land use and land cover maps of the study area were generated for the study periods of 1986, 2000, and 2021 (). In 1986, the landscape was subjugated by peri-urban agriculture and the moist evergreen Afromontane forest, roughly covering over two-thirds of the urban landscape. The confusion matrix of the compliance statistical values of 95.5, 97.5, and 98.5% of overall accuracies with corresponding Khat values of 0.94, 0.97, and 0.98 for the classified images of 1986, 2000, and 2021 is shown in . In this regard, the matrix report displays classified maps met the minimum accuracy requirements for change detection analysis.
Figure 2. Urban land-use maps in 1986 (a), 2000 (b), 2021 (c), and projected for 2038 (d).
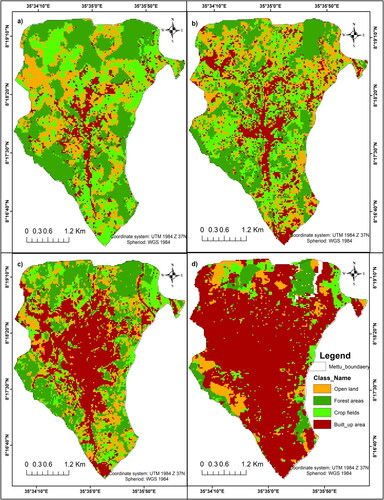
Table 2. Contingency table matrixes for the 1986, 2000 and 2021 classification maps.
In 2000, Afromontane forest land lost its predominant position to peri-urban agricultural land (∼30%), and urban open land sustained its position as the third-largest urban land cover class with a ∼24% cover (). In 2021, the built-up area had covered one-third of the total urban landscape and had become almost as large as the combined open-urban land and peri-urban agricultural land. Spatially, this also indicates that the built-up expansion has, above all, been pronounced in erstwhile outskirt areas of the north, south, and southwest, where ecological and carbon storage areas are phenomenal. Thus, the built-up area has more than doubled from 159.75 ha (9.82%) in 1986 to 335.8 ha (20.65%) in 2000, and it has now increased threefold to 550.64 ha (34%) in 2021.
Table 3. urban land use/land cover class and class-to-class transitions in different periods.
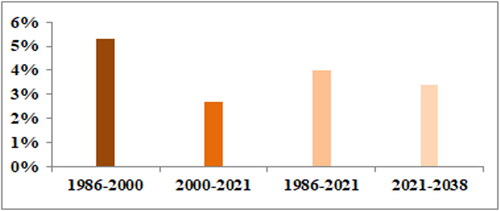
Similarly, and illustrate urban land expansion at the expense of other urban land cover classes. In the first study period (1986–2000), built-up areas and peri-urban agricultural land were the most dynamic in terms of gaining or losing areas relative to each other. In this regard, about 134.24 ha (8.3%) of built-up areas have surged into the fertile agricultural land of the northern, southwestern, and eastern fringes of the area (). This expansion has also resulted in a sharp and accelerated encroachment of 184.32 ha (11.3%) between 2000 and 2021. Overall, in the past three decades, about 388.85 (24%), 306.63 (18.9%), and 289.89 ha (17.8%) of fertile peri-urban agricultural areas, moist evergreen Afromontane forest areas, and undeveloped areas (open land) have been lost, particularly to built-up areas. As a result, the area has been expanding at an annual rate of 5.3, 2.7, and 4% in the first, second, and simulated periods, respectively ().
Figure 3. Built-up area patterns in 1986 (a), 2000 (b), 2021 (c), and projected for 2038 (d).
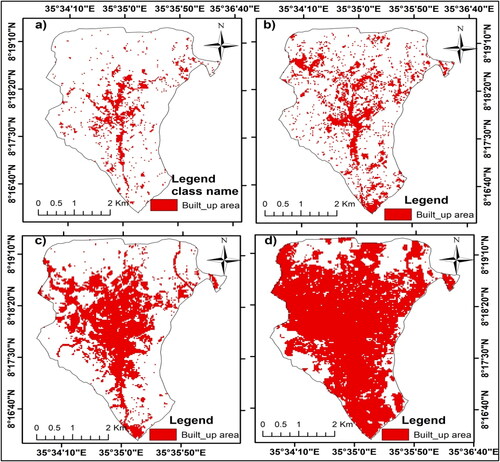
Figure 4. Built-up area gains and losses, particularly from forest and crop fields in each span periods, and projections.
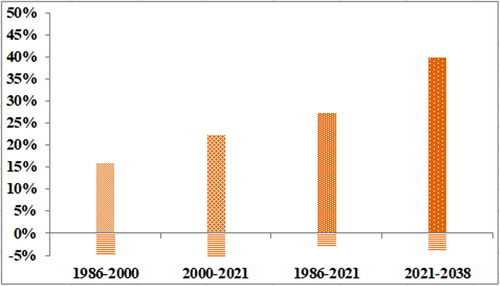
Figure 5. Annual rate/potential of urbanization in each span period.
4.2. Probabilities of MC transitions and CA-MC integration with validation
4.2.1. Probabilities of MC transitions
represents the MC transition probability matrix computed based on the image taken between 2000 and 2021. The matrix was obtained by combining the spatial distribution, standard, and weight of the assessment index. It reveals the transition probability matrix that was generated to show the transfer direction of land use types. Elevation, slope, population density, distance from road networks, distance from the eastern edge, distance from drainage networks, and land use/land cover have more significant effects on the transition of the 2038 year map. The parameters determined the quantity and location of the simulated potential changes in urban land-use types, mainly built-up area expansions. The majority of the built-up areas are located along the road in a flat area about 1600 m above sea level, far from drainage but aggressively encroaching on forest areas and fertile farmlands. The predictions for the results of the spatial trend are presented in , b. The transition potential of the moist, evergreen Afromontane forest area (0.47) and fertile farmland (0.41) will likely change to a built-up area. Therefore, based on this matrix, it was used to calculate the predicted urban land transitions for the study periods of 2021–2038 ().
Table 4. Markov transition Probabilities for projected span period (2021-2038).
4.2.2. Integrated CA-MC implementation and validation
The stochastic CA-MC urban growth model was calibrated to predict urban expansion in 2038 and land change between 2021 and 2038 (). In this regard, the combination of a suitability map, the 2021 land use map, and the transition probabilities have been considered. As a result, it is predicted that the 2038 map () will be based on the assumption that the pattern of land transformation will track a similar pattern to that of the past and will be affected by the same triggers at the same level.
The projected map for 2038 assumed that urban areas would increase from 550.64 ha (33.87%) in 2021 to 1134.99 ha (69.8%) in 2038, indicating an urban land increase of 584.35 ha (36%) (; ). By the same token, peri-urban agricultural land and moist evergreen Afromontane forest area would shrink to 161.2 ha (9.92%) and 163.5 ha (10.06%), respectively, while undeveloped area would also shrink to 166.29 ha (10.23%). On the other hand, the total urban coverage in 2038 is assumed to change by 35.94% compared to 2021, changing its percentage from ∼34% to an overwhelming 69.8% at an annual rate of 3.4 (, b; ). The statistics for the CA-MC model validation performance of the predicted 2038 land use map of the urban extent of the region have been tested, and it was able to correctly predict the total urban expansion with an overall accuracy of 90.01% and a Kappa index of 0.82, which occurred between 2021 and 2038 and met the minimum requirement.
4.3. Scenarios of urban expansion management
The simulated urban growth model analysis for 2038 revealed that the conversion of forest land to the built-up area would be 210.42 ha (12.94%) with a probability of 0.47, and urban/peri-urban agriculture to the built-up area would be 176.49 ha (10.85%) with a probability of 0.41. Yet, such swift and unplanned urban expansion would have far-reaching impacts on the economy, the local climate, and ecosystem services. Therefore, designing future scenarios is found to be crucial to evading or minimizing unnecessary, unplanned urban expansions to the outskirts. Therefore, based on the analyzed results of the recent span period, we developed three scenarios that mainly emphasized improving urban expansion monitoring, thereby preserving socio-economic and ecological resources and the climate nexus. Based on the image taken of 2021 urban land change and combined with land demand under these scenarios, about eleven driving factors were used and analyzed: population density, distance from the forest edge, crop field areas, drainage, road network, built-up areas, urban centers, underdeveloped areas, elevation, slope, and soil.
4.3.1. Rapid development (RD) scenario
Under the RD scenario, conversion to urban land occurs primarily in the outskirt areas of the northeast, northwest, and southern parts of the study area (). Unfortunately, rapid urban encroachments due to free incentive investments and infrastructural developments are expected to surge into ecologically important areas such as forest areas, crop fields, along roads, and far from drainage networks. Nonetheless, urban expansion is expected to be slow in inaccessible areas (sparsely populated areas), such as plateaus, valley areas with moderate to steep gradients, underdeveloped areas, and near drainage areas, due to rapid investments and infrastructural developments. However, a reduction in recent urbanization (by half) may have its own effects on regional urban economic development. However, about 87% of the total study area will be exposed to the spatial extent of urban land through investments and infrastructure. According to this scenario, ecological and fertile croplands would be paralyzed and reduced by 78.7% as a result of rapid free incentives and infrastructural developments to meet the demands of inhabitants.
Figure 6. Urban expansions under different scenarios as 2021 a reference; RDS (a), EEPS (b), and PSUES (c).
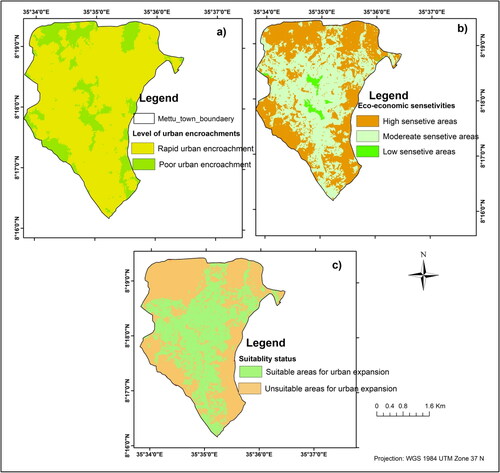
4.3.2. Ecological and economic protection (EEP) scenario
The scenario assumes urban and peri-urban land covered with moist evergreen forest, crop fields, and environmentally sensitive areas will be sustained, preserved, and restored. According to this scenario, the expansion trend for the built-up areas is relatively low in the fertile land and forest areas and moderately to highly sensitive in the underdeveloped areas (economically poor areas), particularly in the northwest and center of the study area (). Compared to the RD scenario, it places more emphasis on managing urban expansions in environmentally sensitive areas and gives due attention to balancing the temperature and price of goods and services, as well as expanding the yield of crop fields and forest areas. As a result, areas close to the forest edge at a radius of 0.5 km and to cropland at a radius of 0.3 km would be free from any construction of settlements, or built-up areas, or invasive infrastructural developments. In this scenario, protected forest land is expected to be free from any human intervention, thereby establishing ecological tourism farms. In other words, forest land that has been covered by 28.95% would be conserved, all crop fields would be managed, and yields would be technologically improved.
4.3.3. The proposed suitable urban expansion (PSUE) scenario
It is assumed that human settlements and infrastructural developments will be expanded to fulfill the demands of residents and create job opportunities. However, the scenario proposed that suitable areas for potential expansion would be areas located at a distance of < 0.2 km from built-up areas, nearby roads and rivers, densely populated areas, underdeveloped areas, very low-production crop fields, and flat land areas at moderate altitude (). However, areas far from roads, steep slope areas, high altitudes, areas near the forest, very fertile crop fields, and wetlands would be less suitable. So, the central, northeastern, northwestern, and southern parts of the town would likely be suitable for urban expansion compared to the RD scenario. Yet, similar to EEP, it was designed to reduce the pressure of human intervention on natural resources, mainly in the forest, crop fields, and environmentally sensitive areas. In contrast to EEP and RD, it assumed a high rate of population growth, weak government urban land policy, and unrestrained urban sprawl coupled with environmental risks and socio-economic disparities would destroy not only the natural resources but also the land-traitor teardrop fields of security, land revenue, public health, employment, and cultural resources of the town. Therefore, in this scenario, 69.7% of the town would be suitable for urban expansion with an annual growth rate of less than 1%. This can be achieved through utilizing family planning, controlling informal settlements, land reform, improving land revenue, expanding micro and macro business enterprises, intensifying urban green infrastructure and ecotourism areas, establishing and working hard on environmental protection and management, and reducing internal migration by benefiting youths in their original homelands.
5. Discussions
The results attained from the synoptic analysis of built-up area expansion for the past three decades revealed that the town has shown drastic urban expansion to the outskirts. In this regard, built-up areas and peri-urban agriculture areas dominated the gains and losses, respectively, indicating a combination of socio-economic, weak government urban land policy, and biophysical factors might drive such unprecedented changes.
The first study span period was characterized by a swift increase both in spatial extent nationwide and in the rate of built-up area expansion (5.3% per annum) following nation-wide planned resettlement programs. This indicates the annual rate at which the growth of the town has been twofold ahead of the country’s annual urbanization rate. The same pattern was observed in the Hawa-Galan district in southwest Ethiopia, where settlements increased from 0.8% in 2000 to 4.4% in 2021 due to the implementation of a resettlement policy that pushed urban encroachment in the forest area (Yadeta et al. Citation2022). The same experiences have also been reported in Uganda’s oil exploration area (Ssekandi et al. Citation2017) and the Lembus forest area in Kenya (Kimutai and Watanabe Citation2016). They reported that planned resettlement schemes led to substantial urban encroachments, particularly in forest areas and crop fields. Yet, studies confirmed that despite the response to the tragedy of land degradation, the program may have resulted in urban sprawl and socio-economic disparities (Li et al. Citation2018; Natarajan et al. Citation2019; Xu et al. Citation2023; Zhang et al. Citation2023b). In the recent span period (2000–2021), the Mettu area has seen a quadrupling of built-up encroachments to the outskirts, particularly to the forest and peri-urban agricultural areas, with a fold of positive net change, though the rate of growth is decreasing to 2.7% per annum. This massive urban expansion may be driven by rapid population growth, formal settlements through the government’s land lease coupled with informal settlements, and subsidized or free land for construction. In this regard, urban encroachments due to informal settlements on the urban fringes have accelerated serious urban sprawl problems. The same experience has also been reported: rapid urban expansion in the entire urban peripheries has resulted in increasing the prices of crop fields and a loss of biodiversity in the satellite area on the western fringe of Addis Ababa city, Ethiopia (Deribew Citation2020). In line with this, the land lease proclamation of Ethiopia (721/2004) was designed to hold land in the ownership of the state by transferring all urban landholdings into the lease system to advance urban infrastructural developments (Abebe et al. Citation2019). Despite its urban development strategy, urban and peri-urban land lease systems have been incubating colossal informal settlements, which in turn affect urban planning, municipal revenue, and the ecosystem in the region.
The result of the stochastic model revealed that urban expansion will likely continue badly (40% of total gain) in the outskirt areas (forest and crop fields) following rapid population growth and socio-economic and biophysical drivers. As far as population growth due to natural and influx migration is concerned in the urban growth process, the demand for economic gains and social aspirations for quality of life will increase. As a result, studies suggest that the imbalance between environmental resources and socio-economic growth in urban areas will jeopardize urban planning and management at the expense of urban economic development (Guan et al. Citation2011; Chen et al. Citation2014; Nor et al. Citation2017; Deribew Citation2019; Koroso et al. Citation2021; Zhang et al. Citation2022; Shi et al. Citation2023). Furthermore, in due time, we predict there will be overwhelming urban sprawl due to socio-economic and biophysical drivers. In this regard, distances to the road, forest edge, drainage, urban center, slope, soil, elevation, etc., can severely affect the size, form, structure, and setup of the town expansion. The same experience has also been reported in Huicheng province, China, where areas adjacent to the main road networks, gentle-moderate slope areas, and productive soils were predicted to be more prone to change into urban areas (Zhang et al. Citation2019). Similarly, studies argue that urban infrastructural developments can guide potential built-up area expansions (Kantakumar et al. Citation2016; Fu et al. Citation2018; Karimi et al. Citation2019; Huang et al. Citation2021b; Azari et al. Citation2022; Enoguanbhor et al. Citation2022; Abebe et al. Citation2023). Despite the potential decline in urban growth rate shown in the recent study period, the spatial extent and trends of Mettu area expansion are expected to experience rapid growth before the 2040s. In line with this, our projection has revealed that most potential urban expansion will occur over crop fields (∼10.9%) and forest areas (∼13%), paralyzing food production and supply, carbon sequestration, habitat provision, and drought in the region. However, the implementation of appropriate urban land planning and management is essential to curb the rapid sprawl into agriculturally productive land and ecologically vibrant areas on the one hand and mobs in the center areas on the other. As a result, scenarios were developed to minimize the profound impacts of swift urban expansion in the study area.
The projections suggest that the RD scenario features the most rapid infrastructural development expansions to accessible areas (33.87 to 87%) and a decrease in crop fields, whereas the EEP scenario has the largest increase in urban encroachments to underdeveloped areas (4.9% to 6%), the largest expansion of the urban forest ecosystem, and the rapid development of urban-peri-urban agricultural production. The result revealed that the rate of urbanization has decreased twofold in the recent study period. However, from an economic point of view, urbanization decline may pose an economic recession because of the negative impacts on employment, industrial production, and property value (Chen et al. Citation2022; Zhou et al. Citation2023). The projection, therefore, which mainly focuses on the direct economic significance of infrastructural developments coupled with job opportunities and increasing municipal revenue through the land lease system, reveals that the RD scenario is appropriate. Despite its significance, these rapid urban encroachments to accessible areas and directions in the RD scenario of the study area will be evidently faster than that country’s average, suggesting careful urban expansion to in- and out-of-skirt areas is required. Prediction of urban expansion was investigated by using CA-Markov model in worldwide (Isinkaralar et al. Citation2022; Isinkaralar and Varol Citation2023; Wang et al. Citation2023). In addition, similar scenario results were widely reported in many areas of Sub-Saharan Africa, such as Nairobi, Kenya (Mundia and Aniya Citation2005), Kampala, Uganda (Karolien et al. Citation2012), and Addis Ababa, Ethiopia (Deribew, Citation2020), to meet the demand of the urban population. Similarly, rapid urban expansion due to new settlement construction would likely increase by 43% in the long-term in 2057 in the city of Kastamonu, Türkiye (Isinkaralar et al. Citation2022). In the same token, a recent study in Asia has also investigated the likelihood that potential areas are more likely to undergo acute urban expansion in Chattogram, Bangladesh, in the coming two decades (Bajracharya and Sultana Citation2022). Nonetheless, unplanned rapid infrastructural developments on the city’s outskirts as part of urban expansion may put additional strain on the city’s ecological and economic resources. In line with this study, it is also projected that approximately 50–63% of cropland is predicted to be lost due to incubating urban land encroachments, and as a result, global production will drop by as much as 4%, consistent with the annual food needs for a certain crop of 122–1389 million people (Chen et al. Citation2022). As a result, we have identified the pressure caused by potential urban encroachments as declining for ecological and economic zones in scenario EEP.
In the EEP scenario, areas in and around crop fields are promised to be protected from an unplanned high rate of urbanization. The figure reported that the annual rate of urbanization has decreased (by two-fold) from 5.3% in 1986–2000 to 2.7% in 2000–2021. Based on this figure, the scenario’s assumed potential urban encroachments into environmentally sensitive areas will likely decrease if the urban expansion direction is shifted to underdeveloped areas (ecologically and economically low-valued), which cover more than 20% of the total study area. In contrast to the RD and PSUE scenarios, using the adoption of modern technology (from well-developed countries), all forest and agricultural areas will expand both in and out of their areas. Therefore, in contrast to the PSUE scenario, low-yield crop fields due to soil, climate, and biophysical drivers need to be treated technologically to produce more yield to sustain food security at the expense of colossal investments and infrastructure in the region. Our forecast indicates that the green economy will meet the synergies of the ecological-economic profit nexus in the study area. Today, the Federal Democratic Republic of Ethiopia (FDER) government is continuing to work hard on planting and seeding native and edible trees in every home garden, protected areas, religious and public institutions, degraded areas, crop field areas, flooded areas, along road and river banks, and sloppy areas. Activities have been implemented, and follow-up is being strengthened. This is also recommended to create operational protection of forest areas and agricultural lands; therefore, it calls for increased policymakers’ efforts in educating policymakers and the development of more comprehensive governance regimes (Sing Citation2014; Barthel et al. Citation2015; Chima et al. Citation2018; Agyemang and Silva Citation2019; Amini et al. Citation2022; Usman et al. Citation2023). The EEP scenario also suggests the significance of preserving high-quality crop fields and edible plant fruits to reduce the effects of urban expansion on green economy capacity. As a result, this scenario projection shows that in and around these areas, climate-smart agriculture, food security, habitat provision, carbon sequestration, and sustainable quality of life are expected. In the PSUE scenario, new urbanization in suitable areas for human settlements and infrastructure will likely reduce the burden of urban densification in the center and outskirts and be found to be the best solution for property values for residents. However, PSUE will have some agricultural land and forest area losses due to population density and growth, while EEP will experience very few or no forest or crop field losses due to the effect of the green economy principle. In contrast, in PSUE, potential agricultural land and tree stands will be masked by the linear urban suitability areas located on or around the roads, drainages, gentle slope areas, densely populated areas, areas covered with nitosols, and areas located in the near radius of the urban center. Yet, such a potential loss in PSUE may pose a challenge towards improving environmental sustainability unless population growth due to influx migration is limited using strict monitoring strategies as consulted by Agyemang and Silva (Citation2019).
In terms of future urban management, the PSUE scenario appears to be similar to EEP, unless more fragmented and sparse patterns are potentially observed due to biophysical, socio-economic, and demographic drivers. This implies that as long as less productive agricultural lands and forest areas are commenced to urban land, more people will end up living in inaccessible areas (steep slopes and flood-prone areas) and less productive agricultural lands and forest areas. Similarly, when conducting land reform or land provision in the outskirts as a coping mechanism for the scarcity of housing for the landless and youths, PSUE will inevitably face significant challenges on the side of sprawling urban, socio-economic, and cultural values, urban heat, urban flood, infrastructural developments and utilities, food nutrition, job opportunities, urban waste, diseases, and so on (Fitawok et al. Citation2020; Rufino et al. Citation2021; Li et al. Citation2022; Zhang et al. Citation2023b). Therefore, reducing urban densification in the center, plummeting population growth (through awareness and active family planning), monitoring urban encroachment (predominantly in environmentally sensitive areas), and planning infrastructural developments can enhance the usefulness of the PSUE scenario.
6. Conclusion and implications
The stochastic CA-MC model was applied to simulate and monitor urban expansion in the Mettu area from 1986 to 2021 and from 2021 to 2038, and the projected results have been validated. By the same token, the projection of the agreement model and Kappa statistical value was satisfied the minimum requirement i.e. 0.82.
The massive encroachments of built-up areas into the remnant forests may serve as a genetic pool for future dispersal, but the rate at which forest clearance occurs may result in declines in ecosystem integrity and a local temperature increase. In line with this, the removal of forest cover on the mountain hills and plateaus will increase the risk of soil erosion and land fertility. Therefore, implementing a green economy by considering the EEP scenario can manage the remnant forest areas in the Mettu area. Moreover, the substantial conversion of crop fields into built-up areas has also had great impacts on food production and supply, employment, and industrial production. Our findings reveal that crop field losses induced by urbanization went from 8.3% of the total crop area in the first span period to 11.34% in the recent span period, triggering food shortages for human society and employment opportunities. Rapid urban land expansion to the outskirts is quickly eating up the outskirts of fertile crop field areas, and this may also result in increasing foreign debt, migration, soil degradation, and disturbing the mountain ecosystem services in the north, south, southwest, and east of the Mettu area. Therefore, the significant protection of crop fields will be rescued in the EEP and PSUE scenarios.
The projected urban land change probability also proves that this drastic urban expansion to the center and outskirt areas will continue twofold in the coming two decades. In this regard, about ∼13 and ∼11% of the total moist evergreen forest areas and crop fields, with a probability of 0.47 and 0.41, respectively, will likely be transformed into built-up areas, directing socio-economic and biophysical drivers. This will have far-reaching impacts on ecological and economic livelihoods in the region unless green economy principles are effectively implemented in the near future. This calls, therefore, for rapid-planned infrastructural development expansions, thereby swiftly growing micro and macrobusiness enterprises, off-farm activities, industrial parks, industrial production, and innovations that the RD scenario has presented in this study. The scenario predicts that rapid infrastructural development will shut down not only people living in inaccessible areas but also those in poor living conditions.
Despite the massive job opportunities and rapid economic development, the RD scenario presents rapid urban sprawl due to infrastructural developments that will occur along the main road, drainages, flat-to-steep sloppy areas, economically productive land, sparsely populated areas, and some environmentally sensitive areas. Whereas this is also prevalent in the PSUE scenario, the EEP scenario reveals very limited usage. According to the EEP scenario, urban infrastructure development, built-up areas, and industrial production will take place in 20% of total underdeveloped areas (economically low-valued areas), and the proportion of urban dwellers living within 0.5 and 0.3 km of forest and crop field areas, respectively, is expected to fall, implying that urban green economies will be adopted in and out of the skirt areas. While population growth continues to decline (2.7 to 1%), urban expansion at a distance greater than 0.2 km from the center is expected to decrease, as suggested in PUSE. This scenario predicts areas close to roads, drainages, urban centers, infrastructural developments, gentle slopes, disturbed crop fields, and forest areas that are typically accessible zones for urban expansion. This implies that as long as less productive agricultural lands and forest areas are subjected to urban land expansion, more people will end up living in inaccessible areas (steep slopes and flood-prone areas) and less productive agricultural lands and forest areas. However, the advance of satellite towns to subsidiary urban hubs (underdeveloped areas), an outer ringway linking these hubs and high-rise zones in the Mettu area, and the satellite towns are effective actions to offset the rapid urban sprawl in favor of a more structured metropolitan area that would increase the green economy and quality of life of many inhabitants, as suggested in the EEP scenario.
As to the limitations of this, in the Stochastic model we used for CA-MC to analyze the trends of urban expansion and identify the role of biophysical and socioeconomic variables in predicting the potential process of urban encroachment, the non-quantitative and heterogeneous variables of urban expansion using an agent-based model are not incorporated. Therefore, all these limitations will be overcome in our future work by applying different integrated models such as artificial neural network (ANN), logistic regression, and correlation with the help of recent and old scenario comparisons to achieve sustainable urban land management.
Acronyms and abbreviations
CA-MC: Cellular Automata and Markov Chain Model; DEM: Digital Elevation Model; GIS: Geographic Information System
Availability of the data and d materials
All data are included in the manuscript.
Consent for publication
We agreed to submit the original manuscript to the Journal of Geocarto International and approved the original manuscript for submission.
Ethics approval and consent to participate
Not applicable.
Acknowledgments
The authors thank the participants in and around Mettu who helped during field data collection and provided their views. We also thank our two external advisors for their priceless and constructive comments. We also thank the two anonymous reviewers and editor in the journal of Geocarto International for their constructive comments. Finally, we are greatly indebted to the USGS for offering free access to Landsat imageries.
Disclosure statement
Authors declare that they have not competing interests.
Additional information
Funding
References
- Abebe MS, Derebew KT, Gemeda DO. 2019. Exploiting temporal-spatial patterns of informal settlements using GIS and remote sensing technique: a case study of Jimma city, Southwestern Ethiopia. Environ Syst Res. 8(1):1–11. doi: 10.1186/s40068-019-0133-5.
- Abebe S, Deribew KT, Alemu G, Moisa MB. 2023. Modeling Eragrostis tef Zucc and Hordeum vulgare L cropland in response to food insecurity in the Southwestern parts of Ethiopia. Heliyon. 9(3):e14535. doi: 10.1016/j.heliyon.2023.e14535.
- Addae B, Oppelt N. 2019. Land-use/land-cover change analysis and urban growth modelling in the greater accra metropolitan area (GAMA), Ghana. J Urban Sci. 3(1):26. doi: 10.3390/urbansci3010026.
- Agyemang FS, Silva E. 2019. Simulating the urban growth of a predominantly informal Ghanaian city-region with a cellular automata model: implications for urban planning and policy. Appl Geogr. 105:15–24. doi: 10.1016/j.apgeog.2019.02.011.
- Aliani H, Malmir M, Sourodi M, Sourodi M, Kafaky SB. 2019. Change detection and prediction of urban land use changes by CA–Markov model (case study: Talesh County). Environ Earth Sci. 78(17):546–558. doi: 10.1007/s12665-019-8557-9.
- Amini S, Saber M, Rabiei-Dastjerdi H, Homayouni S. 2022. Urban land use and land cover change analysis using random forest classification of landsat time series. Remote Sens. 14(11):2654. doi: 10.3390/rs14112654.
- Anand J, Gosain AK, Khosa R. 2018. Prediction of land use changes based on Land Change Modeler and attribution of changes in the water balance of Ganga basin to land use change using the SWAT model. Sci Total Environ. 644:503–519. doi: 10.1016/j.scitotenv.2018.07.017.
- Angel S. 2011. Making room for a planet of cities. Cambridge, MA: lincoln Institute of Land Policy. PP. p. 1–72.
- Arsanjani JJ, Helbich M, Kainz W, Boloorani AD. 2013. Integration of logistic regression, Markov chain and cellular automata models to simulate urban expansion. Int J Appl Earth Obs Geoinf. 21:265–275. doi: 10.1016/j.jag.2011.12.014.
- Asif M, Kazmi JH, Tariq A, Zhao N, Guluzade R, Soufan W, Almutairi KF, Sabagh AE, Aslam M. 2023. Modeling of Land use and land cover changes and predictions using CA-Markov chain and Random Forest. Geocarto Int. 38(1):1–21. doi: 10.1080/10106049.2023.2210532.
- Azari M, Billa L, Chan A. 2022. Multi-temporal analysis of past and future land cover change in the highly urbanized state of Selangor, Malaysia. Ecol Process. 11(1):1–15. doi: 10.1186/s13717-021-00350-0.
- Baig MF, Mustafa MRU, Baig I, Takaijudin HB, Zeshan MT. 2022. Assessment of land use land cover changes and future predictions using CA-ANN simulation for Selangor, Malaysia. Water. 14(3):402. doi: 10.3390/w14030402.
- Bajracharya P, Sultana S. 2022. Examining the use of urban growth boundary for Future Urban Expansion of Chattogram, Bangladesh. Sustainability. 14(9):5546. doi: 10.3390/su14095546.
- Barthel S, Parker J, Ernstson H. 2015. Food and green space in cities: a resilience lens on gardens and urban environmental movements. Urban Stud. 52(7):1321–1338. doi: 10.1177/0042098012472744.
- Central Statistical Authority (CSA). 2013. Summaries and statistical report on population and housing census result in the Addis Ababa. Ethiopia.
- Chander G, Markham BL, Helder DL. 2009. Summary of current radiometric calibrations coefficient for Landsat MSS, TM, ETM + and EO-1 ALI sensors. Remote Sens Environ. 113(5):893–903. doi: 10.1016/j.rse.2009.01.007.
- Chen Y, Chen Z, Guo D, Zhao Z, Lin T, Zhang C. 2022. Underground space use of urban built-up areas in the central city of Nanjing: insight based on a dynamic population distribution. Underground Space. 7(5):748–766. doi: 10.1016/j.undsp.2021.12.006.
- Chen Y, Li X, Liu X, Ai B. 2014. Modeling urban land-use dynamics in a fast developing city using the modified logistic cellular automaton with a patchbased simulation strategy. Int J Geograph Inform Sci. 28(2):234–255. doi: 10.1080/13658816.2013.831868.
- Cheng J, Masser I. 2003. Urban growth pattern modeling: a case study of Wuhan city, PR. China. Landscape Urban Plann. 62(4):199–217. doi: 10.1016/S0169-2046(02)00150-0.
- Chima CI, Trodd N, Blackett M. 2018. Assessment of Nigeriasat-1 satellite data for urban land use/land cover analysis using object-based image analysis in Abuja, Nigeria. Geocarto Int. 33(9):893–911. doi: 10.1080/10106049.2017.1316778.
- Dadi D, Azadi H, Senbeta F, Abebe K, Taheri F, Stellmacher T. 2016. Urban sprawl and its impacts on land use change in Central Ethiopia. Urban Forestry Urban Greening. 16:132–141. doi: 10.1016/j.ufug.2016.02.005.
- Deribew KT. 2019. Spatially explicit statistical modeling of random and systematic land cover transitions in Nech Sar national park. Ecol Process. 8(1):1–20. doi: 10.1186/s13717-019-0199-z.
- Deribew KT. 2020. Spatiotemporal analysis of urban growth on forest and agricultural land using geospatial techniques and Shannon entropy method in the satellite town of Ethiopia, the western fringe of Addis Ababa city. Ecol Process. 9(1):1–12. doi: 10.1186/s13717-020-00248-3.
- Deribew KT, Dalacho DW. 2019. Land use and forest cover dynamics in Northeastern Addis Ababa, central highlands of Ethiopia. Environ Syst Res. 8(1):1–18. doi: 10.1186/s40068-019-0137-1.
- Enoguanbhor EC, Gollnow F, Walker BB, Nielsen JO, Lakes T. 2022. Simulating urban land expansion in the context of land use planning in the Abuja City-Region, Nigeria. GeoJournal. 87(3):1479–1497. doi: 10.1007/s10708-020-10317-x.
- Fitawok MB, Derudder B, Minale AS, Van Passel S, Adgo E, Nyssen J. 2020. Modeling the impact of urbanization on land-use change in Bahir Dar City, Ethiopia: an integrated cellular Automata–Markov chain approach. Land. 9(4):115. doi: 10.3390/land9040115.
- Fu X, Wang X, Yang YJ. 2018. Deriving suitability factors for CA-Markov land use simulation model based on local historical data. J Environ Manage. 206:10–19. doi: 10.1016/j.jenvman.2017.10.012.
- Gharaibeh A, Shaamala A, Obeidat R, Al-Kofahi S. 2020. Improving land-use change modeling by integrating ANN with cellular Automata-Markov Chain model. Heliyon. 6(9):e05092. doi: 10.1016/j.heliyon.2020.e05092.
- Guan D, Li H, Inohae T, Su W, Nagaie T, Hokao K. 2011. Modeling urban land-use change by the integration of cellular Automaton and Markov model. Ecol. Model. 222(20-22):3761–3772. doi: 10.1016/j.ecolmodel.2011.09.009.
- Guo B, Wang Y, Zhou H, Hu F. 2022. Can environmental tax reform promote carbon abatement of resource-based cities? Evidence from a quasi-natural experiment in China. Environ Sci Pollut Res. doi: 10.1007/s11356-022-23669-3.
- He H, Tuo S, Lei K, Gao A. 2023. Assessing quality tourism development in China: an analysis based on the degree of mismatch and its influencing factors. Environ Dev Sustain. doi: 10.1007/s10668-023-03107-1.
- Huang S, Lyu Y, Sha H, Xiu L. 2021a. Seismic performance assessment of unsaturated soil slope in different groundwater levels. Landslides. 18(8):2813–2833. doi: 10.1007/s10346-021-01674-w.
- Huang X, Xu G, Xiao F. 2021b. Optimization of a novel urban growth simulation model integrating an artificial fish swarm algorithm and cellular automata for a smart city. Sustainability. 13(4):2338. doi: 10.3390/su13042338.
- Isinkaralar O, Varol C. 2023. A cellular automata-based approach for spatio-temporal modeling of the city center as a complex system: the case of Kastamonu, Türkiye. Cities. 132:104073. doi: 10.1016/j.cities.2022.104073.
- Isinkaralar O, Varol C, Yilmaz D. 2022. Digital mapping and predicting the urban growth: integrating scenarios into cellular automata—Markov chain modeling. Appl Geomat. 14(4):695–705. doi: 10.1007/s12518-022-00464-w.
- Istanbullu SN, Sevik H, Isinkaralar K, Isinkaralar O. 2023. Spatial distribution of heavy metal contamination in road dust samples from an urban environment in Samsun, Türkiye. Bull Environ Contam Toxicol. 110(4):78. doi: 10.1007/s00128-023-03720-w.
- Kamusoko C, Aniya M, Adi B, Manjoro M. 2009. Rural sustainability under threat in Zimbabwe—Simulation of future land use/cover changes in the Bindura district based on the Markov-cellular automata model. Appl Geogr. 29(3):435–447. doi: 10.1016/j.apgeog.2008.10.002.
- Kantakumar LN, Kumar S, Schneider K. 2016. Spatiotemporal urban expansion in Pune metropolis, India using remote sensing. Habitat Int. 51:11–22. doi: 10.1016/j.habitatint.2015.10.007.
- Karimi F, Sultana S, Babakan AS, Suthaharan S. 2019. An enhanced support vector machine model for urban expansion prediction. Comput Environ Urban Syst. 75:61–75. doi: 10.1016/j.compenvurbsys.2019.01.001.
- Karolien V, Maarten L, Eria S, Paul M. 2012. Urban growth of Kampala, Uganda: pattern analysis and scenario development. Landscape Urban Plan. 106(3):199–206. doi: 10.1016/j.landurbplan.2012.03.006.
- Ke X, Vliet J, Zhou T, Verburg PH, Zheng W, Liu X. 2018. Direct and indirect loss of natural habitat due to built-up area expansion: a model-based analysis for the city of Wuhan, China. Land Use Policy. 74:231–239. doi: 10.1016/j.landusepol.2017.12.048.
- Kimutai DK, Watanabe T. 2016. Forst-Cover change and participatory forest management of the Lambus forest, Kenya. Environments. 3(4):20. doi: 10.3390/environments3030020.
- Koroso NH, Lengoiboni ML, Zevenbergen JA. 2021. Urbanizatiomn and urban land use efficiency: evidence from regional and Addis Ababa satellite cities, Ethiopia. Habitat Int. 117(102437):102437. doi: 10.1016/j.habitatint.2021.102437.
- Lakshmi N, Kantakumar SK, Schneider K. 2019. SUSM: a scenario-based urban growth simulation model using remote sensing data. Eur J Remote Sens. 52(sup2):26–41. doi: 10.1080/22797254.2019.1585209.
- Li C, Liu M, Hu Y, Shi T, Qu X, Walter MT. 2018. Effects of urbanization on direct runoff characteristics in urban functional zones. Sci Total Environ. 643:301–311. doi: 10.1016/j.scitotenv.2018.06.211.
- Li X, Zhang X, Jia T. 2023. Humanization of nature: testing the influences of urban park characteristics and psychological factors on collegers’ perceived restoration. Urban Forestry Urban Greening. 79:127806. doi: 10.1016/j.ufug.2022.127806.
- Li X, Zhou Y, Chen W. 2020. An improved urban cellular automata model by using the trend-adjusted neighborhood. Ecol Process. 9(1):2–13. doi: 10.1186/s13717-020-00234-9.
- Li Z, Gurgel H, Li M, Dessay N, Gong P. 2022. Urban land expansion from scratch to urban agglomeration in the Federal District of Brazil in the Past 60 Years. IJERPH. 19(3):1032. doi: 10.3390/ijerph19031032.
- Lin X, Lu K, Hardison AK, Liu Z, Xu X, Gao D, Gong J, Gardner WS. 2021. Membrane inlet mass spectrometry method (REOX/MIMS) to measure 15N-nitrate in isotope-enrichment experiments. Ecol Indic. 126:107639. doi: 10.1016/j.ecolind.2021.107639.
- Linard C, Tatem AJ, Gilbert M. 2013. Modelling spatial patterns of urban growth in Africa. Appl Geogr. 44:23–32. doi: 10.1016/j.apgeog.2013.07.009.
- Liu W, Xu J, Li J, Li S. 2019. Rural households’ poverty and relocation and settlements: evidence from Western China. Int J Environ Res Public Health. 16(2609):1–17. doi: 10.3390/ijerph16142609.
- Liu Z, Xu J, Liu M, Yin Z, Liu X, Yin L, Zheng W. 2023. Remote sensing and geostatistics in urban water-resource monitoring: a review. Mar Freshw Res. 74(10):747–765. doi: 10.1071/MF22167.
- Lu Q, Chang NB, Joyce J, Chen AS, Savic DA, Djordjevic S, Fu G. 2018. Exploring the potential climate change impact on urban growth in London by a cellular automata-based Markov chain model. Comput Environ Urban Syst. 68:121–132. doi: 10.1016/j.compenvurbsys.2017.11.006.
- Mansour S, Ghoneim E, El-Kersh A, Said S, Abdelnaby S. 2023. Spatiotemporal monitoring of UrbanSprawl in a coastal city using GIS-based Markov chain and artificial neural network (ANN). Remote Sens. 15(3):601. doi: 10.3390/rs15030601.
- Minta M, Kibret K, Thorne P, Nigussie T, Nigatu L. 2018. Land use and land cover dynamics in Dendi-Jeldu hilly-mountainous areas in the Central Ethiopian highlands. Geoderma. 314:27–36. doi: 10.1016/j.geoderma.2017.10.035.
- Moghadam HS, Helbich M. 2013. Spatiotemporal urbanization processes in the megacity of Mumbai, India: a Markov chains-cellular automata urban growth model. Appl Geogr. 40:140–149. doi: 10.1016/j.apgeog.2013.01.009.
- Moisa MB, Dejene IN, Roba ZR, Gemeda DO. 2022. Impact of urban land use and land cover change on urban heat island and urban thermal comfort level: a case study of Addis Ababa City, Ethiopia. Environ Monit Assess. 194(10):736. doi: 10.1007/s10661-022-10414-z.
- Mostafa E, Li X, Sadek M. 2023. Urbanization trends analysis using hybrid modeling of fuzzy analytical hierarchical process-cellular Automata-Markov chain and investigating its impact on land surface temperature over Gharbia City, Egypt. Remote Sens. 15(3):843. doi: 10.3390/rs15030843.
- Mundia CN, Aniya M. 2005. Analysis of land use/cover changes and urban expansion of Nairobi city using remote sensing and GIS. Int J Remote Sens. 26(13):2831–2849. doi: 10.1080/01431160500117865.
- Natarajan S, Kumar N, Stalin L. 2019. Assessment of urban growth using Shannon’s Entropy Index: a case study of Chennai, Detroit of India. JANS. 11(2):281–284. doi: 10.31018/jans.v11i2.2037.
- Nor ANM, Corstanje R, Harris JA, Brewer T. 2017. Impact of rapid urban expansion on green space structure. Ecol Indic. 81:274–284. doi: 10.1016/j.ecolind.2017.05.031.
- Pontius RG, Boersma W, Castella J-C, Clarke K, de Nijs T, Dietzel C, Duan Z, Fotsing E, Goldstein N, Kok K, et al. 2008. Comparing the input, output, and validation maps for several models of land change. Ann Reg Sci. 42(1):11–37. doi: 10.1007/s00168-007-0138-2.
- Puyravaud J. 2003. Standardizing the classification of the annual rate of deforestation. Forest EcolManag. 177(1-3):593–596. doi: 10.1016/S0378-1127(02)00335-3.
- Regassa B, Kassaw M, Bagyaraj M. 2020. Analysis of urban expansion and modeling of LULC changes using geospatial techniques: the case of Adama City. Remote Sens Land. 4(1-2):40–58. doi: 10.21523/gcj1.20040104.
- Rimal B, Zhang L, Keshtkar H, Wang N, Lin Y. 2017. Monitoring and modeling of spatiotemporal urban expansion and land-use/land-cover change using integrated Markov chain cellular automata model. IJGI. 6(9):288. doi: 10.3390/ijgi6090288.
- Rufino I, Djordjevi ’C, Costa S, de Brito H, Alves PBR. 2021. Multi-temporal built-up grids of Brazilian cities: how trends and dynamic modelling could help on resilience challenges? Sustainability. 13(2):748. doi: 10.3390/su13020748.
- Saxena A, Jat MK. 2019. Capturing heterogeneous urban growth using SLEUTH model. Rem. Sens. Appl. Soc Environ. 13:426–434. doi: 10.1016/j.rsase.2018.12.012.
- Seto KC, Sánchez-Rodríguez R, Fragkias M. 2010. The new geography of contemporary urbanization and the environment. Annu Rev Environ Resour. 35(1):167–194. doi: 10.1146/annurev-environ-100809-125336.
- Shang Y, Zhu L, Qian F, Xie Y. 2023. Role of green finance in renewable energy development in the tourism sector. Renew Energy. 206:890–896. doi: 10.1016/j.renene.2023.02.124.
- Shi Y, Zhou L, Guo X, Li J. 2023. The multidimensional measurement method of urban sprawl and its empirical analysis in Shanghai metropolitan area. Sustainability. 15(2):1020. doi: 10.3390/su15021020.
- Sing B. 2014. Urban growth using Shannon’s entropy: a case study of Rohtak City. Int J Adv Remote Sens GIS. 3(1):544–552. http://technical.cloud-journals.com/index.php/IJARSG/article/view/Tech-237.
- Ssekandi J, Mburu J, Wasonga O, Macopiyo L, Charles F. 2017. Effects of post eviction resettlement on land-use and cover change in Uganda’s oil exploration areas. JEP. 08(10):1144–1157. doi: 10.4236/jep.2017.810072.
- Sudhira HS, Ramachandra TV, Jagadish KS. 2004. Urban sprawl: metrics dynamics and modeling using GIS. Int J Appl Earth Obs Geoinf. 5(1):29–39. doi: 10.1016/j.jag.2003.08.002.
- Tariq A, Yan J, Mumtaz F. 2022. Land change modeler and CA-Markov chain analysis for land use land cover change using satellite data of Peshawar, Pakistan. Phys Chem Earth Parts A/B/C. 128:103286. doi: 10.1016/j.pce.2022.103286.
- Tariq A, Mumtaz F (. 2023. Modeling spatio-temporal assessment of land use land cover of Lahore and its impact on land surface temperature using multi-spectral remote sensing data. Environ Sci Pollut Res Int. 30(9):23908–23924. doi: 10.1007/s11356-022-23928-3.
- Terfa BK, Chen N, Liu D, Zhang X, Niyogi D. 2019. Urban expansion in Ethiopia from 1987-2017: characteristics, spatial patterns, and driving forces. Sustainability. 11(10):2973. doi: 10.3390/su11102973.
- Tian P, Liu Y, Li J, Pu R, Cao L, Zhang H. 2023. Spatiotemporal patterns of urban expansion and trade-offs and synergies among ecosystem services in urban agglomerations of China. Ecol Indic. 148:110057. doi: 10.1016/j.ecolind.2023.110057.
- United Nations. 2016. The world’s cities in 2016 – data booklet. Department of Economic and Social Affairs, Population Division. http://www.un.org/en/development/desa/population/publica tions/pdf/urbanization/the_worlds_cities_in_2016_data_booklet.pdf.
- Usman K, Deribew KT, Alemu G, Hailu S. 2023. Spatial modeling of soil loss as a response to land use-land cover change in Didessa sub-basin, the agricultural watershed of Ethiopia. Heliyon. 9(3):e14590. doi: 10.1016/j.heliyon.2023.e14590.
- Wakode BH, Baier K, Jha R, Azzam R. 2014. Analysis of urban growth using Landsat TM/ETM data and GIS- a case study of Hyderabad, India. Arab J Geosci. 7(1):109–121. doi: 10.1007/s12517-013-0843-3.
- Wang P, Yu P, Lu J, Zhang Y. 2022b. The mediation effect of land surface temperature in the relationship between land use-cover change and energy consumption under seasonal variations. J Cleaner Prod. 340:130804. doi: 10.1016/j.jclepro.2022.130804.
- Wang Y, Chen F, Wei F, Yang M, Gu X, Sun Q, Wang X. 2023. Spatial and temporal characteristics and evolutionary prediction of urban health development efficiency in China: based on super-efficiency SBM model and spatial Markov chain model. Ecol Indic. 147:109985. doi: 10.1016/j.ecolind.2023.109985.
- Wang Y, Henning S, Poulain L, Lu C, Stratmann F, Wang Y, Niu S, Pöhlker ML, Herrmann H, Wiedensohler A. 2022a. Aerosol activation characteristics and prediction at the central European ACTRIS research station of Melpitz, Germany. Atmos Chem Phys. 22(24):15943–15962. doi: 10.5194/acp-22-15943-2022.
- Weng Q. 2001. A remote sensing? GIS evaluation of urban expansion and its impact on the surface temperature in the Zhujiang Delta, China. Int J Rem Sens. 22(10):1999–2014. doi: 10.1080/713860788.
- Wu B, Quan Q, Yang S, Dong Y. 2023. A social-ecological coupling model for evaluating the human-water relationship in basins within the Budyko framework. J Hydrol. 619:129361. doi: 10.1016/j.jhydrol.2023.129361.
- Xian G, Crane M. 2005. Assessments of urban growth in the Tampa Bay watershed using remote sensing data. Rem Sens Environ. 97(2):203–215. doi: 10.1016/j.rse.2005.04.017.
- Xie X, Jin X, Wei G, Chang C. 2023. Monitoring and early warning of SMEs’ shutdown risk under the impact of global pandemic shock. Systems. 11(5):260. doi: 10.3390/systems11050260.
- Xing Z, Huang J, Wang J. 2023. Unleashing the potential: exploring the nexus between low-carbon digital economy and regional economic-social development in China. J Cleaner Prod. 413:137552. doi: 10.1016/j.jclepro.2023.137552.
- Xu D, Zhu D, Deng Y, Sun Q, Ma J, Liu F. 2023. Evaluation and empirical study of Happy River on the basis of AHP: a case study of Shaoxing City (Zhejiang, China). Mar Freshw Res. 74(10):838–850. doi: 10.1071/MF22196.
- Yadeta T, Deribew KT, Getahun K, Debesa G, Abreha G, Hailu S. 2022. Recent resettlement programs, as drivers for Afromontane forest loss in the Hawa-Galan district of Ethiopia. Cogent Social Sci. 8(1):1–19. doi: 10.1080/23311886.2022.2088462.
- Yang J, Fu L-Y, Zhang Y, Han T. 2022. Temperature- and pressure-dependent pore microstructures using static and dynamic moduli and their correlation. Rock Mech Rock Eng. 55(7):4073–4092. doi: 10.1007/s00603-022-02829-4.
- Yin L, Wang L, Tian J, Yin Z, Liu M, Zheng W. 2023. Atmospheric density inversion based on Swarm-C satellite accelerometer. Appl Sci. 13(6):3610. doi: 10.3390/app13063610.
- Yuan F, Sawaya KE, Loeffelholz BC, Bauer ME. 2005. Land cover classifcation and change analysis of the twin cities (Minnesota) metropolitan area by multitemporal Landsat remote sensing. Remote Sens Environ. 98(2-3):317–328. doi: 10.1016/j.rse.2005.08.006.
- Yuan L, Wu X, He W, Degefu DM, Kong Y, Yang Y, Xu S, Ramsey TS. 2023. Utilizing the strategic concession behavior in a bargaining game for optimal allocation of water in a transboundary river basin during water bankruptcy. Environ Impact Assess Rev. 102:107162. doi: 10.1016/j.eiar.2023.107162.
- Yue Z, Zhou W, Li T. 2021. Impact of the Indian Ocean dipole on evolution of the subsequent ENSO: relative roles of dynamic and thermodynamic processes. J Climate. 34(9):3591–3607. doi: 10.1175/JCLI-D-20-0487.1.
- Zhang D, Liu X, Wu X, Yao Y, Wu X, Chen Y. 2019. Multiple intra-urban land-use simulations and driving factors analysis: a case study in Huicheng, China. GIScience Remote Sens. 56(2):282–308. doi: 10.1080/15481603.2018.1507074.
- Zhang L, Shu X, Zhang L. 2023a. Urban Sprawal and its multidimensional and multiscale measurement. Land. 12(3):630. doi: 10.3390/land12030630.
- Zhang M, Kafy A-A, Xiao P, Han S, Zou S, Saha M, Zhang C, Tan S. 2023b. Impact of urban expansion on land surface temperature and carbon emissions using machine learning algorithms in Wuhan, China. Urban Clim. 47:101347. doi: 10.1016/j.uclim.2022.101347.
- Zhang M, Li Y, Guo R, Yan Y. 2022. Heterogeneous effects of urban sprawl on economic development: empirical evidence from China. Sustainability. 14(3):1582. doi: 10.3390/su14031582.
- Zhao M, Zhou Y, Li X, Cheng W, Zhou C, Ma T, Li M, Huang K. 2020. Mapping urban dynamics (1992–2018) in Southeast Asia using consistent nighttime light data from DMSP and VIIRS. Remote Sens Environ. 248:111980. doi: 10.1016/j.rse.2020.111980.
- Zhou C, Zheng H, Wan S. 2023. Industrial structure, employment structure and economic growth evidence from China. Sustainability. 15(4):2890. doi: 10.3390/su15042890.
- Zhou G, Song B, Liang P, Xu J, Yue T. 2022. Voids filling of DEM with multiattention generative adversarial network model. Remote Sens. 14(5):1206. doi: 10.3390/rs14051206.
- Zhou G, Zhou X, Song Y, Xie D, Wang L, Yan G, Hu M, Liu B, Shang W, Gong C, et al. 2021. Design of supercontinuum laser hyperspectral light detection and ranging (LiDAR) (SCLaHS LiDAR). Int J Remote Sens. 42(10):3731–3755. doi: 10.1080/01431161.2021.1880662.
- Zhu X, Xu Z, Liu Z, Liu M, Yin Z, Yin L, Zheng W. 2022. Impact of dam construction on precipitation: a regional perspective. Mar Freshw Res. 74(10):877–890. doi: 10.1071/MF22135.