
 ?Mathematical formulae have been encoded as MathML and are displayed in this HTML version using MathJax in order to improve their display. Uncheck the box to turn MathJax off. This feature requires Javascript. Click on a formula to zoom.
Abstract
Hailstorms have increased in frequency and intensity over the past decade causing substantial losses in agriculture. Since hailstorms often hit a wide area with no detectable pattern, relying on traditional field-based methods to assess crop damage is difficult. The aim of this study was to develop and test a new four-stage normalized vegetation index approach for detecting the severity of hailstorm damage on sugarcane plants in a large estate in south eastern Zimbabwe. The following six spectral indices were computed for the period before and after a hailstorm event to assess the extent of hailstorm damage on sugarcane: Green Chlorophyll Index (GCI); Normalized Difference Vegetation Index (NDVI); Normalized Difference Senescent Vegetation Index (NDSVI); Red Edge Chlorophyll Index (RECI); Normalized Difference Tillage Index (NDTI); and Modified Soil Adjusted Vegetation Index (MSAVI2). Then, the spectral differences were computed for each index separately and the difference maps are reported as delta (Δ) indices. The results of this study show that within one week and even two weeks after a hailstorm, ΔNDTI, ΔNDVI and ΔRECI were consistently able to detect and characterise the severity of sugarcane damage. When used in partial least squares-discriminant analysis (PLS-DA), ΔNDTI performed best in mapping the severity of crop damage throughout the large estate. ΔNDTI was able to discriminate three different levels of sugarcane damage with an overall accuracy of 90% and a Kappa value of 0.85. Combined these results imply that ΔNDTI computed using multi-spectral datasets within a fortnight after a hailstorm is a promising tool for generating reliable information about the severity of sugarcane damage by hailstorms. Such spatially explicit information is useful for creating customised crop insurance packages sensitive to damage incurred by the farmer.
1. Introduction
Hailstorms are characterised by large irregular ice clumps formed in convective clouds (Changnon and Kunkel Citation2006). These hailstorms cause substantial damage to crops, infrastructure, and in extreme cases loss of human life (Raupach et al. Citation2021). For example, in the United States of America, annual economic losses due to crop damage by hailstorms have been estimated to range between USD161.4 million and USD 914.6 million (Tang et al. Citation2019). In Canada, the total annual agricultural loss emanating from hailstorms is estimated at USD150 million (Ha et al. Citation2022). While the estimates of economic losses for other regions are not readily available, it has been reported that both the frequency and intensity of hailstorms has significantly increased in recent decades due to climate change (Schillaci et al. Citation2022). Of great concern is the observation that climate models predict that both severity and frequency will increase in most regions (Browning Citation1977; Choudhary et al., Citation2022). Specifically, annual hailstorm damage to agriculture is projected to increase by 25% to 48% under moderate and warm climate change scenarios (Raupach et al. Citation2021). In this regard, the agricultural sector needs to better anticipate these events and incorporate effective strategies to cope with hailstorm damage. The availability of timely spatial information on the extent and severity of hailstorm damage to crops is critical for implementation of effective measures to minimise yield loss.
Assessing yield losses due to hailstorms is a challenge in crops as responses vary depending on the intensity of the storm, the age of the plants, the variety, and the time of year (Adams-Selin and Ziegler Citation2016; Childs et al. Citation2020). Hailstorms often hit a wide area with no particular pattern. This makes assessing damage to crops by hailstorms using traditional methods time consuming, subjective, and difficult to implement at large spatial scales, especially if the status of the crop before the event is unknown (Peters et al. Citation2000; Gobbo et al. Citation2021). As a result, few studies have quantified the severity of physical damage to crops caused by hailstorms despite the importance of such information for crop insurance and mitigation measures. Thus, there is need to develop methods that are rapid and applicable at large spatial scales to enable fast interventions in areas affected by hailstorms. Remote sensing provides a viable alternative for detecting and assessing crop damage arising from hailstorm due to its wide and repetitive coverage (Peters et al. Citation2000; Wójtowicz et al. Citation2016; Gobbo et al. Citation2021). The added advantage of using remote sensing is that data can be collected in different spectral bands by different sensors (Kuri et al. Citation2014). This enhances the information content of the imagery making it possible to obtain reliable information on the status of the crop before and after a hailstorm event.
Hailstorms cause defoliation of vegetation, leading to abrupt changes in plant processes and plant appearance (Petoumenou et al. Citation2019). This in turn, changes the spectral reflectance of the crop which is detected by remote sensors (Peters et al. Citation2000; Klemas Citation2009; Sosa et al. Citation2021). This is not only limited to hailstorm damage but all forms of natural disasters that cause plant stress. Multispectral imagery from remote sensing satellites have also been used to assess damage caused by floods (Yu et al. Citation2013; Rahman et al. Citation2021). A study in Nebraska showed that multispectral imagery and close-range hyperspectral data accurately detected the area of hail damage and the severity in maize and soybeans (Peters et al. Citation2000). In China, remotely sensed data was used to quantify area damaged by hailstorm and the severity of damage with overall accuracy and Kappa coefficient of 86% and 0.78, respectively (Zhao et al. Citation2012). Sosa et al. (Citation2021) proposed a machine learning algorithm for accurate and transparent detection of homogeneous hail damage zones using satellite data. Similarly, Singh et al. (Citation2017) developed an empirical model for estimating yield losses as a result of hail damage, based on wheat yield and NDVI. In another study, Schillaci et al. (Citation2022) observed that the Modified Soil-Adjusted Vegetation Index (MSAVI) had the highest accuracy (73.3%) in detecting hail-related damage relative to NDVI, Atmospherically Resistant Vegetation Index (ARVI), Modified Chlorophyll Absorption in Reflectance Index (MCARI), Soil-Adjusted Vegetation Index (SAVI) and Modified Soil Adjusted Vegetation Index (MSAVI2). Although these studies have demonstrated the utility of remotely sensed data in estimating crop damage across a number of agricultural landscapes, surprisingly, there is paucity of information on hailstorm damage in agricultural landscapes of Zimbabwe. This is despite the recurrence of hailstorms in the country and the attendant damage.
As mentioned above, there are various studies that have been conducted on assessing crop damage using remotely sensed data. However, to the best of our knowledge, there is no study that has focused on assessing hailstorm damage on sugarcane in the country. This study applies remotely sensed data to estimate hailstorm damage to sugarcane (Saccharum officinarum) - a tropical warm season grass widely grown as the chief source of sugar. Specifically, different spectral indices that are sensitive to minute changes in crop health and soil properties were selected for analysis. The Green Chlorophyll Index (GCI), Normalized Difference Vegetation Index (NDVI), Normalized Difference Senescent Vegetation Index (NDSVI) and Red Edge Chlorophyll Index (RECI) are well known for their response to changes in the amount of vegetation biomass as a result of changes in crop vigour and chlorophyll content, whereas Normalized Difference Tillage Index (NDTI) and MSAVI2 are sensitive to soil background effects and wetness change. To the authors’ knowledge, no study has compared the performance of different multispectral images in detecting hail-related damage on sugarcane. The aim of this study is to develop a comparable novel normalized four-stage vegetation index (VIs) approach for detecting the severity of hailstorm damage on sugarcane using spectral response. Information on hectarage of crop affected, severity of damage and estimated yield losses critical for crop insurance and payment of premiums.
The rest of the manuscript is organised as follows; Section 2 describes the study area, field and remotely sensed data used in the study. Section 3 is dedicated to approaches adopted in the analysis of the data while Section 4 present the results. The fifth section of the paper outlines the important findings of the study focusing on the interpretation, implication and novelty of the study. The last section provides key conclusions of the study and proffers some recommendations for future research.
2. Materials and methods
2.1. Study area
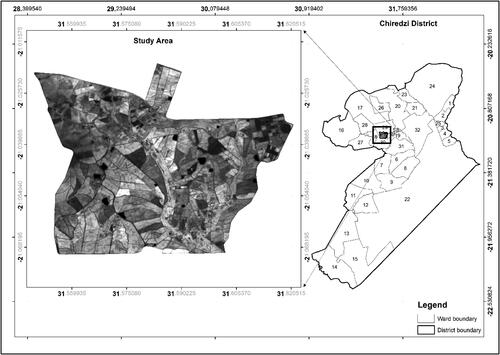
The South Eastern Lowveld is the only sugarcane producing area in Zimbabwe and hosts ≈50 000 ha of sugarcane. The Hippo Valley and Buffalo Range sugarcane estates located between 21° 1'10.28”S to 21° 4'10.93”S latitude and 31°32'59.18”E to 31°36'9.07”E longitude were selected for the study (). The study area is located in Natural Region V which usually receives less than 500 mm of rainfall per annum and has an average temperature of 22.5 °C. The area is prone to erratic rainfall, frequent drought, and extended dry spells even during the rainfall season.
Figure 1. Map of the study area showing the location of Hippo Valley Estate in the administrative district of Chiredzi in Zimbabwe.
2.2. Data
2.2.1. Field data
Chiredzi District experienced a hailstorm coupled with heavy winds on the 31st of December 2021 between 5 and 6 pm. Data from an Automatic Weather Station located within 10 km radium showed that the maximum windspeed during that period was 79 km hr−1 which is described as a strong gale according to the Beaufort wind force scale (https://www.rmets.org/metmatters/beaufort-wind-scale). The weather station does not have capacity to measure hail, but reports from local farmers stated that the hail balls ranged from the size of a single grape to the size of a tennis ball. The hailstorm event caused physical damage to crops, buildings, vehicles, and natural vegetation.
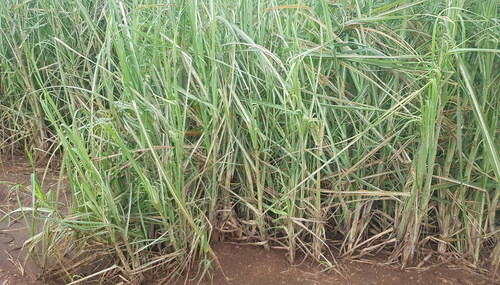
To assess damage to sugarcane crops, field surveys were conducted between 5 and 7 January 2022. Field coordinates were collected using GPSMAP 62S Handheld GPS Navigator (Garmin, USA) with an accuracy of <5 m while the severity of damage was visually assessed. Firstly, three quadrants measuring 1 m × 1 m were randomly selected in each field, and the plants were individually assessed for defoliation and stem damage. Quadrants where 50% of the plants had 50% or more of the crop leaves still intact, showing no visible signs of damage and still capable of photosynthesis were considered ‘moderately damaged’. Where more than 50% of plant leaves were damaged or shredded and/or where the stem was broken, the field was considered ‘severely damaged’. A total of 49 control fields (‘not damaged’) with cane that was not damaged were selected within a 10 km radius in the hail-stricken area. A total of 96 points were sampled with 49 points identified as ‘not damaged’ while 23 and 24 points were classified as ‘moderately damaged’ and ‘severely damaged’, respectively ().
Plate 1. Example of moderately damaged 7 months old cane.
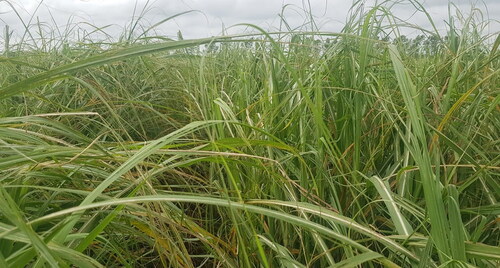
Plate 2. Example of severely damaged field with 5 months old cane.
2.2.2. Remotely sensed data
In this study, Sentinel-2 Multispectral Instrument (MSI) images acquired between 27 December 2021 and 16 January 2022 were used to assess hailstorm damage on sugarcane plants. Sentinel-2 covers 13 spectral bands ranging from 443 nm to 2 190 nm (https://sentinel.esa.int/web/sentinel/missions/sentinel-2). Google Earth Engine (GEE) platform was used to select the surface reflectance of Sentinel-2 data with no to low cloud cover of less than 30%. Furthermore, with the use of GEE, six spectral bands mainly in the visible, near-infrared, red edge and shortwave infrared regions were selected to map hailstorm damage. provides details on the sensor characteristics and important parameters of the spectral bands used in this study. Various image processing techniques such as masking of cloud and shadows, extraction of a region of interest, resampling of bands from 20 m to 10 m spatial resolution, calculation of vegetation indices as well as extraction of images for further analysis were all performed in GEE.
Table 1. Sentinel-2 MSI data and parameters and characteristics.
3. Data analysis
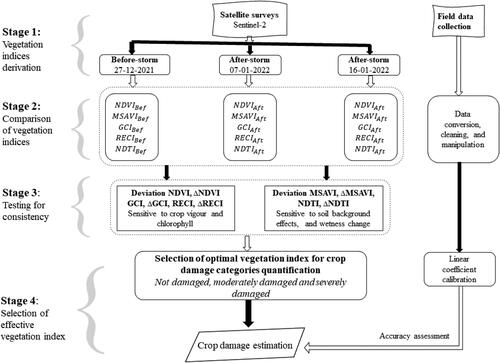
summarises the key steps followed in estimating extent of sugarcane damage emanating from the hailstorm that occurred on the 31st of December 2021. These steps included: (i) field data collection (remotely sensed data and field observations) and pre-processing (ii) index extraction, and (iii) time-series calculation and (iv) analysis.
Figure 2. A four-stage approach for detecting and mapping severity of crop damage by hailstorm.
3.1. Crop damage mapping with vegetation index from sentinel-2 MSI
In this study, changes in crop health status were used as an indicator and extent of sugarcane damage from hailstorm. Six vegetation indices namely GCI, NDVI, NDSVI, RECI, NDT and MSAVI () were calculated from six Sentinel-2 bands ranging from the visible region to short-wave infrared. These multiple vegetation indices were chosen due to their sensitivity to different vegetation characteristics such as water content, chlorophyll content, and foliar nitrogen concentration (Cho et al. Citation2008; Zheng et al. Citation2018; Mafuratidze et al. Citation2020; Mutowo et al. Citation2023; Muumbe et al. Citation2021; Susantoro et al. Citation2018). Silleos et al. (Citation2002) observed that, the response of a crop to various parts of the electromagnetic spectrum can be altered through several mechanisms. These include reduction in water, nitrogen and chlorophyll content, modifications in internal leaf structure, and shifts in the biophysical features of plants. Schillaci et al. (Citation2022) noted that by using spectral indices, many biophysical traits of crops can be quantified and simplified. In general, GCI, NDVI, RECI and NDSVI are well known for their response to changes in the amount of vegetation biomass, while NDTI and MSAVI2 are sensitive to soil background effects and wetness change.
Table 2. A Summary of Sentinel-2 vegetation spectral indices used to detect and map the severity of hailstorm damage severity.
3.2. Assessing crop damage using normalized four-stage vegetation indices
To assess changes in spectral reflectance of sugarcane as a result of the hailstorm, satellite image acquired on the 27th December 2021 was chosen as the base image i.e. the image before the hailstorm and these were then compared to images acquired after the hailstorm. Calculating and comparing the spectral indices of sugarcane before and after a hail event helps in detecting changes in sugarcane vigour through changes in water content, chlorophyll, content, or plant health in general (Ha et al. Citation2022). Crop damage estimation was determined by calculating the percentage of vegetation changes using vegetation indices (VI) before and after the hailstorm using the following equation:
(1)
(1)
Where, is the vegetation index before the hailstorm (hereafter
),
denotes vegetation index at seven days after the hailstorm while
represents Vegetation index calculated 16 days after the hailstorm. The deviation of the six vegetation indices namely ΔGCI, ΔNDVI, ΔNDSVI, ΔNDTI, ΔMSAVI and ΔRECI were calculated using the above formula (EquationEquation 1
(1)
(1) ). All computations of VIs were performed in GEE platform.
3.3. Hailstorm damage mapping using statistical analysis
To analyse the performance of each VI, we extracted vegetation index values and examined whether the proposed VI was sensitive to crop damage by hailstorm. We then tested the independence of these variables before examining each spectral VI classification capability based on damage severity categories using analysis of variance (ANOVA) and Partial Least-Squares Discriminant Analysis (PLS-DA) in MATLAB. The rationale for using both ANOVA and PLS-DA with similar properties was to check for consistency in the performance of the VIs. The four-step procedure was implemented to reduce redundancy among these vegetation indices since they are derived from similar bands (and sensitive to the same biochemical property), and to improve their discrimination ability. A threshold-based classification test was implemented to determine the classification capability of each spectral feature.
3.3.1. ANOVA
ANOVA was used to test whether differences exist between crop severity damage levels (that is, ‘not damaged’, ‘moderately damaged’ and ‘severely damaged’) detected using each VI. Once ANOVA confirmed that at least one of the means differed significantly from the others, post hoc analysis was carried out using an honest significant difference (HSD) Tukey test. p ≤ 0.05 was chosen as the critical level of significance.
3.3.2. Partial least-squares discriminant analysis
In this study, the PLS-DA algorithm was also used to determine whether and to what extent the six vegetation indices exhibited a significant relationship between the data matrix (X) and the response matrix (Y which contains class membership in a dummy matrix) (Wiberg Citation2001; Wiklund Citation2007; Chivasa et al. Citation2019). PLS-DA was considered ideal for highlighting the relationship between predictor and response variables in a robust and easy to interpret manner (Zontov et al. Citation2020). Available literature also indicates that PLS-DA is less vulnerable to multicollinearity and tends to achieve the highest prediction power. In other words, PLS-DA is able to handle correlated latent predictor variables and the response variable while balancing the predictive performance and reducing data dimensionality (Mountrakis et al. Citation2011). Formally, PLS-DA maximizes the covariance between latent predictor variables and the response variable using:
(2)
(2)
(3)
(3)
where X is the predictor matrix of spectral data, T is a factor score matrix of X, P′ is the X loading, E is the residual X, Y is a matrix of the categorical variable, U is the scores for Y, C′ is the Y loading and F is the residuals.
4. Results
4.1. Detection and mapping of sugarcane fields
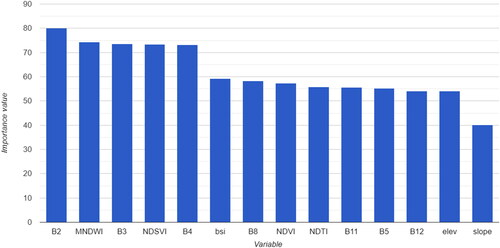
A combination of spectral bands and indices were used as input variables into a random forest algorithm to detect and map sugarcane fields. In total, 14 input variables were selected as follows: NDVI, NDSVI, NDTI, BSI, MNDWI, elevation, slope, visible bands (B2, B3 and B4), visible and near infrared bands (B5 and B8) and shortwave infrared bands (B11 and B12). A total of six classes (sugarcane fields, natural vegetation, water bodies, built-up area, fallow land and roads) were identified as shown in . From , it can be noted that B2, MNDWI and B3 contributed more to the classification, while B12, B5 and slope were the least contributors to the classification. The total area for sugarcane field is 1 721 ha from the classification done using random forest algorithm with an overall accuracy of 0.99 and kappa coefficient of 0.97.
Figure 3. Classified and validated landcover map of Hippo Valley Estate in Zimbabwe for December 2021.
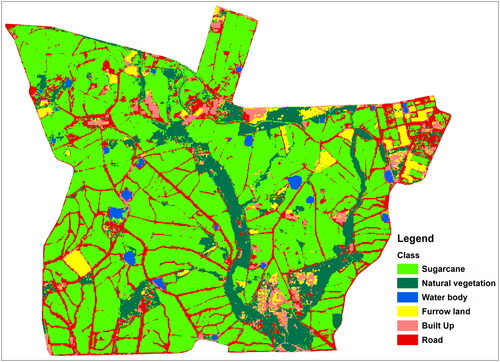
Figure 4. Variation in variable importance selected using random Forest algorithm.
4.2. Selection of appropriate vegetation indices for further analysis of crop damage
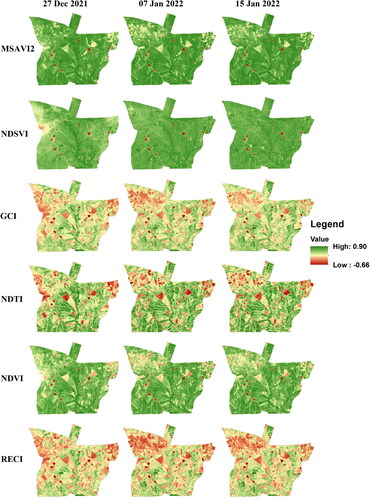
illustrates changes in the six multispectral VIs induced by the hailstorm on sugarcane plants in the study site. It can be observed that, there is a general decline across all the six vegetation indices in all damage categories except the control after the hailstorm. The maximum decline in multispectral VIs was observed in the ‘severely damaged’ category while the least decrease was recorded in the ‘moderately damaged’ category after the occurrence of the hailstorm. On the other hand, a general increase in the six spectral indices was observed in the control group between the 27th of December 2021 (occurrence of the hailstorm) and the 7th of January 2021. Thereafter, a minor decrease is observed across all the spectral indices except for RECI. Results of ANOVA illustrate that there are significant differences (p < 0.05) in multispectral VIs among the hailstorm damage categories across all the six vegetation indices considered.
Figure 5. Before and after hail event NDTI and NDSVI indices.
The results for the differences in crop damage categories within a week after the hailstorm () are presented in . It can be observed that when using VIs computed using the images acquired 4 days before and 7 days after the hailstorm at least one of the three damage categories differed from the others for all six delta vegetation indices. However, results of Tukey HSD post-comparison test indicate that the ‘not damaged’ and ‘moderately damaged’ categories did not differ significantly ΔMSAVI2. Likewise, for ΔNDSVI, no significant differences between the moderately and ‘severely damaged’ categories were detected (). By contrast, the results in indicate significant differences were detected among three damage categories for four indices, ΔGCI, ΔNDTI, ΔNDVI and ΔRECI.
Table 3. Differences and similarities in means for six delta vegetation indexes used to discriminate severity of hailstorm damage to sugarcane in Zimbabwe.
When analysed at (that is, 4 days before and 16 days after the hailstorm) results for ANOVA indicate at least one of the damage classes differed from the rest significantly for all six ΔVIs. However, pairwise comparisons based on Tukey HSD revealed that for ΔNDSVI, the ‘not damaged’ and ‘moderately damaged’ classes did not differ significantly whereas for ΔGCI, the ‘moderately damaged’ and ‘severely damaged’ classes did not differ significantly (p > 0.05). By contrast, significant differences were detected among the three damage classes for the ΔMSAVI2, ΔNDTI, ΔNDVI and ΔRECI.
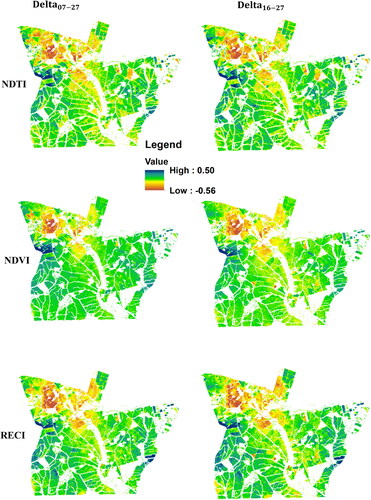
NDVI, RECI, GCI and MSAVI2 have high correlation since they all use band 8 (near-infrared) for their calculations. While NDVI has been used widely to asses vegetation condition, it has strong correlation with other indices such that there is no variation between and among those indices (Hatfield et al. Citation2008). It becomes difficult to assess the difference between them. However, based on the final results of the correlation matrix analysis, sugarcane condition maps can be analysed using delta vegetation indices. To have clear understanding on the performance, show the spatial extent of the damage using normal indices as well as consistent delta indices.
Figure 6. Consistent delta indices showing the changes between 7 January 2022, 16 January 2022 and 27 December 2021.
4.3. Discrimination of crop severity damage using PLS-DA
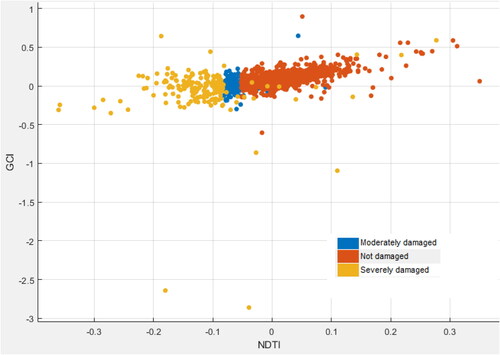
Results of the PLS-Discriminant Analysis based on delta of the following indices that include GCI, MSAVI, NDSVI, NDTI, NDVI and RECI show that sugarcane at different damage levels are distinct and thus separable (). In fact, from the visual assessment it can be observed that there is a clear-cut separation of the three different damage severity categories of sugarcane plants by forming distinct clusters. The normalized four-stage PLS-DA model significantly separated the sugarcane damage levels with an overall accuracy of 90% and a Kappa coefficient of 0.85. The most important vegetation indices for detecting the severity of hailstorm damage to sugarcane are NDTI and GCI.
Figure 7. Scatterplot of ΔGCI and ΔNDTI showing separability of the different damage severity categories.
4.4. Extent of sugarcane damage
ΔNDTI showed its effectiveness in being the most performer for hailstorm assessment. As such based on the response of ΔNDTI over the different damage severity classes, the classes where split using the thresholds as shown below;
If ΔNDTI ≥ 0.02 is ‘not damaged’
If -0.02 ≥ ΔNDTI ≤ 0.02 is ‘moderately damaged’
If -0.02 ≤ ΔNDTI is ‘severely damaged’
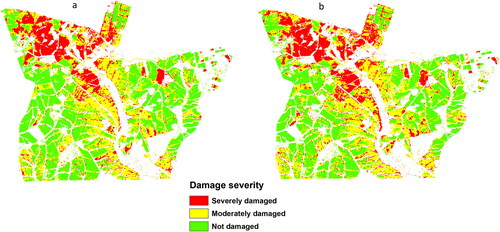
As shows the spatial variations in hailstorm damage induced on sugarcane across the study area. Hailstorm damage to sugarcane crops was most severe in the north-west and least in the southern and eastern section of the study area. Out of the total planted area of 1 721 ha, for a total area of 33% was ‘severely damaged’, 37.7% was ‘moderately damaged’ and finally 29.3% ‘not damaged’. For
25.9% was ‘not damaged’ while severely damaged increased to 37% and ‘moderately damaged’ was at 37.1%. A comparison of the hailstorm damage on sugarcane damage on the selected temporal window, shows that the damage impact in the ‘severely damaged’ class increased from 568 ha on the 7th of January to 637 ha on the 16th of January 2022. During the same period, area under ‘moderately damaged’ sugarcane decreased from 649 ha to 639 ha while the undamaged sugarcane decreased from 504 to 445 ha. Most of the changes are noticeable on the top part of the area especially from moderately to severely damaged. The direction of the destruction was increasing from south-east to north west. This is showing that when the days of assessment are increased, the actual damage extent can be detected and quantified accordingly.
Figure 8. Spatial distribution of severity damage of sugarcane plants as on, (a) 7 and (b) 15 January 2022 from normalized three-stage indices.
5. Discussion
The aim of this study was to develop a new remote-sensing approach for detecting the severity of hailstorm damage on sugarcane plants applicable on large scales. A sugarcane estate approximately 1 721 hectares located in Zimbabwe which was hit by a severe hailstorm on the 31st of December 2021 was chosen as the study site to test the robustness of the proposed four-stage approach. In brief, a new-generation remotely sensed dataset with an appropriate spatial and spectral resolution covering the study area that is available in the public domain free of charge was identified. For this study, Sentinel-2 was chosen. Images for the 27th of December 2021 (before the storm) and 7th of January (a week after) as well as the 16th of January 2022 were acquired. Considering that remote sensing scientists have developed a suite of spectral indices for monitoring vegetation condition and health, in the first stage the most widely used vegetation indices (VIs) were identified. Four chlorophyll-based VIs namely Green Chlorophyll Index (GCI), Normalized Difference Vegetation Index (NDVI), Normalized Difference Senescent Vegetation Index (NDSVI) and Red Edge Chlorophyll Index (RECI) were derived from appropriate Sentinel-2 bands and compared to two soil-adjusted VIs (Normalized Difference Tillage Index (NDTI) and Modified Soil Adjusted Vegetation Index (MSAVI2). The second stage involved comparing which of these sets of indices are optimum for detecting and characterising severity of hail damage to sugarcane plants. In the third stage, the promising indices were tested for their consistency over time. This was achieved by evaluating how well they discriminated the ‘not damaged’, ‘moderately damaged’ and ‘severely damaged’ categories one week after and two weeks after the hailstorm. In the final stage, partial-least squares discriminant analysis was applied on three temporally-stable indices to select the best performing index in terms of accuracy.
One interesting aspect of the results is that after the hailstorm had hit the study area, it was found out that at least one of the three damage categories was significantly different from the other two categories. This result was consistent for all six VIs. However, results of the post-hoc analysis showed mixed results regarding discriminating the three damage categories. First, only three indices, namely NDTI, NDVI and RECI showed significant differences among the three hail damage categories. NDVI and RECI are chlorophyll-based while one (NDTI) has been optimised to be sensitive to soil-properties. This finding implies comparable performance of the VIs in detecting and mapping crop damage. The success of these three indices is in part attributed to the fact that rather than using absolute values, changes in the value of the index were used to track hail damage on the photosynthetic activity and subsequent growth changes after the hailstorm. Another factor underscoring the ability of the indices to detect hail damage categories is that thresholding based on field observations was applied on each index to fine tune it.
When tested whether ΔNDTI, ΔNDVI and ΔRECI were still able to discriminate the three sugarcane damage categories two weeks after the occurrence of the hailstorm, results indicated that the three categories were statistically significant. This result confirms the consistency and stability of our approach over time. Specifically, one deduces that regardless of whether monitoring is done in a week or a fortnight after a hailstorm its effects on crop canopy, growth form and photosynthetic activity can still be tracked by ΔNDTI, ΔNDVI and ΔRECI. This is an important finding for it identifies a temporal window within which crop damage assessment can be undertaken without compromising the accuracy of the assessment. However, it will be interesting to test how the indices perform across successive weekly time periods in order to determine sugarcane recovery period.
An interesting observation from the study is that of all VIs considered in this study, NDTI achieved the highest overall accuracy of 90% and a very high index of agreement between satellite and ground data (kappa = 0.85). The least performing was NDVI with an overall accuracy of 72% and a kappa coefficient of 0.68 as shown in . The high classification accuracy achieved by NDTI in this study implies the robustness in quantifying sugarcane damage. This finding ties well with a recent study by Choudhary et al. (Citation2022) in which overall accuracy of 86.7% was reported for NDTI when they evaluated the damage to potatoes (Solanum tuberosum L.) caused by the hailstorm event in India using NDTI and NDVI. Although Schillaci et al. (Citation2022) employed Sentinel 2 data to detect medium to low damage to maize using six indices including NDVI and MSAVI2, MSAVI was the best performer followed by MSAVI2. In fact, while ΔNDTI, ΔNDVI and ΔRECI could statistically distinguish sugarcane damage categories regardless of the temporal window considered, MSAVI2 was sensitive to the damage severity category only. This limits its applicability for discriminating hailstorm damage to sugarcane in environmental settings similar to those obtaining in the study site.
Table 4. Confusion matrix of the most consistent spectral indices in this study.
Essentially, the integration of vegetation indices sensitive to different soil background effects and vegetation stress induced by reduced chlorophyll content are important when detecting surface anomalies as a result of hailstorm. These results are consistent with previous studies that have used remotely sensed data to detect changes in crop vigour induced by hailstorm. It is important to note that, although NDVI has been used extensively in vegetation studies, for assessing crop damage it has not been performing to expectations. For instance Ha et al. (Citation2022) used NDVI to estimate and assess the extent of hailstorm damage on different crops (durum wheat, canola, and lentil) in Assiniboia, Saskatchewan, Canada. In their study, they correlated ground estimates with NDWI, NDVI and PSRI to assess hail damage in canola (r = −0.90, RMSE = 8.24), wheat (r = −0.86, RMSE = 12.27), and lentil (r = 0.80, RMSE = 17.41). In contrast to the results of Ha et al. (Citation2022), while NDVI was one of the three VIs consistent in their ability to detect three sugarcane damage categories due to hailstorm, in the current study, NDVI did not achieve the highest classification accuracy. This justifies the recommendation by a growing list of studies for the use of other spectral indices such as NDTI that are sensitive to soil background effects.
Although the quantitative assessment based on a normalized four-stage approach has been shown to be useful for crop damage assessments, there are some potential weaknesses associated with the approach. The relative coarseness of Sentinel-2 data (10 m) is sometimes characterised by mixed pixel thereby affecting the response of multispectral indices to vegetation anomalies induced by the hailstorm. Moreover, the growing season in the area of interest coincide with the rain season which is often characterised by high cloud cover thereby reducing the utility of this approach during some periods during the rainfall season. Nevertheless, the normalized four-stage approach adopted here has several advantages for crop damage assessment especially in resource limited environments such as southern Africa. Firstly, all workflows in this approach rely mainly on freely available remote sensing data and easy use of cloud computing accessories, and can therefore be applied in-season at any cloud-free time. Secondly, the approach used in our study is useful in supporting the rapid assessment of crop damage and related decision making. The possible application of the normalized four-stage approach can facilitate loss assessment for agricultural insurance companies and farmers by examining the information on spatial damage caused by natural disasters. However, since satellite data were the only source, spatial and temporal resolution imagery can still be increased with the use of current technologies such as unmanned aerial systems. The unmanned aerial systems’ ability to safely, quickly, and cost effectively survey farm areas can be integrated with new technologies such as machine learning and deep learning for improved results.
6. Conclusion
The study was aimed at assessing the potential of publicly available Sentinel-2 datasets in assessing extent of sugarcane crop damage following a hailstorm. Six of the most widely used spectral indices namely NDTI, NDVI and RECI that allow for the detection and quantification of hail-induced crop damage were used. The conclusion that can be drawn from this study is that delta NDTI optimised for performance based on a simple four-stage approach is a suitable tool for detecting and mapping categories of hailstorm damage to target crops. The possible application of the normalized four-stage approach can facilitate crop loss assessment for agricultural insurance companies and farmers generate spatially explicit information on geographic extent and severity of damage caused by natural disasters to mitigate the losses. However, since satellite data were the only source (Sentinel-2), spatial and temporal resolution imagery can still be increased with the use of current technologies such as unmanned aerial systems. It is also important to include environmental factors, since they contributed to the development of crops over time. Additionally, crop condition prior to hail events and other variables such as precipitation, temperature, soil moisture, and evapotranspiration that affect crop growth must be documented so that the insurer will not be liable for yield losses as a result of other biotic and abiotic factors.
Authors’ contributions
P. Mafuratidze: Conceptualization of the study, data collection and analysis, and write up. T. P. Chibarabada: Conceptualization of study, data collection and write up. M.D. Shekede: Data analysis and write up. M. Masocha: Conceptualization of the study and write-up.
Disclosure statement
The authors declare that they have no known competing financial interests or personal relationships that could have appeared to influence the work reported in this paper.
References
- Adams-Selin RD, Ziegler CL. 2016. Forecasting hail using a one-dimensional hail growth model within WRF. Month Weather Rev. 144(12):4919–4939. doi: 10.1175/MWR-D-16-0027.1.10.1175/MWR-D-16-0027.1.
- Browning KA. 1977. The structure and mechanisms of hailstorms. In: Foote, GB., Knight, CA, editors. Hail: a review of hail science and hail suppression. Meteorological monographs. Vol. 16. Boston (MA): American Meteorological Society. doi: 10.1007/978-1-935704-30-0_1.
- Changnon SA, Kunkel K. 2006. Severe storms in the Midwest. Illinois state water survey, Informational/Educational Material 2006-06, 74p. Champaign Illinois.
- Childs SJ, Schumacher RS, Demuth JL. 2020. Agricultural perspectives on hailstorm severity, vulnerability, and risk messaging in eastern Colorado. Weather Clim Soc. 12(4):897–911. doi: 10.1175/WCAS-D-20-0015.1.
- Chivasa W, Mutanga O, Biradar C. 2019. Phenology-based discrimination of maize (Zea mays L.) varieties using multitemporal hyperspectral data. J Appl Rem Sens. 13(01):1. doi: 10.1117/1.JRS.13.017504.
- Cho MA, Sobhan I, Skidmore AK, de Leeuw J. 2008. Discriminating species using hyperspectral indices at leaf and canopy scales. Int Arch Photogram Rem Sens Spat Inform Sci. 37(Part B7):1–8.
- Choudhary KK, Chakraborty A, Murthy C, Poddar M. 2022. Satellite-based assessment of hailstorm affected potato crop for insurance purpose. Natural Hazards. 114:787–810. doi: 10.1007/s11069-022-05412-w.
- Gitelson AA, Gritz Y, Merzlyak MN. 2003. Relationships between leaf chlorophyll content and spectral reflectance and algorithms for non-destructive chlorophyll assessment in higher plant leaves. J Plant Physiol. 160(3):271–282. doi: 10.1078/0176-1617-00887.
- Gobbo S, Ghiraldini A, Dramis A, Dal Ferro N, Morari F. 2021. Estimation of hail damage using crop models and remote sensing. Remote Sens. 13(14):2655. doi: 10.3390/rs13142655.
- Ha T, Shen Y, Duddu H, Johnson E, Shirtliffe SJ. 2022. Quantifying hail damage in crops using sentinel-2 imagery. Remote Sens. 14(4):951. doi: 10.3390/rs14040951.
- Hatfield JL, Gitelson AA, Schepers JS, Walthall CL. 2008. Application of spectral remote sensing for agronomic decisions. Agron J. 100(S3):1–29. doi: 10.2134/agronj2006.0370c.
- Klemas VV. 2009. The role of remote sensing in predicting and determining coastal storm impacts. J Coast Res. 256(6):1264–1275. doi: 10.2112/08-1146.1.
- Kuri F, Murwira A, Murwira KS, Masocha M. 2014. Predicting maize yield in Zimbabwe using dry dekads derived from remotely sensed Vegetation Condition Index. Int J Appl Earth Obs Geoinf. 33:39–46. doi: 10.1016/j.jag.2014.04.021.
- Mafuratidze P, Muumbe TP, Gara TW. 2020. Dominant wetland vegetation species discrimination and quantification using in situ hyperspectral data. Transact R Soc South Afr. 75(3):229–238. doi: 10.1080/0035919X.2020.1798301.
- Mountrakis G, Im J, Ogole C. 2011. Support vector machines in remote sensing: a review. ISPRS J Photogramm Remote Sens. 66(3):247–259. doi: 10.1016/j.isprsjprs.2010.11.001.
- Mutowo G, Mutanga O, Masocha M. 2023. Optimising Sentinel-2 MSI spatial resolution for estimating foliar nitrogen concentration in miombo woodlands. J Spat Sci. 68(1):107–121. doi: 10.1080/14498596.2021.1930592.
- Muumbe TP, Tagwireyi P, Mafuratidze P, Hussin Y, van Leeuwen L. 2021. Estimating above-ground biomass of individual trees with terrestrial laser scanner and 3D quantitative structure modelling. South For. 83(1):56–68. doi: 10.2989/20702620.2020.1818535.
- Peters AJ, Griffin SC, Viña A, Ji L. 2000. Use of remotely sensed data for assessing crop hail damage. PE&RS Photogram Eng Remote Sens. 66(11):1349–1355.
- Petoumenou DG, Biniari K, Xyrafis E, Mavronasios D, Daskalakis I, Palliotti A. 2019. Effects of natural hail on the growth, physiological characteristics, yield, and quality of Vitis vinifera L. cv. thompson seedless under mediterranean growing conditions. Agronomy. 9(4):197. doi: 10.3390/agronomy9040197.
- Qi J, Chehbouni A, Huete AR, Kerr YH, Sorooshian S. 1994. A modified soil adjusted vegetation index. Remote Sens Environ. 48(2):119–126. doi: 10.1016/0034-4257(94)90134-1.
- Rahman MS, Di L, Yu E, Lin L, Yu Z. 2021. Remote sensing based rapid assessment of flood crop damage using novel disaster vegetation damage index (DVDI). Int J Disaster Risk Sci. 12(1):90–110. doi: 10.1007/s13753-020-00305-7.
- Raupach TH, Martius O, Allen JT, Kunz M, Lasher-Trapp S, Mohr S, Rasmussen KL, Trapp RJ, Zhang Q. 2021. The effects of climate change on hailstorms. Nat Rev Earth Environ. 2(3):213–226. doi: 10.1038/s43017-020-00133-9.
- Rouse JW, Jr., Haas RH, Schell JA, Deering DW. 1974. Monitoring vegetation systems in the great plains with erts. NASA Spec Publ. 351:309. https://ui.adsabs.harvard.edu/abs/1974NASSP.351.309R.
- Schillaci C, Inverardi F, Battaglia ML, Perego A, Thomason W, Acutis M. 2022. Assessment of hail damages in maize using remote sensing and comparison with an insurance assessment: A case study in Lombardy. Ital J Agronomy. 17(4) doi: 10.4081/ija.2022.2126.
- Silleos N, Perakis K, Petsanis G. 2002. Assessment of crop damage using space remote sensing and GIS. Int J Remote Sens. 23(3):417–427. doi: 10.1080/01431160110040026.
- Singh, S. K., Saxena, R., Porwal, A., Ray, N., & Ray, S. S. (2017). Assessment of hailstorm damage in wheat crop using remote sensing. Curr Sci. 10, 112, 2095–2100. doi: 10.18520/cs/v112/i10/2095-2100.
- Sosa L, Justel A, Molina Í. 2021. Detection of crop hail damage with a machine learning algorithm using time series of remote sensing data. Agronomy. 11(10):2078. doi: 10.3390/agronomy11102078.
- Susantoro TM, Wikantika K, Saepuloh A, Harsolumakso AH. 2018. Selection of vegetation indices for mapping the sugarcane condition around the oil and gas field of North West Java Basin, Indonesia. IOP Conf Ser earth Environ Sci. 149(1):012001. doi: 10.1088/1755-1315/149/1/012001.
- Tang BH, Gensini VA, Homeyer CR. 2019. Trends in United States large hail environments and observations. Npj Clim Atmos Sci. 2(1):45. doi: 10.1038/s41612-019-0103-7.
- Van Deventer AP, Ward AD, Gowda PM, Lyon JG. 1997. Using thematic mapper data to identify contrasting soil plains and tillage practices. Photogramm Eng Remote Sens. 63(1):87–93.
- Wiberg K. 2001. Enantiospecific analysis and environmental behavior of chiral persistent organic pollutants (POPs).
- Wiklund S. 2007. Spectroscopic data and multivariate analysis -tools to study genetic perturbations in poplar trees. In Processing (Issue November).
- Wójtowicz M, Wójtowicz A, Piekarczyk J. 2016. Application of remote sensing methods in agriculture. Commun Biom Crop Sci. 11(1):31–50.
- Yu G, Di L, Zhang B, Shao Y, Shrestha R, Kang L. 2013. Remote-sensing-based flood damage estimation using crop condition profiles. 2013 second international conference on agro-geoinformatics (agro-geoinformatics), 205–210. doi: 10.1109/Argo-Geoinformatics.2013.6621908.
- Zhao JL, Zhang DY, Luo JH, Huang SL, Dong YY, Huang WJ. 2012. Detection and mapping of hail damage to corn using domestic remotely sensed data in China. Aust J Crop Sci. 6(1):101–108.
- Zheng H, Cheng T, Li D, Zhou X, Yao X, Tian Y, Cao W, Zhu Y. 2018. Evaluation of RGB, color-infrared and multispectral images acquired from unmanned aerial systems for the estimation of nitrogen accumulation in rice. Remote Sens. 10(6):824. doi: 10.3390/rs10060824.
- Zontov YV, Rodionova OY, Kucheryavskiy SV, Pomerantsev AL. 2020. Chemometrics and Intelligent Laboratory Systems PLS-DA – A MATLAB GUI tool for hard and soft approaches to partial least squares discriminant analysis. Chemom Intel Lab Syst. 203:104064. doi: 10.1016/j.chemolab.2020.104064.