
 ?Mathematical formulae have been encoded as MathML and are displayed in this HTML version using MathJax in order to improve their display. Uncheck the box to turn MathJax off. This feature requires Javascript. Click on a formula to zoom.
Abstract
This study investigates the eco-geological environmental challenges faced by Jiangxia District, a mining region in Wuhan City. By combining field surveys, literature analysis and multi-source data such as remote sensing images and on-site monitoring data, an eco-geological environment quality (EGEQ) assessment system was developed. The system consists of six indicators representing biological abundance, vegetation cover, land erosion, water abundance, surface deformation and socio-economic characteristics of the assessed area. The grey relational analysis method was utilized to calculate the weights of each indicator, and the eco-geological environment quality index (EGQI) value was obtained through the linear weighted method. The assessment results indicated a moderate grade of overall eco-geological condition in Jiangxia District between 2017 and 2021, with an 8.56% increase in the EGQI during that period. This suggests a stable and favorable eco-geo logical environment situation in the district during the specified timeframe.
Highlights
Synergizing radar and optical data for eco-geological quality assessment.
Grey relational analysis and normalization for index weighting.
Evaluating human impact with socio-economic data.
Integrating surface deformation for environment evaluation.
Jiangxia’s eco-geological state average, yet constrained.
1. Introduction
Mining communities around the world share a legacy of environmental degradation and negative health impacts. Unfortunately, a balance between mining, the environment, and the health and safety of local residents has yet to be found (Martinez-Fernandez et al. Citation2012). This issue is particularly prominent and acute in mining cities located in areas with fragile ecological environments (Li et al. Citation2009; Yu et al. Citation2018; Cui et al. Citation2019; Xiong et al. Citation2022).
The over-exploitation of mineral resources may lead to the deterioration of EGEQ. At present, there are fewer studies on the impact of over-exploitation of non-metallic minerals, such as limestone mines, on regional eco-geological environment than that of metallic ores. Limestone is a calcareous sedimentary rock composed of Calcite (CaCO3). Cement, iron and steel industries are the primary customers of limestone, and it is also used in synthetic industries, such as calcium carbide, bleaching powder, soda ash and calcium carbonate, among others. However, during rapid opencast mining activities, limestone waste is often deposited in land-forms. These dust particles adversely affect vegetation distribution and increase surface temperature (Mondal et al. Citation2016). In addition, the dust forms leachate and penetrates the ground surface, affecting groundwater quality (Surinaidu et al. Citation2013; Akinyemi et al. Citation2023). Moreover, anthropogenic activities also affect the air, soil, and water quality, which can lead to human diseases such as asthma and bone weakness, among others (Vasanthavigar et al. Citation2010; Naja et al. Citation2011).
To investigate the impact of mining on the environment, monitoring various environmental factors such as vegetation, water bodies, temperature variation, land cover change, pollution, and water quality is essential (Padmanaban et al. Citation2017; Nascimento et al. Citation2020; Deng and Chen Citation2022; Hu et al. Citation2022; Wang et al. Citation2022; Zhang et al. Citation2022). The impact of mining activity on the environment can be identified with the help of multispectral remote sensing, synthetic aperture radar (SAR) data, vegetation index, water index and land cover data (Yang et al. Citation2018; Song et al. Citation2020; Chi et al. Citation2022; Kumar and Yarrakula Citation2022).
Jiangxia District, located in the southern part of Wuhan City in Hubei, China, is a significant producer of metallurgical solvents, such as limestone. However, more than 60 years of large-scale and high-intensity resource exploitation may lead to the rapid deterioration of the eco-geological environment in the region (Li et al. Citation2018; Shao et al. Citation2021). As a result, a comprehensive assessment of the EGEQ and the establishment of a scientific monitoring system are necessary for achieving sustainable development (Lu et al. Citation2023).
Eco-geological environment quality monitoring and assessment are integral aspects of eco-geology research, attracting significant scholarly attention (He et al. Citation2017; Leonenko et al. Citation2022). Researchers have conducted notable studies in this field, including a geo-environmental evaluation of Lanzhou city and its surrounding area (Dai et al. Citation2001). This evaluation employed multi-criteria analysis and GIS methodology to facilitate effective land-use planning (Peng et al. Citation2015). Additionally, landscape ecological risk assessments were conducted in mining cities, and an assessment framework was proposed to evaluate the vulnerable eco-environment of the Perfume River in Thua Thien – Hue Province using AHP and GIS (Nguyen et al. Citation2016).
In a coal mining area in western China, an integrated eco-geo-environmental quality assessment model was established by combining survey and Remote Sensing data with Fuzzy Delphi Analytic Hierarchy Process (Yang et al. Citation2019). Furthermore, the impact of mining activity on the environment was evaluated in the Qhorveh mining area in Iran, considering geological, ecological, and environmental data, as well as data on social development and regional economic status (Saedpanah and Amanollahi Citation2019).
The geological and ecological environment quality of the Wansheng economic development zone in Chongqing, China, were analyzed using the fuzzy comprehensive method (Lu et al. Citation2021). Moreover, remote sensing, SAR, geographic information system (GIS) and mathematical modeling were employed to examine the temporal and spatial distribution of surface subsidence in coal mining areas in a typical arid and semi-arid region (Jin et al. Citation2021).
To assess the change in ecological environment quality at the source of the Dongjiangyuan River, big data analysis and the remote sensing ecological index (RSEI) were utilized (Li Citation2022). Additionally, a comparison between the RSEI and the Ecological Index (EI) was made, and ecological environment quality was assessed using the popular pressure-state-response (PSR) method in the Samara region of Russia (Boori et al. Citation2021).
An information weight method and set pair analysis were applied to evaluate the geological environment quality of mines in Shangnan County, offering a theoretical basis for the comprehensive treatment of the mine geological environment (Wang and Li Citation2018). Lastly, a comprehensive evaluation of ecological environment quality was conducted in small coal mining subsidence areas, such as the Shendong coalfield in western China, based on a hierarchical structure. A model combining hierarchical and weighted methods was developed to achieve a comprehensive assessment of the surface ecological environment quality in these small-scale subsidence areas (Yang et al. Citation2022).
Overall, these studies contribute significantly to the field of eco-geology by employing various methodologies to monitor and assess the ecological-geological environment quality in different regions.
To summarize, evaluating the EGEQ is a complex and systematic process that involves acquiring basic information from various sources, modeling analytical methods and applying the results in decision-making. Field surveys are crucial for collecting information and understanding decision-making needs. In previous studies, field investigations were often overlooked, leading to cognitive bias in the assessment system. Therefore, this article takes Jiangxia District of Wuhan City, a typical limestone mining city in southern China, as a case study to establish a comprehensive EGEQ evaluation model by combining radar interferometry, multi-spectral image inversion and other technical means with field investigations for ecologically fragile mining cities.
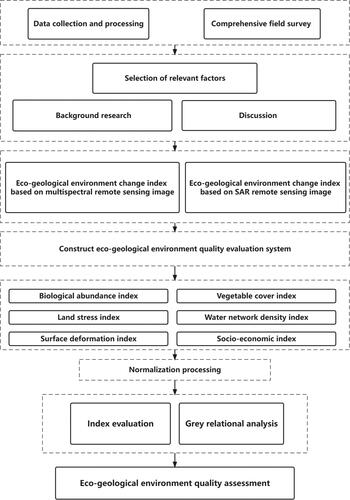
To analyze the characteristics of the eco-geological environment in Jiangxia District, this article combines field investigation and literature review. By incorporating a GIS), index evaluation method, and grey relational analysis (GRA) method (Dong et al. Citation2018), the article selects reasonable and effective evaluation factors such as the bio-abundance index, vegetation cover index, water network density index, land stress index, surface deformation index and socioeconomic index to establish the EGEQ evaluation model. The model describes the current status of the eco-geological environment of mining city and compares the ecological changes and restoration results in the region.
To establish the evaluation model, this article utilizes long-term remote sensing monitoring data. The technical roadmap for establishing the model is shown in .
Figure 1. Technology roadmap.
2. Study area
2.1. Geographical overview
Jiangxia District is located in the southern part of Wuhan City, Hubei Province, China (). It was named after Jiangxia County in the first year of Emperor Kai of the Sui Dynasty (AD 589). The district borders Hongshan District to the north, Xian’an District of Xianning City to the south, Ezhou City and Daye City to the east, and Caidian District, Hannan District, and Jiayu County to the west. The geographical coordinates are between 114°01'52"–114°35'38" east longitude and 29°58'05"–30°32'18" north latitude. Jiangxia District is now a new-type urban area of Wuhan, covering a total area of 2018 Km2. According to the seventh census, the permanent population of Jiangxia District is 974,715.
Figure 2. Location map of study area (a) the regional location of Jiangxia District, the red line represents the administrative area of Jiangxia District, and the black line represents the regional area of Wulongquan mining area. (b) Functional zoning of the Wulongquan mine area.
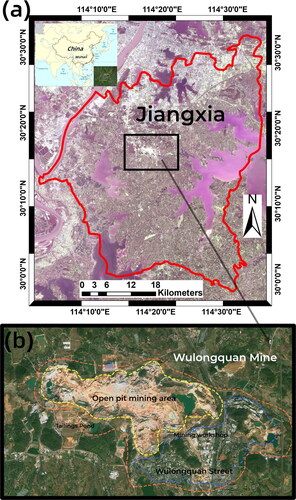
Jiangxia District has a superior location and convenient transportation, and borders the East Lake National Independent Innovation Demonstration Zone to the north and the Wuhan Economic Development Zone across the river to the west. It has the function of absorbing industrial radiation. The Wuhan-Guangzhou high-speed Railway, Beijing-Guangzhou Railway, and 107 National Highway run parallel throughout the district. The Beijing-Zhuhai Expressway and Shanghai-Chengdu Expressway intersect here, and the Yangtze River runs to the west. Additionally, twenty-three deep-water berths are under construction. There are 136 large and small lakes in the region, among which Liangzi Lake, Niushan Lake, Hatcheting Lake, Lu Lake, Houhu Lake, Shangshang Lake, and Tangxun Lake are the main lakes. Liangzi Lake, known as the “natural emerald,” has a water area of 450,000 mu, making it a rare pollution-free large lake in China (Hubei Province, Citation2013).
2.2. Geological and geomorphological overview
Jiangxia District is located in the transition zone between the Jianghan Plain and the southern Hubei Hills. The terrain is characterized by a high elevation in the middle, near the Yangtze River in the west, and gently sloping topography towards the Lake District in the east. The northern region comprises hilly terrain, which lies in an east-west belt between the network plain and the alluvial plain. The eastern and western regions are the Binjiang plain, while the central and northern regions consist of patches of gun hills with an elevation of around 150 m above sea level. The eastern, northern, and southwestern areas of the district are characterized by lakes, with water occupying about 28% of the total area of the administrative region. The district is home to 114 large and small mountains, with 52 of them rising above 100 m above sea level. The highest natural landform in the region is the Eighth Mountain, which stands at 272.3 m.
The geological and geomorphologic overview of Jiangxia District can be divided into three categories based on genetic types. The first category is the alluvial plain, which is the main form of accumulation terrain distributed mainly along rivers and lakes in the region. The gang-shaped plain, which is the second category, is the main form of denudation and accumulation terrain located in the middle of Jiangxia Region, particularly on the third-level terrace of the Yangtze River. This category has an elevation of 30–40 m, a height difference of 15–25 m, and a slope of 6–7 m. The last category is the hilly terrain, which is the main form of structural denudation terrain in areas such as Zhifang, Jinkou, Wulongquan, Fenghuang Mountain, Huanglongshan, and others. This type of terrain is composed of Paleozoic shale, quartz sandstone, siliceous rock, limestone, and has an elevation of 100–272 m, distributed in an east-west strip.
The strata in Jiangxia area belong to the Daye Sub-area of the Lower Yangzi area. The sedimentary basement of the pre-Sinian metamorphic rock series is developed in the Paleozoic, Mesozoic and Cenozoic strata. The Silurian strata is the oldest strata on the surface, most of which are covered by the Quaternary system. The magmatic activity in the region is bounded by the Liangzihu fault, with strong magmatic activity in the east and weak magmatic activity in the west, where Jiangxia District belongs. The magmatic rocks are mainly distributed in the Shuan and Husi areas of Liangzihu fault.
The folds of the early and middle Triassic strata of Paleozoic are distributed in the northern Jiangxia area, mostly being compact linear. A few of them are short axial, and all axial tracks are NW. The fold in the north of Zhifang city reversed southward, and the area from Zhifang to Wulongquan became normal. The anticlinal structure extends eastward and tends to collapse to Liangzihu, which can be divided into Wudong fold group and Zhifang fold group according to their outlying condition. The east-west fault is represented by the Heshengqiao to Husi fault layer, with an outcrop length of about 8 km, and the NW trending faults are concentrated in the north of Jiangxia District, where the landform is a hilly ridge extending along the strike of the strata. The NE-trending faults are concentrated in the areas of Badashan and Wulongquan. The Liangzihu fault zone extends into the region in the Husi area, which is a depression since the Mesozoic era.
2.3. Climate and hydrology overview
Jiangxia District, situated on the south bank of the Yangtze River, experiences a transitional humid monsoon climate in the middle subtropical zone. The region’s annual temperature averages between 15.9 and 17.9 °C, while the annual total precipitation ranges from 889.2 to 1862.6 mm, and the sunshine duration varies from 1450 to 2050 h. Although the subtropical continental monsoon climate characteristics are distinct, the seasonal distribution of light, heat, and water varies significantly across different years, resulting in droughts and floods, followed by low temperatures, rain and light that harm agricultural production.
The region’s topography comprises a north-south narrow and east-west slanting wavy landform, with centrifugal fan-shaped precipitation and runoff, and numerous branch ports resulting from its location along the lake and riverside on three sides. This terrain is characterized by small veins, shallow source, and short process, which cannot form large mountains and rivers, resulting in small surface runoff in reservoirs and gullies. Consequently, the regulation performance is poor, and the potential reserves are low, with limited value for development and utilization. However, the water intake of lakes within the territory is large, and the available water storage capacity is desirable.
2.4. Mineral resources overview
In terms of mineral resources, Jiangxia District boasts a rich abundance, with 21 minerals having been discovered and 16 currently being extracted. Notably, the Wulongquan Mine serves as the main source of metallurgical materials in the area. Wulongquan Mine is located on the outskirts of Wuhan City and is the only large-scale open-pit mine in the city. The Wulongquan Dolomite deposit (), situated 2.9 km northwest of Wulongquan Railway Station, has proved reserves totaling 94.76 million tons. Meanwhile, the Wulongquan limestone deposit, also located 2.9 km northwest of Wulongquan Railway Station, holds a reserve of 160 million tons.
3. Status of the eco-geological environment
Assessing the eco-geological environment in mining cities is complex and requires a targeted approach based on the unique environmental challenges presented by mining activities. These challenges are the result of a combination of different geological environmental backgrounds and the intensity of mining activities.
As the largest and most important mine in Jiangxia District, Wulongquan mining area has a significant impact on the eco-geological environment and social economy of the area. During our field survey, we focused on the mine, geological disaster sites and residential areas.
The mine has been in operation for nearly 60 years and has a complete set of supporting facilities for production and living. However, the products of the mine are low value-added varieties, similar to building materials mines, and are only suitable for high-efficiency, low-cost, and high-recovery open-pit mining. The inherent shortcomings of open-pit mining, such as the need to excavate and occupy land, result in significant land damage in the project area, with a deep degree of damage.
In addition, the crushing, screening and calcining of raw materials require a large amount of land to build supporting industrial facilities, which further exacerbates land damage. Wulongquan Mine uses traditional technology (perforation-blasting-mining), and land damage occurs throughout the mine construction and production process.
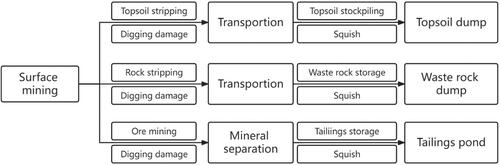
To address these issues, the Wuhan Iron and Steel Corporation developed a mineral resources exploitation and ecological restoration scheme for Wulongquan Mine in 2019, as shown in . The scheme aims to balance the exploitation of mineral resources with ecological restoration to mitigate the environmental impact of mining activities.
Figure 3. The link and way of land damage in open pit mining (mineral resources, development and utilization of Wulongquan Mine and ecological greening scheme of Wuhan Iron and Steel Corporation, 2019).
Combined with the deformation analysis results of SAR data, the open-pit mining field in Wulongquan Mining area has caused the exposed soil surface of the surface and mountain (). The absence of vegetation cover and the fragility of the surface and rock structure, coupled with mining vibrations and seasonal rainfall, have resulted in the instability and fracture of the slope (). The loose gravel slope in the area is highly susceptible to sliding and collapse under unstable conditions (). Artificial ponds have been constructed to separate the open-pit mining area from the slope (). Settlement ranges have been observed above the workshop area, with most of the regions showing unstable surface micro-floating. The surface morphology of the mining area is highly variable, with no continuous tailing’s accumulation.
Figure 4. Destruction of land resources and geological disasters in mining areas caused by mining and human activities. (a) Current situation of east open pit of Wulongquan Mine; (b) open-pit mining site; (c) excavation damage in open working area and temporary road; (d) artificial lake and industrial plant in mining area; (e) instability of houses in Wangxian Village; (f) repair marks from the house’s instability (the photos were taken in June 2022).
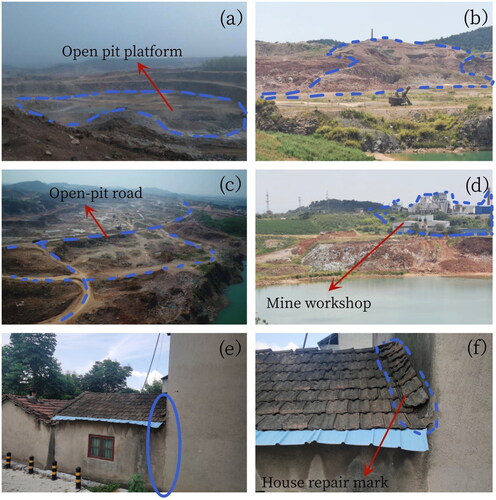
In Wangxian Village, located to the south of the Wulongquan Mining area, field surveys have uncovered clear indications of repair marks of wrong platform on the outside of blank houses built by residents, and the walls of the houses are inclined (). Structural instability and hidden danger of residential buildings in this area are more significant than potential crustal movement or surface subsidence ().
Based on field investigations and regional data, this study is divided into three parts. The first part involves the annual calculation of ecological environment index factors in Jiangxia District, Wuhan, during the research period. Optical remote sensing image recognition is used to extract surface information such as mine geological environment factors, land cover information, vegetation cover, and water and soil environment. The quantitative evaluation research of multispectral images analyzes the ecological environment, spatial distribution of land use, pollution degree of water environment and damage degree of land environment from the perspective of remote sensing characteristics.
The second part focuses on the monitoring of surface deformation in the Wulongquan mining area, Jiangxia District, Wuhan City. SAR data is used to identify and extract land subsidence information, and combined with optical remote sensing data, spatial data such as the spatial distribution of geological structure and area distribution of ground collapse are identified and extracted.
The third part establishes an evaluation model of the geological ecological environment quality in Jiangxia District. This model aims to address the main ecological problems. The evaluation model is suitable for evaluating the quality of the mining area ecological environment and ecological environment prediction evaluation.
4. Acquisition and processing of model data
4.1. Source of data
All data were collected in Jiangxia District. Soil erosion data were obtained from the Wuhan Soil and Water Conservation Bulletin. The fraction of vegetation cover (FVC) was calculated using Landsat 8 and Sentinel-2 data with a spatial resolution of 30 meters in the region.
Water resource volume data was obtained from the Water Resources Bulletin of Wuhan City. The water resource volume of each county and district were determined based on the water resource volume data of the city and the land area as the weight. Social and economic data were obtained from the National Economic and Social Development Statistical Bulletin released by the Jiangxia District government from 2017 to 2021.
As for SAR data, a total of 153 images of European Space Agency (ESA) Sentinel-1 satellite data from March 2017 to March 2022 were selected in the Jiangxia region, all in C-band. In this article, the SBAS-InSAR technique is used to monitor the surface deformation in Jiangxia District of Wuhan City.
SBAS-InSAR is a widely used technique for monitoring land surface deformation using SAR data. It employs the Small Baseline Subset (SBAS) data processing technology to reduce noise and improve monitoring accuracy. By extracting deformation and subsidence information from SAR data, SBAS-InSAR combined with optical remote sensing provides spatial data on surface deformation and collapse areas. SBAS-InSAR utilizes SAR image datasets of the monitoring area, dividing them into subsets based on spatial-temporal baseline thresholds. This approach allows for larger baseline distances between subsets and smaller distances within the same subset. Strain information for corresponding points is obtained using the least squares method, combined with singular value decomposition for joint solution values. This calculation method attenuates de-correlation and atmospheric errors during D-InSAR processing.
In order to facilitate processing, some regions in the original data were selected as areas of interest. The wide-width TOPSAR imaging mode data used in this project has very high registration requirements, and the transmission registration technology is required for the registration of long time series images. In addition, the POD Precise Orbit Ephemerides released by ESA was used to improve the orbit accuracy of Sentinel-1 images.
4.2. Processing of vegetation coverage (FVC) data
NDVI is not only the best indicator of vegetation growth status, but also can reflect the level of vegetation cover and vegetation growth status. The calculation formula is as follows:
(1)
(1)
where, NIR is the far infrared band and RED is the infrared band).
The greater the NDVI value, the better the plant growth trend. Therefore, the annual maximum NDVI can reflect the land surface vegetation cover in the optimum period of vegetation growth. However, NDVI has the disadvantages that high vegetation cover is easy to saturate and low vegetation cover is difficult to distinguish. The vegetation coverage of the study area estimated based on the improved dimidiate pixel model can make up for this deficiency (Yu et al. Citation2023). The calculation formula is as follows:
(2)
(2)
where, FVC is the vegetation coverage of the study area,
is the NDVI value corresponding to the bare land or non-vegetation covered area, and
is the NDVI value corresponding to the pure vegetation covered area. The formula for calculating the two values is:
(3)
(3)
(4)
(4)
When the measured data are available, the maximum and minimum values of vegetation coverage in the measured data are taken as and
and the NDVI corresponding to the two measured data is taken as
and
When there is no measured data, and
within a certain range of confidence are taken.
and
are estimated based on experience.
With reference to the application of the current binary pixel model, the accuracy of the selection of and
values directly affect the accuracy of vegetation coverage estimation. Based on the interval distribution of NDVI values within the study area, the upper and lower limits of NDVI intercepted at 5% and 95% confidence levels are used as
and
Dynamic attitude of land use refers to the quantitative changes of land use types in a certain period, mainly reflecting regional differences in the intensity and rate of land use change, which can be divided into single dynamic attitude of land use and comprehensive dynamic attitude of land use. The formula is as follows:
Single land use dynamic attitude:
(4)
(4)
where K is the dynamic attitude of a certain land use type during the study period,
is the area of a certain land use type at the beginning of the study,
is the area of the land use type at the end of the study, and T is the length of the study.
Comprehensive land use dynamic attitude:
(5)
(5)
where
is the comprehensive dynamic attitude of land use in the study area,
is the area of Class i land use type at the start time of the study,
is the absolute value of the area of class i land transformed into class j land use type during the study period, and T is the research time.
Based on the monthly vegetation coverage and temperature data from 2017 to 2021, a regional statistical analysis was conducted in Jiangxia District, Wuhan City. The analysis employed trend analysis, coefficient of variation, and correlation analysis to investigate the spatiotemporal variations of vegetation coverage and the impact of temperature on vegetation changes in the district. The main findings are summarized as follows:
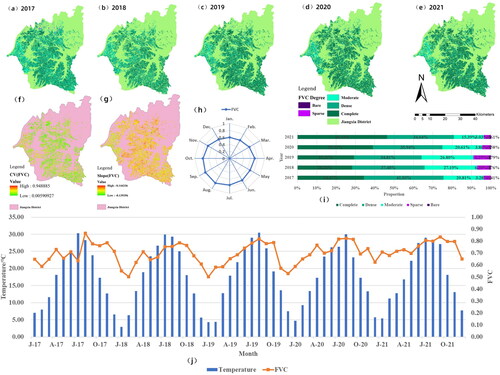
Overall, the vegetation coverage in Jiangxia District exhibited a general increasing trend over the long-term observations, consistent with seasonal variations, with higher coverage in summer and lower coverage in winter. However, considering the winter-spring transition and vegetation recovery, the actual vegetation coverage in winter, although relatively low, showed a higher growth rate compared to spring and autumn (). Spatially, the district displayed good overall vegetation coverage, predominantly consisting of moderate to high levels. The distribution pattern showed higher coverage in the south and lower coverage in the north, as well as higher coverage in the east and lower coverage in the west (). The trend slope of vegetation coverage ranged from −0.13 to 0.14 in Jiangxia District, with approximately 84.44% of the area experiencing an increasing trend (). The areas with increasing trends were primarily located in Zhengdian, Shanpo and Husi administrative areas. On the other hand, the areas with decreasing trends, accounting for 15.56%, were mainly found in Zhifang, Jinkou and Fasi administrative areas. The changes in these areas were primarily influenced by human activities, including urbanization ().
The vegetation coverage in Jiangxia District demonstrated a predominantly stable pattern, with an average coefficient of variation of 8.35%. The stable vegetation coverage occupied approximately 93.74% of the district’s total area and was mainly concentrated in the central-eastern regions of Jiangxia District. These regions, such as Shuan, Husi and Anshan streets, had relatively fewer human activities. They were characterized by extensive farmland and cultivated land, which experienced minimal human impact. In contrast, the areas with unstable vegetation coverage accounted for 6.26% of the district’s total area and were mainly concentrated in urbanized towns and rapidly developing blocks, including Zhifang, Jinkou and Fasi streets. Among these areas, Zhifang street had completed urbanization due to its proximity to the city center of Wuhan, while Jinkou and Fasi streets were undergoing rapid development due to socioeconomic influences ().
There was a significant correlation between annual vegetation coverage and temperature in Jiangxia District. From 2017 to 2021, the overall vegetation coverage exhibited a positive correlation with temperature in the district. In terms of land types, cultivated land showed a higher correlation with temperature compared to non-arable land. This indicates that crops grown on cultivated land are more sensitive to temperature and climate changes. However, they are also more susceptible to human influences ().
Figure 5. Distribution of vegetation cover in Jiangxia District: (a) the distribution of 2017; (b) the distribution of 2018; (c) the distribution of 2019; (d)the distribution of 2020; (e) the distribution of 2021; (f) distribution of slope of vegetation cover in Jiangxia District from 2017 to 2021; (g) distribution of coefficient of variation of vegetation cover in Jiangxia District from 2017 to 2021; (h) monthly average of vegetation cover in Jiangxia District from 2017 to 2021; (i) year-by-year percentage distribution of vegetation cover degree in Jiangxia District from 2017 to 2021; (j) month-by-month vegetation cover and temperature trends in Jiangxia District from 2017 to 2021.
4.3. Processing of land use and cover data
Land use and cover data are essential to calculate the Biological Abundance Index in the Technical Specification for Assessment of Ecological and Environmental Conditions (HJ192-2015) issued by the Ministry of Environmental Protection. The data reference the 2000 land use/cover classification system of the Ministry of Ecology and Environment, considering the dual attributes of natural ecology and land use. The first-level classification was used to classify the land use/cover of the study area based on the land classification survey conducted by remote sensing technology and the prescribed accuracy that may be achieved. Ground objects interpreted by remote sensing images with lower resolution were not included in the classification system alone. The interpretation of land use data from 2017 to 2021 was completed based on remote sensing interpretation of Landsat with a spatial resolution of 30 m and Sentinel-2 data with a spatial resolution of 10 m. Land cover types are defined in below.
Table 1. Definition of land use/cover change types in the study area.
Based on the annual land use data from 2017 to 2021, a statistical analysis was conducted using the land use/cover change transition matrix. Additionally, a dynamic model of land use/cover change was employed to calculate the spatiotemporal variations and dynamics of land use/cover in the study area. The main findings are as follows:
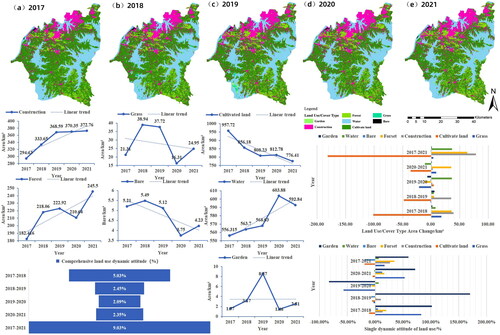
In terms of quantity change characteristics, during the study period, the land use/cover types in Jiangxia District of Wuhan City exhibited different trends due to variations in population, socioeconomic development, and government policies. The largest transition into the area from 2017 to 2021 was observed in forest land, primarily converting from cultivated land. The second largest transition was observed in construction land, also originating from cultivated land. This suggests that the conversion from cultivated land to forest land is primarily driven by the national policy of ‘returning farmland to forests’ in recent years ().
Regarding spatial change characteristics, Jiangxia District exhibited diverse spatial trends during the study period (). The major land use type transitions occurred in Zhifang Street in the north, Jinkou and Fasi streets in the west, and Wulongquan Street in the central part of the district. Changes in construction land mainly occurred in streets with rapid socioeconomic development and significant regional construction, such as Zhifang Street and Liufang Street, which are closer to the city center of Wuhan. Cultivated land changes were mainly observed in the southeast part of Jiangxia District, including Shuan Street, Husi Street and Shanpo Street, which are characterized by agricultural development. Forest land changes covered all townships and streets in the district ().
With the increase in population and socioeconomic development, the changes in land use/cover types closer to the urban areas exhibited greater diversity and complexity. Land use patterns in rural areas tended to be simplified, while land use/cover transitions in urban areas became more diverse and complex, particularly in the transformation of other land use types to construction land, which mainly occurred in urban areas and showed a strong correlation with the urbanization rate. Considering the recent economic changes and policy conditions in Jiangxia District, the area has a solid socioeconomic foundation. With the upgrading and adjustment of industries, the district has continuously developed its socioeconomic status. Benefiting from abundant resources and favorable location advantages, it has attracted numerous foreign investments. The three major industrial structures have been continuously optimized and adjusted. With the support and guidance of national policies, the district has achieved sustained and positive socioeconomic development. The land use in the region has been continuously changing and shifting along with socioeconomic development, particularly in terms of construction land area ().
Figure 6. Land use/cover distribution in Jiangxia District: (a) the distribution of 2017; (a) the distribution of 2018; (a) the distribution of 2019; (a) the distribution of 2020; (a) the distribution of 2021; land use/cover type change over time in Jiangxia District: (f) the change of grass; (g) the change of construction; (h) the change of cultivate land; (i) the change of Forest; (j)the change of garden; (k) the change of bare; (l) the change of water. (m) year-by-year land use/cover area change in Jiangxia District; (n) comprehensive dynamic attitude of land use/cover area change by year in Jiangxia District; (o) year-by-year land use/cover area change single dynamic attitude in Jiangxia District.
4.4. Processing of surface deformation data
SBAS-InSAR is a common technique in this field. It is a method of monitoring land surface deformation based on SAR data. SBAS-InSAR uses a data processing technology called Small Baseline Subset (SBAS), which can effectively reduce the noise and error of SAR data processing, thereby improving the monitoring accuracy of land surface deformation. Identify and extract surface deformation data and identify and extract ground subsidence information using SAR data. Combining SAR data and optical remote sensing data, SBAS-InSAR is used to obtain spatial data such as spatial distribution of surface deformation and distribution of surface collapse area.
The data processing steps for SBAS-InSAR include:
Generating de-topographic interferograms by removing topographic phases from SAR image datasets.
Selecting high coherence points in the de-topographic interferogram for phase deconvolution and calibration.
Establishing a model equation system using average deformation rate, elevation error, and differential phase at different time periods.
Obtaining the least squares solution using the SVD method under minimum parametric conditions.
Estimating atmospheric phase and nonlinear deformation.
According to the data processing procedure described earlier, the surface deformation rate map and cumulative deformation values relative to the baseline data of March 19, 2021, were obtained using the SBAS-InSAR time-series analysis method for the period from March 2017 to March 2022 in the Wulongquan mining area. The results were overlaid on the aerial images from TianDiTu, and the analysis was conducted using the statistical data of disaster points, as shown in . Positive values in indicate vertical uplift of the land surface, while negative values represent vertical subsidence. The average annual surface deformation rate in the Wulongquan mining area during the monitoring period ranged from −25.2 to 4.6 mm/year. The main deformation areas were observed in the mining area and the living factory buildings in the central part of the study area. Given the extensive human activities and land use changes in the region during the monitoring period, in addition to underground mining activities, a comprehensive analysis of historical disaster-prone areas and the analysis of the geographic and geomorphic environment were conducted to assess the widespread a deformation.
Figure 7. (a) Distribution of accumulated settlement at the Wulongquan mine; deformation in key areas of the Wulongquan mine: (b) the deformation of open pit platform; (c) the deformation of tailings pond; (d) the deformation of Xiamentang Village; (e) the deformation of Wangxian Village; (f) time-series deformation monitoring map of the Wulongquan mine.
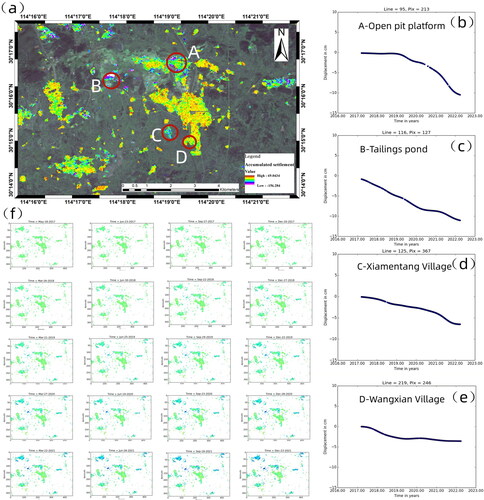
shows the cumulative deformation data at selected time points. As depicted in , with the passage of time and continuous mining operations in the mining area, significant subsidence areas have formed in the mining area and its surroundings. The cumulative subsidence values and the affected area have gradually increased.
Four key areas were selected for in-depth analysis based on a combination of subsidence and geological considerations. These areas include the open-pit mining area in the Wulongquan mining area (Area A), the Dahongshan open-pit tailings dam (Area B), the Xiamen Village in the southern part of Wulongquan (Area C), and the Wangxian Village residential area in the southern part of Wulongquan (Area D). To investigate the temporal evolution of surface deformation in the vicinity of the Wulongquan mining area, the deformation time series of characteristic points within these four areas were selected and analyzed. The distribution of all characteristic points is shown in . The surface subsidence process in these four key areas exhibits a nonlinear relationship. However, over time, the cumulative deformation variables in these areas show an increasing trend, with a maximum cumulative subsidence value of up to −156 mm. Areas A, B and C are closely related to mining activities, while area D, a residential village, experienced sustained subsidence during the monitoring period. Areas A and B are open-pit mining areas where continuous mining activities have led to unstable slopes and step-like subsidence deformation. Additionally, the Dahongshan tailings dam, used for tailings storage, also experienced subsidence, indicating that mining activities and human interventions directly contribute to surface deformation. Natural settlement of accumulated minerals due to seasonal rainfall and non-human factors also contributes to subsidence. Areas C and D are residential areas without mining rights within a 1 km radius, yet they still exhibit continuous surface deformation. In addition to considering deep geological factors, a survey of artificial structures on the surface is needed to confirm the occurrence of regional deformation and conduct further investigation and analysis of these key areas.
Based on the above graphics, the main areas with extensive subsidence within the monitoring study area are as follows:
The open-pit mining area in the Wulongquan mining area. This region is the core mining area of the Wulongquan mining area and includes several limestone mining areas. Long-term mining activities and geological conditions are the main causes of surface deformation in this area. The most severely deformed area has a cumulative subsidence of −107 mm ().
The Dahongshan tailings dam area. The tailings dam has always been a focus of mining safety monitoring. The main mineral resources mined in the Wulongquan mining area are limestone ores. The tailings generated during the mining process are in the form of mud and are characterized by flowability and difficult reutilization. As a result, continuous subsidence occurs during the storage of tailings, with a maximum cumulative subsidence value of −156 mm during the monitoring period ().
The deformation area in the Xiamen Village region in the southern part of Wulongquan. During the monitoring period, extensive human activities and land use changes occurred in this rural area, resulting in changes in the original land structure and sustained subsidence deformation. The maximum cumulative subsidence value in this area is −72 mm ().
The surface deformation in the Wangxian Village residential area in the southern part of the Wulongquan mining area. This area, located in the residential community in the southern part of the Wulongquan mining area, experienced continuous subsidence during the monitoring period. The maximum cumulative subsidence value in this area is −50 mm ().
5. Eco-geological environmental quality index
5.1. Model method
The index system of eco-geological environment evaluation in this study is constructed using index evaluation and GRA. The individual evaluation of each factor involved in the evaluation is carried out separately using the index evaluation method. The weighted summation method is then adopted, based on the attribute weight of each evaluation factor and individual evaluation, to carry out a comprehensive evaluation of the ecological environment (Azzeh et al. Citation2010; Sun et al. Citation2022).
GRA is a multi-factor statistical analysis method that measures the distance between series and discusses the correlation between factors. It measures the correlation between factors based on the similarity degree or correlation degree of the trend of change between factors. The steps of GRA include dimensionless processing of data, solving the grey relational values between the parent sequence and the feature sequence, solving the grey relational degree value, and ranking the grey relational degree values to draw a conclusion.
To evaluate the eco-geological environment, we constructed an index system using both the index evaluation and GRA. First, each factor involved in the evaluation was evaluated separately using the index evaluation method. Then, we used the weighted summation method to carry out a comprehensive evaluation of the ecological environment by combining the individual evaluations with the attribute weight of each evaluation factor to determine the final result. GRA is a statistical method used to measure the correlation between factors by analyzing the similarity degree of the trend of change between factors, using discrete data to measure the distance between series.
To perform GRA, we followed the following steps:
We conducted dimensionless processing, involving the mean value and initial value, for the data.
We solved the grey relational values between the parent sequence (contrast sequence) and the feature sequence.
In this study, we adopted Deng’s relation degree to measure the correlation degree, which refers to the difference between the geometric shapes of response curves. The relation degree takes the following form:
Calculation of grey relational degree
By synthesizing the relational coefficients of each point, the relational degree
between the curve of the comparison sequence
Rank the grey relational degree values and draw a conclusion.
According to the grey weighted relational degree, the correlation order of each evaluation object is established. The greater the relational degree, the greater the importance of the evaluation object to the evaluation criteria (Pakkar Citation2016). In this model, the GRA method is used to analyze the discrete data of different indicators, finding the relational degree between each data and the parent series, and obtaining the weight of each index value. The index evaluation method is then used to obtain the comprehensive evaluation of eco-geological environment through the weight of each index obtained from the GRA.
5.1. Calculation method
To evaluate the overall state of regional ecology and geological environment, the EGQI was constructed by referring to the ecological environment status evaluation index and geological environment data.
The index system included various factors such as the biological abundance index, vegetation cover index, water network density index, land stress index, surface deformation index, and social and economic index. These factors reflect the abundance and poverty of organisms, vegetation cover, water richness, stress intensity, surface deformation, and socio-economic level changes in the evaluated area. The specific formula and calculation method for each index are as follows:
(1). Biological abundance index (BAI)
The biological abundance index (BAI) is a metric that is used to assess the abundance and diversity of organisms in a given region.
(8)
(8)
where:
– normalization coefficient of habitat quality index.
and
are, respectively, the area of forest, grassland, water, cultivated land, construction land and bare land in the evaluation area.
is the area of the region.
(2). Vegetation COVER INDEX (VCI)
The vegetation cover index was calculated using the mean value of the maximum monthly pixel FVC from May to September in the region (). The formula used to calculate the vegetation cover index is as follows:
(9)
(9)
In the formula, is the monthly mean value of the pixel FVC region from May to September, and
is the number of monthly copies.
(3). Land stress index (LSI)
(10)
(10)
where,
is the normalization coefficient of land stress index,
and
are respectively the severe erosion area, moderate erosion area, construction land area and bare areas in the evaluation area.
is the area of the region.
(4). Water network density index (WDI)
(11)
(11)
where,
is the normalized index of river length;
is the length of rivers and main channels formed by natural or artificial excavation in the region;
is the normalized index of water area;
is the area of water within the region.
is the normalized index of water resources;
is the amount of water resources calculated according to the water resources data provided by relevant water conservancy units in the region; the amount of water resources is calculated by the following formula:
(12)
(12)
where,
is the water resources data provided by relevant water conservancy units in the region, and
is the annual average of the water resources provided by relevant water conservancy units in the region during the study years.
(5). Surface deformation index (SDI)
Surface deformation is a critical indicator that affects the geological environment. It is classified into three levels based on geological exploration data. The specific classification is shown in . The number of different land use types in each level is counted. To account for potential deformation monitoring errors caused by vegetation growth, weight is assigned according to land use classification, and the impact of surface deformation on the geological environment of the study area is comprehensively evaluated.
Table 2. Classification of deformation.
To ensure a comprehensive evaluation of different land use types under the same deformation grade, a decentralization weight coefficient is given to reflect the influence of different land use types and deformation.
The data for the surface deformation index are mainly derived from the surface deformation data obtained using InSAR technology. The deformation data is classified and processed, and then multiplied by different weight values for each ground class to obtain the parameter data for the surface deformation index.
(13)
(13)
where:
– the normalization coefficient of the surface deformation index, the reference value is 100/Amax (Amax is the maximum value of the data set before normalization processing).
and
are, respectively, the area of forest, grassland, water, cultivated land, construction land and bare land in the evaluation area.
(6) Socio-economic index (SEI)
The socio-economic index is a crucial component in assessing the overall eco-geological environment quality of a region. Unlike natural environmental factors, socio-economic factors are dynamic and have a direct and significant impact on the regional environment. Positive development in social and economic factors is often associated with the development and utilization of resources, which can have negative consequences for the eco-geological environment.
To calculate the socio-economic index, we selected four major indicators from the social and economic level data from 2017 to 2021: permanent resident population (PRP), gross domestic product (GDP), gross industrial output value above designated size (IOV), and total investment in fixed assets of the whole society (FAT), as shown in . We assigned different weights to each indicator based on their degree of correlation to socio-economic conditions.
Table 3. Social and economic indicators of Jiangxia District.
The parameter data of the socio-economic index are mainly obtained from the four socio-economic indicators in the statistical bulletin of National economic and social development of Jiangxia District and multiplied by the weight coefficient.
(14)
(14)
where:
– the normalization coefficient of the socioeconomic index, the reference value is 100/Amax (Amax is the maximum value of the data set before normalization processing).
is the resident population of the evaluation area, respectively, and the unit is 10,000;
and
are the gross product of the evaluation area respectively, the total industrial output above designated size, and the total investment in fixed assets of the whole society, and the unit is 100 million yuan.
(7). Eco-geological environmental quality evaluation grading
In accordance with the Technical Specification for Evaluation of Ecological Environment Status (HJ192-2015) issued by the Ministry of Environmental Protection and taking into account the actual conditions, the ecol-geological environment status is classified into five levels: excellent, good, moderate, poor and very poor. These levels are presented in .
Table 4. Classification of eco-geological environment quality.
5.2. Model index coefficient processing
We calculated the actual value of each index from 2017 to 2021. The value of each index was then normalized, and we used GRA to calculate the weight of each model index, completing the construction of the EGQI (Azzeh et al. Citation2010).
shows the normalization process of each index year by year.
Table 5. Normalization of each index.
The eco-geological environment quality evaluation model was developed using the GRA method, with the biological abundance index used as the reference or comparison sequence, while the other indicators served as the characteristic sequence. The biological abundance index reflects the abundance and poverty of biological species in the assessed area, and indirectly reflects the regional environmental diversity. Thus, it is a reasonable choice to use the biological abundance index as the comparison sequence.
GRA was performed on five evaluation items, namely vegetation cover index, water network density index, land stress index, surface deformation index, and socioeconomic index, using the biological abundance index as the parent sequence. The correlation degree between the five evaluation items and the biological abundance index was studied, providing reference for analysis. In the grey correlation analysis, the resolution coefficient was set to 0.5, and the correlation value was calculated by combining the correlation coefficient calculation formula. The correlation value was then used for evaluation and judgment. The grey correlation coefficients are shown in , and the grey correlation results are shown in .
Table 6. Grey correlation coefficient.
Table 7. Grey correlation results.
To evaluate the eco-geological environment status, an EGQI was constructed using the evaluation index of ecological environment status and geological environment data. This index system includes several factors such as the abundance of organisms, vegetation cover, water richness, stress intensity, surface deformation and socio-economic level change in the evaluated area.
To construct the model, the actual value of each index from 2017 to 2021 was calculated and normalized. The grey correlation analysis method was used to calculate the weight of each index, with the biological abundance index chosen as the comparison sequence.
The correlation degree of the five evaluation items (vegetation cover index, water network density index, land stress index, surface deformation index, and socioeconomic index) and biological abundance index were analyzed using grey correlation analysis, and the results were used to evaluate and rank the five evaluation objects. The land deformation index was found to have the highest evaluation (correlation degree: 0.858), followed by the land stress index (correlation degree: 0.799). The correlation coefficient is shown in .
Figure 8. (a) Distribution of calculated weights for each model indicator (LSI, SDI, SEI and BAI); (b) EGQI index weight distribution; (c) results of grey correlation analysis of each index; (d) normalized results of each index; (e) change of EGQI in Jiangxia District from 2017 to 2021.
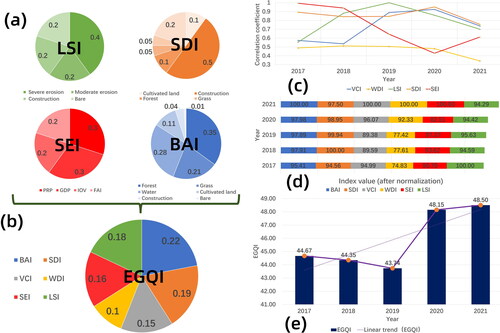
Normalization of the correlation results was carried out to obtain the weight value of each indicator (), which was used to construct the EGQI (). The weights for each factor were determined using the grayscale correlation analysis method, and the EGQI was established as follows:
(15)
(15)
This model effectively reflects the overall state of regional eco-geological environment and can be used to evaluate the quality of the environment ().
Table 8. Weight calculation.
6. Discussion
The EGQI of Jiangxia District from 2017 to 2021 is between 40 and 50, as indicated by . The overall eco-geological environment status grade is medium, with the ecological environment level being medium, and the geological environment condition being good. However, there are constraints that are not suitable for human survival, which implies that there is still room for improvement. Nonetheless, there has been an overall increase of 8.56% during the same period.
As can be seen from , from 2017 to 2019, the overall area of cultivated land and grassland decreased due to the impact of human activities, leading to a decline in the biological abundance index and vegetation coverage in the basin. Additionally, irrational use of water and soil resources resulted in increased land subsidence in the region. However, the implementation of comprehensive environmental treatment policy in Jiangxia District has led to significant improvements in the ecological environment. The policy has increased vegetation coverage, alleviated soil and water loss, and relatively curbed the trend of ecological degradation. For example, farmland has been converted to forest. Furthermore, the COVID-19 outbreak in 2019 has reduced the level of human activities, delaying the development and utilization of eco-geological environments by human activities. Despite this setback, the ecological status has continued to show a relatively stable rising trend.
Since 2017, Jiangxia District has introduced relevant policies and reform plans for various environmental pollution problems, with a focus on waste incineration, sewage treatment, and other aspects. The district has also proposed the policy of improving the living environment of villages and bays and improving the living and production environment. In 2018, Jiangxia District issued relevant documents on building an ecological civilization construction demonstration area. The goal is to build Jiangxia District into an ecological civilization demonstration zone with a reasonable spatial layout and developed economy and ecology within eight years. Consequently, crop straw burning has been regulated and comprehensively utilized to prevent and control air pollution, and air quality has been improved. Relevant treatment of Jinshui River and the construction of Jinshui River sewage treatment plant have also been undertaken. Subsequent work on ‘returning Yuan to Lake’ reflects the concrete implementation of overall water control in Jiangxia District. The work includes flood control, green space, wetland construction, and sewage collection and treatment.
7. Conclusion
In conclusion, this study has developed a comprehensive index system for evaluating the quality of the eco-geological environment in Jiangxia District. By analyzing various environmental factors, including vegetation cover, biological abundance, water network density, land stress, surface deformation, and socio-economic factors, the study has established the EGQI using a grayscale correlation analysis method. The EGQI can be used for quantitative evaluation of eco- geological environment quality by remote sensing.
The results of the study show that the eco-geological environment of Jiangxia District is stable and good from 2017 to 2021, with an overall increase of 8.56% during this period. The comprehensive environmental treatment policy implemented in Jiangxia District has significantly improved the ecological environment, including increasing vegetation coverage, alleviating soil and water loss, and curbing the trend of ecological degradation. Additionally, the implementation of policies to regulate crop straw burning and the construction of sewage treatment plants have helped to prevent and control air pollution and improve air quality.
Despite these improvements, the current situation of eco-geological environment in the study area is still at a moderate level. To further improve the eco-geological environment, it is necessary to continue implementing comprehensive environmental treatment policies and promoting sustainable development in the region. Future research could consider incorporating the pollution stress index and environmental limitation index into the evaluation of eco-geological environment quality to provide a more comprehensive assessment.
Disclosure statement
No potential conflict of interest was reported by the authors.
Data availability statement
The data that support the findings of this study are included in this published article. The datasets generated during and/or analysed during the current study are available from the corresponding author on reasonable request.
Additional information
Funding
References
- Akinyemi OD, Kazeem S, Alatise O, Bada B, Alayaki F. 2023. Assessment of the multilevel correlations of the pollution indicators and lithological vulnerabilities in a passive limestone mining and cement producing environment. Environ Monit Assess. 195(3):375. doi:10.1007/s10661-023-10914-6.
- Azzeh M, Neagu D, Cowling PI. 2010. Fuzzy grey relational analysis for software effort estimation. Empir Software Eng. 15(1):60–90. doi:10.1007/s10664-009-9113-0.
- Boori MS, Choudhary K, Paringer R, Kupriyanov A. 2021. Eco-environmental quality assessment based on pressure-state-response framework by remote sensing and GIS. Remote Sens Appl: soc Environ. 23:100530. doi:10.1016/j.rsase.2021.100530.
- Chi H, Sun J, Zhang C, Miao C. 2022. Remote sensing data processing and analysis for the identification of geological entities. Acta Geophys. 71(3):1565–1577. doi:10.1007/s11600-022-00871-y.
- Cui X, Peng S, Lines LR, Zhu G, Hu Z, Cui F. 2019. Understanding the capability of an ecosystem nature-restoration in coal mined area. Sci Rep. 9(1):19690. doi:10.1038/s41598-019-55935-9.
- Dai FC, Lee CF, Zhang XH. 2001. GIS-based geo-environmental evaluation for urban land-use planning: a case study. Eng Geol. 61(4):257–271. doi:10.1016/S0013-7952(01)00028-X.
- Deng X, Chen G. 2022. Characteristics of water pollution and evaluation of water quality in subsidence water bodies in Huainan Coal Mining areas, China. J Chem. 2022:1–12. doi:10.1155/2022/2857700.
- Dong W, Liu S, Fang Z. 2018. On modeling mechanisms and applicable ranges of grey incidence analysis models. GS. 8(4):448–461. doi:10.1108/GS-04-2018-0019.
- He F, Gu L, Wang T, Zhang Z. 2017. The synthetic geo-ecological environmental evaluation of a coastal coal-mining city using spatiotemporal big data: a case study in Longkou, China. J Cleaner Prod. 142:854–866. doi:10.1016/j.jclepro.2016.07.011.
- Hu J, Ye B, Bai Z, Hui J. 2022. Comparison of the vegetation index of reclamation mining areas calculated by multi-source remote sensing data. Land. 11(3):325. doi:10.3390/land11030325.
- Civil Affairs Department of Hubei Province. Handbook of Administrative Divisions of Hubei Province, Surveying and Mapping Press 2013.
- Jin J, Yan C, Tang Y, Yin Y. 2021. Mine geological environment monitoring and risk assessment in arid and semiarid areas. Complexity. 2021:1–10. doi:10.1155/2021/3896130.
- Kumar V, Yarrakula K. 2022. Environmental impact assessment of limestone quarry using multispectral satellite imagery. Earth Sci Inform. 15(3):1905–1923. doi:10.1007/s12145-022-00845-0.
- Leonenko AV, Krupskaya LT, Usikov VI, Filatova MY, Bubnova M. 2022. Geoecological assessment and environmental monitoring within the boundaries of the impact of the development of gold deposits using GIS technologies. IOP Conf Ser: earth Environ Sci. 1061(1):012016.
- Li H, Zhang P, Cheng Y. 2009. Economic vulnerability of mining city—a case study of Fuxin City, Liaoning Province, China. Chin Geogr Sci. 19(3):211–218. doi:10.1007/s11769-009-0211-0.
- Li P. 2022. Research on ecoenvironmental quality evaluation system based on big data analysis. Comput Intell Neurosci. 2022:5191223. doi:10.1155/2022/5191223.
- Li W, Liu S, Pei Y, He J, Wang Q. 2018. Zoning for eco-geological environment before mining in Yushenfu mining area, northern Shaanxi, China. Environ Monit Assess. 190(10):619. doi:10.1007/s10661-018-6996-5.
- Lu C, Shi L, Fu L, Liu S, Li J, Mo Z. 2023. Urban ecological environment quality evaluation and territorial spatial planning response: application to Changsha, Central China. IJERPH. 20(4):3753. doi:10.3390/ijerph20043753.
- Lu C, Shi L, Zhao X, Li W, Gustavel Q. 2021. Evaluation and planning of urban geological and ecological environment quality. Arab J Geosci. 14(2):71. doi:10.1007/s12517-020-06335-1.
- Martinez-Fernandez C, Wu C-T, Schatz LK, Taira N, Vargas-HernÁNdez JG. 2012. The shrinking mining city: urban dynamics and contested territory. Int J Urban Reg Res. 36(2):245–260. doi:10.1111/j.1468-2427.2011.01094.x.
- Mondal I, Maity S, Das B, Bandyopadhyay J, Mondal AK. 2016. Modeling of environmental impact assessment of Kolaghat thermal power plant area, West Bengal, using remote sensing and GIS techniques. Model Earth Syst Environ. 2(3):139. doi:10.1007/s40808-016-0186-7.
- Naja GM, Rivero R, Davis SE, Van Lent T. 2011. Hydrochemical Impacts of limestone rock mining. Water Air Soil Pollut. 217(1-4):95–104. doi:10.1007/s11270-010-0570-2.
- Nascimento FS, Gastauer M, Souza-Filho PWM, Nascimento WR, Santos DC, Costa MF. 2020. Land cover changes in open-cast mining complexes based on high-resolution remote sensing data. Remote Sensing. 12(4):611. doi:10.3390/rs12040611.
- Nguyen AK, Liou Y-A, Li M-H, Tran TA. 2016. Zoning eco-environmental vulnerability for environmental management and protection. Ecol Indic. 69:100–117. doi:10.1016/j.ecolind.2016.03.026.
- Padmanaban R, Bhowmik AK, Cabral P. 2017. A remote sensing approach to environmental monitoring in a reclaimed mine area. IJGI. 6(12):401. doi:10.3390/ijgi6120401.
- Pakkar MS. 2016. Multiple attribute grey relational analysis using DEA and AHP. Complex Intell Syst. 2(4):243–250. doi:10.1007/s40747-016-0026-4.
- Peng J, Zong M, Hu Y n, Liu Y, Wu J. 2015. Assessing landscape ecological risk in a mining city: a case study in Liaoyuan City, China. Sustainability. 7[(7):8312–8334. doi:10.3390/su7078312.
- Saedpanah S, Amanollahi J. 2019. Environmental pollution and geo-ecological risk assessment of the Qhorveh mining area in western Iran. Environ Pollut. 253:811–820. doi:10.1016/j.envpol.2019.07.049.
- Shao H, Sun X, Lin Y, Xian W, Zhou Y, Yuan L, Qi J. 2021. A method for spatio-temporal process assessment of eco-geological environmental security in mining areas using catastrophe theory and projection pursuit model. Prog Phys Geogr: earth Environ. 45(5):647–668. doi:10.1177/0309133320982542.
- Song W, Song W, Gu H, Li F. 2020. Progress in the remote sensing monitoring of the ecological environment in mining areas. Int J Environ Res Public Health. 17(6). doi:10.3390/ijerph17061846.
- Sun J, Huang J, Wang Q, Zhou H. 2022. A method of delineating ecological red lines based on gray relational analysis and the minimum cumulative resistance model: a case study of Shawan District, China. Environ Res Commun. 4(4):045009. doi:10.1088/2515-7620/ac65e4.
- Surinaidu L, Rao VVSG, Ramesh G. 2013. Assessment of groundwater inflows into Kuteshwar Limestone Mines through flow modeling study, Madhya Pradesh, India. Arab J Geosci. 6(4):1153–1161. doi:10.1007/s12517-011-0421-5.
- Vasanthavigar M, Srinivasamoorthy K, Vijayaragavan K, Rajiv Ganthi R, Chidambaram S, Anandhan P, Manivannan R, Vasudevan S. 2010. Application of water quality index for groundwater quality assessment: thirumanimuttar sub-basin, Tamilnadu, India. Environ Monit Assess. 171(1-4):595–609. doi:10.1007/s10661-009-1302-1.
- Wang N, Li R. 2018. Evaluation of mine geo-environment quality in Shangnan country based on information weight method and set pair analysis. IOP Conf Ser: mater Sci Eng. 381(1):012010. doi:10.1088/1757-899X/381/1/012010.
- Wang S, Bai Z, Lv Y, Zhou W. 2022. Monitoring extractive activity-induced surface subsidence in highland and alpine opencast coal mining areas with multi-source data. Remote Sensing. 14(14):3442. doi:10.3390/rs14143442.
- Xiong Y, Li H, Fu M, Ma X, Wang L. 2022. Evaluation of ecosystem service change patterns in a mining-based city: a case study of Wuan City. Land 11(6):895. doi:10.3390/land11060895.
- Yang Y, Liu S, Zhang K, Bai L, Wu F. 2022. Comprehensive evaluation of ecological environmental quality in small-scale coal mining subsidence area based on hierarchical structure: A case study of Shendong coalfield in Western China. Processes. 10(5):952. doi:10.3390/pr10050952.
- Yang Z, Li J, Zipper CE, Shen Y, Miao H, Donovan PF. 2018. Identification of the disturbance and trajectory types in mining areas using multitemporal remote sensing images. Sci Total Environ. 644:916–927. doi:10.1016/j.scitotenv.2018.06.341.
- Yang Z, Li W, Li X, Wang Q, He J. 2019. Assessment of eco-geo-environment quality using multivariate data: a case study in a coal mining area of Western China. Ecol Indic. 107:105651. doi:10.1016/j.ecolind.2019.105651.
- Yu S, Du W, Zhang X, Hong Y, Liu Y, Hong M, Chen S. 2023. Spatiotemporal Changes in NDVI and Its Driving Factors in the Kherlen River Basin. Chin Geogr Sci. 33(2):377–392. doi:10.1007/s11769-023-1337-1.
- Yu Y, Chen S-E, Deng K-Z, Wang P, Fan H-D. 2018. Subsidence mechanism and stability assessment methods for partial extraction mines for sustainable development of mining cities—a review. Sustainability 10(2):113 doi:10.3390/su10010113.
- Zhang X, Liu Y, Chen X, Long L, Su Y, Yu X, Zhang H, Chen Y, An S. 2022. Analysis of spatial and temporal changes of vegetation cover and its driving forces in the Huainan mining area. Environ Sci Pollut Res Int. 29(40):60117–60132. doi:10.1007/s11356-022-19921-5.