
 ?Mathematical formulae have been encoded as MathML and are displayed in this HTML version using MathJax in order to improve their display. Uncheck the box to turn MathJax off. This feature requires Javascript. Click on a formula to zoom.
Abstract
To quantitatively analyze the spatial distribution of soil organic matter (SOM) content and its main influencing factors in the Huangshui River Basin, Qinghai Province, China, a total of 13 factors including topography, climate, soil properties, and vegetation cover were selected. The influence of these factors on the spatial distribution of SOM content was analyzed using the geographical detector model and the Pearson correlation coefficient method. The results showed that the average SOM content in the cultivated soil layer of the Huangshui River Basin was 28.38 g·kg−1. The results of factor detection and Pearson correlation analysis indicated that the three dominant factors causing differences in the spatial distribution of SOM content were mean annual temperature, altitude, and soil pH. Furthermore, SOM content was negatively correlated with temperature and positively correlated with elevation. When the factors interacted, they exhibited a type of bi-enhance or nonlinear-enhance. The interaction between two factors improved the explanatory power of SOM, indicating the complexity of factors causing spatial distribution differences in SOM. This study provides a favorable basis for precision fertilization, soil improvement, and of soil quality improvement in the Huangshui River Basin.
1. Introduction
Soil nutrients are a critical regulator of ecosystem responses to global change, and their role in regulating ecosystem structure and function is widely recognized (Sundert et al. Citation2020). Soil organic matter (SOM) is a crucial indicator for assessing soil fertility and quality, and it is a major component of the terrestrial carbon cycle (Xu XB et al. Citation2023). Furthermore, SOM has a strong association with global warming (Ondrasek et al. Citation2019; Chen SC et al. Citation2022). Although SOM content accounts for a small fraction of soil composition, it plays a crucial role in promoting vegetation growth and augmenting soil fertility. The analysis of factors influencing the spatial distribution of SOM content is vital for promoting sustainable agricultural development (Heil et al. Citation2022; Wang Q et al. Citation2022).
Soil nutrients are important soil attributes, and among them, SOM content determines soil structure and cation exchange capacity, thus influencing agricultural productivity and soil security (Xu YM, Li, et al. Citation2022; Yan et al. Citation2022; Chen SC et al. Citation2022; Tibhirine et al. Citation2023). In recent years, there has been an increasing number of studies on the factors influencing the regional spatial distribution of SOM, and the mechanisms by which different factors affect the spatial distribution of SOM content have received considerable attention. Research has shown that there are differences in SOM content between different regions in fields (Xia et al. Citation2022; Bouasria et al. Citation2022). Furthermore, with the impact of human activities, changes in land use types have a significant effect on the spatial distribution of SOM content (Goswami et al. Citation2020; Nadal-Romero et al. Citation2023; John et al. Citation2022). Inherent soil properties and agricultural management practices are factors that affect the dynamic changes of SOM content (Richardson et al. Citation2023). Crop rotation, changes in fertilizer application and agricultural management systems, among others, can influence the spatial distribution of SOM content (Han et al. Citation2022; Ning et al. Citation2022). Straw incorporation is a common agricultural management practice (Yan et al. Citation2022; Bouasria et al. Citation2021), can enhance soil physicochemical properties, which may affect SOM content.
In addition to the influence of human activities, environmental factors also impact the spatial distribution of SOM content. Research has demonstrated that SOM content increases with increasing elevation (Raluca et al. Citation2022). Considering altitude, slope, and different planting methods together, the explanation for the variation of SOM content can reach up to 73.8% (Huynh et al. Citation2022), indicating that the combined influence of human activities and natural environmental factors has a significant impact on the spatial distribution characteristics of SOM. Climate change also affects SOM content. The temperature factor, through its impact on enzyme activity, controls the rate of organic matter decomposition, thereby affecting soil fertility (Du et al. Citation2021). Meanwhile, precipitation can effectively alleviate agricultural drought, improve soil moisture content, and promote the utilization of SOM, thereby playing an important role in the variation of SOM content (Chen QY et al. Citation2020; Wang JF and Lu 2017).
In summary, various influencing factors have a significant impact on the spatial distribution of SOM. Geographical detector (Wang JF et al. Citation2010), as a powerful tool for exploring the relationships between geographic phenomena and driving factors, has been applied in multiple fields, including spatial heterogeneity of soil heavy metals (Liang et al. Citation2023; Wang GJ et al. Citation2022), land use change (Xu DH, Zhang, et al. Citation2022), land desertification (Wang YF et al. Citation2022), and eco-environmental quality (Long et al. Citation2023). Numerous researchers have revealed that the dominant factors contributing to the spatial heterogeneity of SOM are mean annual temperature, soil type, and land use type using geographical detector (Gangopadhyay and Reddy Citation2022; Gao et al. Citation2022; Wang Q et al. Citation2022). However, it is worth noting that the main controlling factors influencing the spatial distribution of SOM may differ with variations in geographic location and research scale (Zhao et al. Citation2023; Wiesmeier et al. Citation2019). Additionally, there is a lack of research on the analysis of influencing factors for SOM spatial distribution at the watershed scale. Therefore, analyzing the spatial variation characteristics and influencing factors of SOM in the Huangshui River Basin, China, is particularly important for watershed-scale agricultural management and precision fertilization.
When conducting a principal factor analysis using Geographical detector, it is necessary to discretize continuous variables. Previous research on exploring the driving factors of SOM spatial heterogeneity using geographical detector has often relied on empirical categorization of continuous variables, which may overlook the quantitative analysis of different discretization methods and variable categorization on the spatial heterogeneity of SOM at the watershed scale. The novelty of this study lies in the utilization of the optimal parameters-based geographical detector (OPGD) model (Song et al. Citation2020) to analyze the impact of five different discretization methods, including equal interval method, natural breaks method, quantiles method, geometrical interval method, and standard deviation method (SD), on the spatial distribution characteristics of SOM. The study aims to comprehensively explore the main driving factors and types of interaction that contribute to the spatial heterogeneity of SOM.
2. Materials and methods
2.1. Overview of the study area
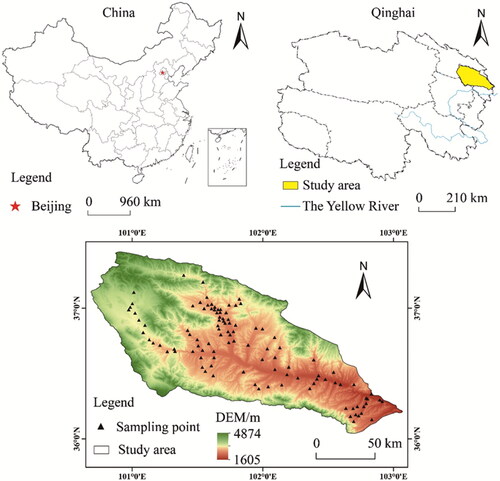
The Huangshui River is an important tributary of the of the Yellow River in its upper reaches. Located in the northeastern part of Qinghai Province, China, the Huangshui River Basin lies in the transitional zone between the Qinghai-Tibet Plateau and the Loess Plateau. The basin includes 4 districts and 3 counties of Xining city, 4 counties of Haidong City and part of Haiyan County in Haibei Prefecture, covering a significant portion of Qinghai Province in terms of politics, economy, and population. It is known as the “Mother River” of Qinghai Province and is the most economically developed region in the province. The basin is characterized by a continental climate, with high elevation and significant variations in topography, averaging around 3000 m in altitude. The basin experiences arid and low-rainfall conditions throughout the year, with an average annual temperature of around 8 °C and an average annual precipitation of approximately 400 mm (Wang PQ et al. Citation2022). Due to its relatively high elevation and limited precipitation, the main agricultural practices in the basin are dryland farming, focusing on crops such as corn, spring wheat, and rapeseed. An overview of the study area is shown in .
Figure 1. The geographical location of the study area and distribution of sample points.
2.2. Soil sample collection
Taking into account the ease of sampling and the convenience of transportation in the study area, a total of 110 soil samples were collected from the topsoil layer (0–20 cm) in the study area in April 2021. The latitude and longitude information of the sampling points was recorded using a Global Positioning System (GPS) receiver. The collected soil samples were naturally air-dried, impurities were removed, and they were subsequently sieved. In the laboratory, the organic matter content and its pH value of the samples were determined. Preprocessing was applied to the sampling data, and 3 soil samples were excluded due to outliers. Thus, a total of 107 soil samples were used for the study. The distribution of the sampling points is shown in .
2.3. Other data sources
The Digital Elevation Model (DEM) used in this study was obtained from the Geospatial Data Cloud platform of the Chinese Academy of Sciences (https://www.gscloud.cn/), with a resolution of 30 m. The land use data originated from the 30-m global surface land cover data set (Jun et al. Citation2014) (GlobeLand 30, http://www.globeland30.org/). The soil type data were obtained from the Natural Environment and Data Center of the Chinese Academy of Sciences (https://www.resdc.cn/). The main cultivated soil types in the study area include castanozems, chernozems, dark felty soils, and sierozems. The classification of soil types is based on the “Chinese Soil Classification System,” which provides the names and codes of soil classification in China. The climate data was sourced from the National Earth System Science Data Center, National Science and Technology Infrastructure of China (http://www.geodata.cn) with a spatial resolution of 1 km (Peng et al. Citation2019). The NDVI data was obtained from the National Ecosystem Science Data Center, National Science and Technology Infrastructure of China (http://www.nesdc.org.cn) with a spatial resolution of 30 m (Yang et al. Citation2019).
2.4. Data processing
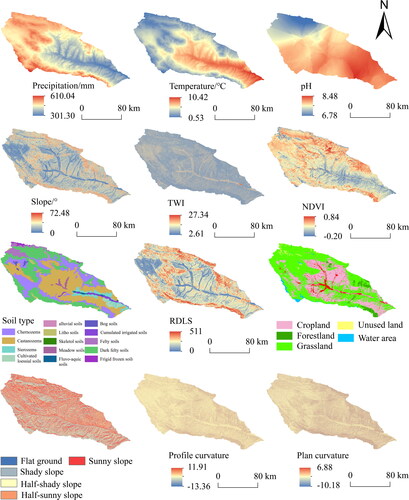
Five factors were extracted from the DEM data of the Huangshui River Basin, including slope, aspect, curvature, relief degree of land surface (RDLS), and topographic wetness index (TWI). The land use type data was reclassified into six categories, namely cropland, forestland, grassland, water area, construction land, and unused land. The climate data obtained in this study had a spatial resolution of 1 km. To match the spatial resolution of other factors, the temperature and precipitation data were resampled to a resolution of 30 m. Subsequently, the corresponding temperature and precipitation values were extracted for each sampling point. To facilitate the classification of continuous variables, the soil pH values measured at each sampling point were interpolated into spatially continuous data using inverse distance weighting interpolation. The spatial distribution of the factors used in this study is shown in .
Figure 2. Spatial distribution of influential factors.
2.5. Analytical method
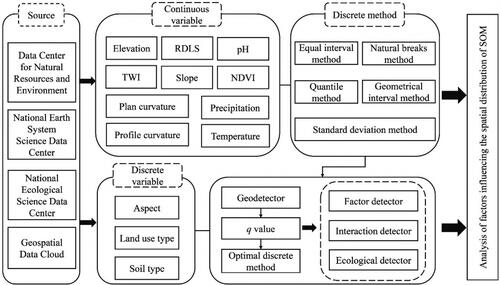
In this study, the terrain factors, climate factors, soil attribute factors, vegetation coverage factors, and human activity factors were initially obtained for the Huangshui River Basin. Subsequently, the influence factors corresponding to the sampling points were extracted based on the latitude and longitude information of the measured soil samples (continuous variables without discretization). Then, five different methods, namely the equal interval method, natural breaks method, quantile method, geometrical interval method, and standard deviation method, were employed to discretize the continuous variables. Finally, the Geodetector and Pearson correlation analysis methods were used to analyze the influential factors of the spatial distribution differences of the SOM in the Huangshui River Basin, Qinghai Province, China. The technical flowchart is illustrated in .
Figure 3. Methodology flowchart.
2.5.1. Geographic detector model
Geographical detector is a statistical method used to study the spatial heterogeneity of a given phenomenon in geographical space and reveal the underlying driving forces. It is a spatial differentiation approach. The geographical detector model assumes that if an independent variable (x) has an effect on a dependent variable (y), indicating a correlation between them, then they will show similarity in their spatial distribution. The Geographical detector consists of four detectors: risk detector, factor detector, ecological detector, and interaction detector.
(1) The factor detector is used to detect the spatial heterogeneity of SOM and the extent to which the factor explains that spatial heterogeneity (Wang JF and Xu Citation2017; Zhu et al. Citation2020). The explanatory power of the influence factor on the spatial differentiation of the SOM is measured by the Geodetector q-statistic (Wang JF et al. Citation2016), which takes values between 0 and 1. When the value of q-statistic is larger, it indicates that the independent variable explains the dependent variable to a stronger extent, and conversely, it indicates that the independent variable explains the dependent variable to a weaker extent, based on the q-statistic that explains the dominant factor of spatial variation in SOM content in the study area. The calculation formula is as follows:
(1)
(2) Interaction detection is to identify the degree of explanation of the dependent variable when different influencing factors act simultaneously, i.e., to analyze whether the interaction between factors enhances or weakens the explanatory power of the dependent variable, and the types of interactions can be divided into the following categories ().
(3) The ecological detector is a comparison of whether the effect of any two factors on the spatial distribution of SOM content is significantly different. The F-statistic is used to measure this, and the formula is shown below.
Table 1. Type of interaction results.
2.5.2. Correlation analysis
Correlation analysis is a statistical analysis method used to measure the linear relationship between two variables, and it is widely utilized in various fields (Deng et al. Citation2023; Ejaz et al. Citation2023). In order to analyze the similarity between 13 influencing factors and the spatial distribution of SOM, this study employed the Pearson correlation coefficient method to analyze the influential factors of the spatial distribution differences of SOM.
2.5.3. Discretization methods
Equal interval method divides the range of values of the influencing factor into equal intervals, suitable for situations where the data distribution is relatively uniform. Natural breaks method identifies breakpoints where the factor changes in spatial distribution, and categorizes the influencing factor into different classes. Quantile method divides the factor into different categories based on percentiles. Geometrical interval method applies logarithmic transformation to the factor and then categorizes it into different classes. Standard deviation method divides the dataset based on the standard deviation of the factor, which effectively reflects the degree of variability in the factor.
3. Results and analysis
3.1. Descriptive statistical analysis of SOMcontent
displays the descriptive statistical analysis results of the SOM content in the study area. According to the statistical results, the SOM content in the Huangshui River Basin ranges from 4.31 to 59.79 g·kg−1, with an average content of 28.38 g·kg−1. The SOM content of the study area is at a moderate level according to the nutrient classification standards of the Second National Soil Survey. The coefficient of variation (CV) can reflect the spatial variability of the SOM content. When CV < 25%, the SOM shows weak variability; when 25% < CV < 75%, it indicates moderate variability; and when CV > 75%, it indicates strong variability. The coefficient of variation for SOM in the study area is 39.36%, indicating a moderate level of variability (Zhang et al. Citation2022).
Table 2. Descriptive statistical analysis of SOM in the study area.
3.2. The spatial distribution characteristics of SOM
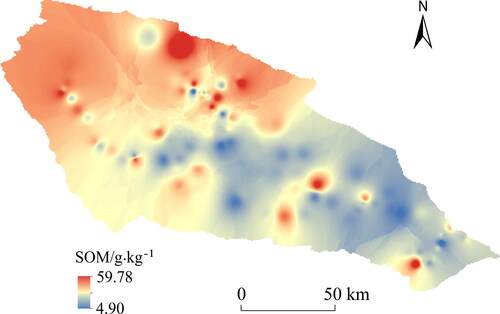
The spatial distribution characteristics of SOM content in the study area were obtained through inverse distance weighting interpolation, as shown in . The interpolated SOM content ranges from 4.90 to 59.78 g·kg−1, with higher values observed in the northern and western parts of the study area compared to the southern and eastern parts. The northwestern region of the study area exhibits higher elevations than the southeastern region, indicating a positive correlation between SOM content and elevation. This finding is consistent with the results of previous studies conducted by Zhao et al. (Citation2023), suggesting that higher elevations correspond to lower temperatures and sparse vegetation, which hinder SOM decomposition and result in higher SOM content.
Figure 4. Spatial distribution of SOM content.
3.3. Discretization of continuous variables
In this paper, five methods were utilized to discretize continuous variables, and the optimal discretization method and number of categories were selected based on the explanatory power of the factors on SOM (q-statistic). The continuous variables were divided into different numbers of categories ranging from 3 to 8, as shown in . It can be observed that there are significant differences in q-statistic among different discretization methods and numbers of categories. The q-statistic of precipitation shows fluctuates with an increasing number of classifications. The largest q statistic (0.13) is achieved when the precipitation factor is classified into 8 categories using the geometric interval method. Similarly, for the temperature factor, the q-statistic increases as the number of categories increases when the geometric interval method is applied. Other discretization methods and numbers of categories result in fluctuations in the q-statistic. The maximum q-statistic (0.31) for the temperature factor is attained when it is divided into 8 categories using the quantile method. The pH factor exhibits a similar pattern to temperature, with the maximum q-statistic obtained when using the quantile method. The choice of discretization method has a significant impact on the q-statistic for the Slope factor, with both the geometric interval and equal interval methods yielding higher q-values compared to other discretization methods.
Figure 5. Continuous variable q-statistics change.
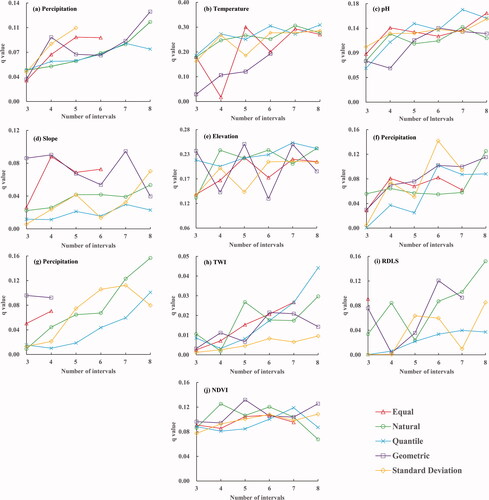
When the number of categories for the elevation factor is set to 7, the q-statistic reaches its maximum value. The profile curvature factor exhibits an increasing trend in the q-statistic as the number of categories increases, with the SD discretization method yielding the highest q-statistic (0.14). The q-statistic variation for the plan curvature is similar to that of the profile curvature, but the natural breakpoint method produces the highest q-statistic (0.16) when discretizing the plan curvature factor. The influence of TWI on SOM is minimal, and the q-statistic shows little variation among different discretization methods. For the RDLS factor, there is little change in q-statistic when using the equal interval and quantile methods, while the remaining discretization methods result in significant q-statistic fluctuations. The q-statistic for the NDVI factor remains relatively stable, and different discretization methods have minimal impact on its q-statistic. In conclusion, different discretization methods have a significant impact on the q-statistic, and different continuous variables require the use of appropriate discretization methods to achieve the maximum q-statistic.
3.4. Factor analysis of the spatial distribution of SOM content
The factor detector, interaction detector and ecological detector in the Geodetector were used to quantitatively analyze the 13 influencing factors leading to the spatial variation of SOM content in the study area, and to explore the dominant factors of the spatial variation of SOM content.
3.4.1. Analysis of single factor results
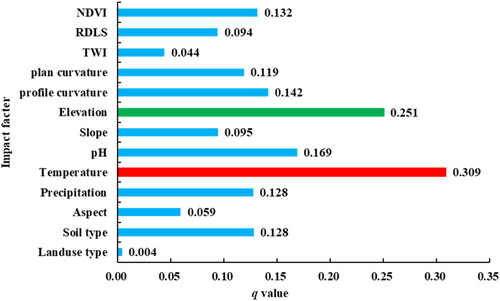
Factor detector was used to analyze the influence of 13 factors including elevation, aspect, slope, NDVI, soil pH, soil type, temperature, precipitation, land use type, TWI, RDLS, plan curvature, and profile curvature on SOM content. The results of the factor detection are shown in . The influence of 13 factors on SOM content in the study area ranged from 0.042 to 0.309, indicating variations in the impact of different factors on the spatial distribution of SOM content. Temperature, elevation and soil pH had the highest explanatory power on SOM with q-statistics of 0.309, 0.251 and 0.169, respectively. The significant impact of temperature on the spatial distribution of SOM is attributed to the increase in enzyme activity and microbial activity in soil as temperature rises, which can affect the decomposition rate of soil organic matter and thus influence SOM content in the study area (Alkorta et al. Citation2017; Hu et al. Citation2023). Soil pH and Profile curvature variables explained SOM spatial distribution respectively with q-statistics of 0.169 and 0.141. The NDVI factor, representing vegetation growth, had a q-statistic of 0.132. Land use type, TWI, and aspect had the lowest influence on SOM, with q-statistic of 0.004, 0.044, and 0.059, respectively. In summary, elevation, temperature and soil pH are the dominant factors affecting the spatial distribution of SOM in the Huangshui River Basin, and variations in elevation and temperature lead to differences in SOM spatial distribution. On the other hand, land use type and TWI have the lowest effect on SOM.
Figure 6. Factor detection results.
3.4.2. Factor interaction results
Factors contributing to spatial variation in regional variables often involve not just one, but multiple factors working in conjunction. Therefore, an interaction detector was utilized to analyze the combined effects of two factors on the spatial distribution of SOM content, and the results are presented in . It can be observed from the that the explanatory power of the spatial distribution of SOM is enhanced when two factors interact simultaneously. When individual factors operate alone, their explanatory capacity for SOM content spatial variation is not notably high. However, when elevation and plan curvature interact, the q-statistic reaches 0.591, which is significantly higher than the impact of elevation (q = 0.251) or plan curvature (q = 0.119) when acting individually. The interaction between elevation and pH yields an explanatory power of 0.547 for SOM, whereas the interaction between TWI and temperature results in an explanatory power of 0.542 for SOM. After the interaction between NDVI and elevation, the explanatory power is significantly improved, with a q-statistic of 0.444. This can be attributed to the fact that NDVI reflects vegetation coverage, and vegetation growth relies on suitable temperatures and sufficient precipitation, both of which are determined by variations in elevation within the study area. Hence, the interaction between the NDVI factor and other factors enhances the explanatory capacity for SOM. The explanatory power of aspect is also enhanced after interaction, such as with aspect and temperature (q = 0.477). This is mainly because different aspects lead to varying lighting conditions, which, combined with temperature fluctuations, subsequently affect SOM content. The aforementioned analyses indicate that the spatial distribution of SOM is influenced by multiple interacting factors. While the individual influence of a single factor on SOM spatial distribution is limited, their combined effects exhibit a bilinear-enhancing interaction type.
Table 3. Interaction detection and ecological detection results.
3.4.3. Analysis of variance between factors
The ecological detection results depicted in show that each pair of influencing factors have significant effects on SOM spatial distribution. Among them, the temperature factor shows significant differences with other factors except for elevation. This further indicates that the dominant factors affecting the spatial distribution of SOM are temperature and elevation.
3.5. Comparison of the results of geographic detector and Pearson correlation analysis
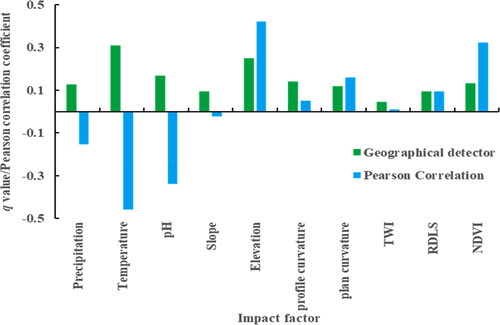
The Pearson correlation coefficient method is a common method to analyze the correlation between two variables, and this paper compares the results of the Geodetector model factor detection with the Pearson correlation coefficient. Since Pearson correlation analysis requires continuous variables, three discrete influencing factors of land use type, soil type and slope direction are removed, and the results of the remaining influencing factors are shown in . The Pearson correlation analysis method can reflect the positive and negative correlation between the influence factors and SOM content, while Geodetector can only reflect the magnitude of correlation. For example, there is a significant negative correlation between the temperature factor and SOM content. This indicates that higher the temperatures result in faster decomposition of SOM content, which, in turn, causes low SOM content levels. The Geodetector q-statistic takes the value of 0–1, which can only reflect the relative influence magnitude.
Figure 7. Comparison of Pearson and geographic probe analysis of organic matter and impact factor correlation results.
4. Discussion
4.1. Influence of environmental factors on the spatial distribution of SOM content
Terrain factors, as the primary environmental influencing factors, play a dominant role in the spatial distribution of SOM content. The study conducted by Wicaksono et al. (Citation2019) demonstrated a significant effect of elevation on the spatial variation of SOM (p < 0.05). Among the three topographic factors, namely elevation, aspect and slope, elevation had the highest explanatory power for the spatial distribution of SOM, followed by slope and aspect. The influence of elevation on the spatial distribution of SOM was evident due to variations in altitude, resulting in changes in temperature and precipitation, which in turn led to differences in the spatial distribution of SOM (Dong et al. Citation2018). From the analysis of interaction factors, it can be observed that the explanatory power of elevation and other terrain factors increases when they interact, especially the interaction between elevation and plan curvature, which has a higher explanatory power for SOM content compared to the individual effect of curvature. The explanatory power of elevation and TWI interaction for SOM content reached 0.463, both higher than the q-values obtained when the environmental factors acted individually. In the Pearson correlation analysis between SOM and terrain factors (), elevation and NDVI showed a significant positive correlation with the spatial distribution of SOM, similar to the findings of Wu et al. (Citation2021). The variation in terrain resulted in differences in vegetation growth, coupled with aspect and slope, which influence solar radiation and water-thermal conditions, affecting soil microbial activity and soil enzyme activity, thereby leading to differences in SOM. Correlation analysis between SOM and climate factors () revealed a significant negative correlation between SOM and temperature factors; as the average annual temperature increased, soil respiration and organic matter decomposition rate accelerated, consistent with the studies conducted by Li et al. (Citation2020) and Wen et al. (Citation2023).
4.2. Influence of land use type on SOM content
Different land use and agricultural management methods have important effects on soil properties (Tamburi et al. Citation2020), and understanding the influence of land use change on the spatial distribution of SOM is crucial. Land use types fall under categorical variables, and their impact on the spatial distribution of SOM can be analyzed using geographical detector. When land use types interact with temperature, they show a high explanatory power (q = 0.332) for the spatial distribution of SOM content. Land use types are the major anthropogenic factors influencing SOM content, particularly with a significant impact on SOM content in cultivated lands. In contrast, forested areas and grasslands at higher elevations experience less human disturbance, have richer vegetation, and relatively higher SOM content compared to other regions. Land use can also influence soil erosion rates, consequently affecting the deposition and loss of soil in different areas, leading to variations in SOM content (Komolafe et al. Citation2021). With the continuous advancement of modernized agriculture, increasing fertilizer application and irrigation have a significant impact on the spatial distribution of SOM content. It is evident that the influencing factors of SOM content spatial distribution need to be considered from multiple perspectives to quantitatively analyze the explanatory power of various factors on the spatial variability of SOM.
5. Conclusion
This study analyzed the factors that influence the spatial distribution of SOM content in the arable layer based on the optimal parameters-based geographical detector model. The results obtained show that the SOM content in the cultivated layer of the Huangshui River Basin in China ranged from 4.31 to 59.79 g·kg−1, with an average content of 28.38 g·kg−1, indicating medium levels. The coefficient of variation was at 39.36%, which was at a moderate degree of variability.
The continuous variables were discretized by different methods with different q-statistic. For comparison, the discretization method and the number of classifications where the q-statistic is the largest are selected to better analyze the main controlling factors of the spatial distribution of the SOM content. Among the 13 influencing factors, the temperature has the highest explanatory power of the SOM with an explanatory degree of 0.309. The elevation factor is followed by the SOM with an explanatory power of 0.251.
Influence factor two by two interaction, the role of the type of performance for the bi-enhance or nonlinear-enhance, two factors interact with each other when the explanation of the spatial distribution of SOM is greater than that of a single factor role, the interaction will significantly increase the degree of interpretation of the Huangshui River Basin SOM. The results indicate that the spatial distribution characteristics of SOM content are jointly determined by multiple factors. Based on the geodetector model, this paper analyzes the influencing factors of the spatial distribution of SOM in farmland in Huangshui River Basin, China, and provides a theoretical basis for farmland soil improvement and quality improvement in this region.
Author’s contributions
Zunfang Liu: Writing-Original Draft, Visualization, Conceptualization, Methodology, Software. Haochuan Lei: Writing-Review and Editing, Supervision, Project administration, Funding acquisition. Haiyan Sheng: Supervision, Resources. Yizhou Wang: Visualization.
Disclosure statement
All authors declare that they have no known competing financial interests or personal relationships in this paper.
Data availability statement
All data can be obtained from the authors on reasonable request.
Additional information
Funding
References
- Alkorta I, Epelde L, Garbisu C. 2017. Environmental parameters altered by climate change affect the activity of soil microorganisms involved in bioremediation. FEMS Microbiol Lett. 364(19):fnx200. doi: 10.1093/femsle/fnx200.
- Bouasria A, Ibno Namr K, Rahimi A, Ettachfini EM. 2021. Geospatial assessment of soil organic matter variability at Sidi Bennour District in Doukkala Plain in Morocco. J Ecol Eng. 22(11):120–130. doi: 10.12911/22998993/142935.
- Bouasria A, Ibno Namr K, Rahimi A, Ettachfini EM, Rerhou B. 2022. Evaluation of Landsat 8 image pansharpening in estimating soil organic matter using multiple linear regression and artificial neural networks. Geo-Spatial Inf Sci. 25(3):353–364. doi: 10.1080/10095020.2022.2026743.
- Chen QY, Niu B, Hu YL, Luo TX, Zhang GX. 2020. Warming and increased precipitation indirectly affect the composition and turnover of labile-fraction soil organic matter by directly affecting vegetation and microorganisms. Sci Total Environ. 714:136787. doi: 10.1016/j.scitotenv.2020.136787.
- Chen SC, Arrouays D, Leatitia MV, Poggio L, Minasny B, Roudier P, Libohova Z, Lagacherie P, Shi Z, Hannam J, et al. 2022. Digital mapping of GlobalSoilMap soil properties at a broad scale: a review. Geoderma. 409:115567. doi: 10.1016/j.geoderma.2021.115567.
- Deng JT, Pan SJ, Zhou MG, Gao W, Yan YC, Niu ZJ, Han WT. 2023. Optimum sampling window size and vegetation index selection for low-altitude multispectral estimation of root soil moisture content for Xuxiang Kiwifruit. Agric Water Manage. 282:108297. doi: 10.1016/j.agwat.2023.108297.
- Dong Y, Zhang YQ, Liu CC. 2018. Study on soil nutrient spatial patterns and their driving factors in Jinzhong. Acta Ecologica Sinica. 38(23):8621–8629.
- Du ZB, Gao BB, Ou C, Du ZR, Yang JY, Batsaikhan B, Dorjgotov B, Yun WJ, Zhu DH. 2021. A quantitative analysis of factors influencing organic matter concentration in the topsoil of black soil in Northeast China based on spatial heterogeneous patterns. IJGI. 10(5):348. doi: 10.3390/ijgi10050348.
- Ejaz N, Bahrawi J, Alghamdi KM, Rahman KU, Shang S. 2023. Drought monitoring using Landsat derived indices and Google Earth Engine platform-A case study from Al-Lith watershed, Kingdom of Saudi Arabia. Remote Sensing. 15(4):984. doi: 10.3390/rs15040984.
- Gangopadhyay SK, Reddy GPO. 2022. Spatial variability of soil nutrients under the rice-fallow system of eastern India using geostatistics and Geographic Information System. J Soil Water Conserv. 21(1):55–66. doi: 10.5958/2455-7145.2022.00007.8.
- Gao HR, Zhou Y, Wang L, Wu ZX. 2022. Spatial pattern and influencing factors of soil organic matter based on geodetector model: taking Zaoyang city as an example. Resour Environ Yangtze Basin. 31(1):166–178.
- Goswami C, Singh NJ, Handique BK. 2020. Effect of soil orders and land uses on available soil nutrients in Meghalaya, India. IJPSS. 32(3):62–71. doi: 10.9734/ijpss/2020/v32i330260.
- Han LL, Lu YC, Ma W, Meng JH. 2022. Spatial patterns of soil organic matter, nitrogen, phosphorus and potassium in a subtropical forest and its implication for forest management. J Resour Ecol. 13(3):417–427.
- Heil J, Jörges C, Stumpe B. 2022. Fine-scale mapping of soil organic matter in agricultural soils using UAVs and machine learning. Remote Sens. 14(14):3349. doi: 10.3390/rs14143349.
- Huynh CV, Nguyen PT, Pham TG, Nguyen HT, Nguyen MTH, Tran PT. 2022. Evaluation of soil organic matter content under topographic influences in agroforestry ecosystems: a study in central Vietnam. Eurasian Soil Sc., 8. 55: 1041–1051. doi: 10.1134/S106422932208004X.
- Hu JX, Du ML, Chen J, Tie LH, Zhou SX, Buckeridge KM, Cornelissen JHC, Huang C, Kuzyakov Y. 2023. Microbial necromass under global change and implications for soil organic matter. Glob Chang Biol. 29(12):3503–3515. doi: 10.1111/gcb.16676.
- John K, Bouslihim Y, Bouasria A, Razouk R, Hssaini L, Isong IA, Ait M’barek S, Ayito EO, Ambrose-Igho G. 2022. Assessing the impact of sampling strategy in random forest-based predicting of soil nutrients: a study case from northern Morocco. Geocarto Int. 37(26):11209–11222. doi: 10.1080/10106049.2022.2048091.
- Jun C, Ban YF, Li SN. 2014. Open access to Earth land-cover map. Nature. 514(7523):434. doi: 10.1038/514434c.
- Komolafe AA, Olorunfemi IE, Oloruntoba C, Akinluyi FO. 2021. Spatial prediction of soil nutrients from soil, topography and environmental attributes in the northern part of Ekiti State, Nigeria. Remote Sens Appl Soc Environ. 21:100450. doi: 10.1016/j.rsase.2020.100450.
- Li YQ, Ma JW, Xiao C, Li YJ. 2020. Effects of climate factors and soil properties on soil nutrients and elemental stoichiometry across the Huang–Huai–Hai River Basin, China. J Soils Sediments. 20(4):1970–1982. doi: 10.1007/s11368-020-02583-6.
- Liang JH, Liu ZY, Tian YQ, Shi HD, Fei Y, Qi JX, Mo L. 2023. Research on health risk assessment of heavy metals in soil based on multi-factor source apportionment: a case study in Guangdong Province, China. Sci Total Environ. 858(Pt 3):159991. doi: 10.1016/j.scitotenv.2022.159991.
- Long Y, Jiang FG, Deng ML, Wang TH, Sun H. 2023. Spatial-temporal changes and driving factors of eco-environmental quality in the Three-North region of China. J Arid Land. 15(3):231–252. doi: 10.1007/s40333-023-0053-0.
- Nadal-Romero E, Khorchani M, Gaspar L, Arnáez J, Cammeraat E, Navas A, Lasanta T. 2023. How do land use and land cover changes after farmland abandonment affect soil properties and soil nutrients in Mediterranean mountain agroecosystems? Catena. 226:107062. doi: 10.1016/j.catena.2023.107062.
- Ning LX, Cheng CX, Lu X, Shen S, Zhang L, Mu SM, Song YS. 2022. Improving the prediction of soil organic matter in arable land using human activity factors. Water. 14(10):1668. doi: 10.3390/w14101668.
- Ondrasek G, Begić HB, Zovko M, Filipović L, Meriño-Gergichevich C, Savić R, Rengel Z. 2019. Biogeochemistry of soil organic matter in agroecosystems & environmental implications. Sci Total Environ. 658:1559–1573. doi: 10.1016/j.scitotenv.2018.12.243.
- Peng SZ, Ding YX, Liu WZ, Li Z. 2019. 1 km monthly temperature and precipitation dataset for China from 1901 to 2017. Earth Syst Sci Data. 11(4):1931–1946. doi: 10.5194/essd-11-1931-2019.
- Raluca E, Lucian D, Diana V, Radu V. 2022. Does the slope aspect influence the soil organic matter concentration in forest soils? Forests. 13(9):1472.
- Richardson GS, Ruark MD, Radatz T, Radatz A, Cooley E, Silva EM, Augarten AJ, Zhu J, Zegler CH. 2023. The influence of inherent soil factors and agricultural management on soil organic matter. Ecosphere. 14(3):e4459. doi: 10.1002/ecs2.4459.
- Song YZ, Wang JF, Ge Y, Xu CD. 2020. An optimal parameters-based geographical detector model enhances geographic characteristics of explanatory variables for spatial heterogeneity analysis: cases with different types of spatial data. GIScience Remote Sens. 57(5):593–610. doi: 10.1080/15481603.2020.1760434.
- Sundert KV, Radujković D, Cools N, Vos BD, Etzold S, Fernández-Martínez M, Janssens IA, Merilä P, Peñuelas J, Sardans J, et al. 2020. Towards comparable assessment of the soil nutrient status across scales-review and development of nutrient metrics. Glob Chang Biol. 26(2):392–409. doi: 10.1111/gcb.14802.
- Tamburi V, Shetty A, Shrihari S. 2020. Geostatistical analysis on spatial variability of soil nutrients in vertisols of Deccan Plateau region of North Karnataka, India. Int J Math, Eng, Manag Sci. 5(2):283–295. doi: 10.33889/IJMEMS.2020.5.2.023.
- Tibhirine Z, Ibno Namr K, Bouasria A, El Bourhrami B, Ettayeb H. 2023. Geospatial and temporal assessment of the variability of soil organic matter and electrical conductivity in irrigated semi-arid area. Geol Ecol LandscapesLandsc :1–12. doi: 10.1080/24749508.2023.2179748.
- Wang GJ, Peng WF, Zhang DM, Luo YM. 2022. Detection of dominant factors and interactions of spatial heterogeneity of soil heavy metals in northern Chengdu Plain, western China. Arab J Geosci. 15(7):592. doi: 10.1007/s12517-022-09603-4.
- Wang JF, Li XH, Christakos G, Liao YL, Zhang T, Gu X, Zheng XY. 2010. Geographical detectors-based health risk assessment and its application in the neural tube defects study of the Heshun region, China. Int J Geogr Inf Sci. 24(1):107–127. doi: 10.1080/13658810802443457.
- Wang JF, Xu CD. 2017. Geodetector: principle and prospective. Acta Geographica Sinica. 72(1):116–134.
- Wang JF, Zhang TL, Fu BJ. 2016. A measure of spatial stratified heterogeneity. Ecol Indic. 67:250–256. doi: 10.1016/j.ecolind.2016.02.052.
- Wang PQ, Li RJ, Liu DJ, Wu YM. 2022. Dynamic characteristics and responses of ecosystem services under land use/land cover change scenarios in the Huangshui River Basin, China. Ecol Indic. 144:109539. doi: 10.1016/j.ecolind.2022.109539.
- Wang Q, Chang QR, Luo LL, Jiang DY, Huang Y. 2022. Spatiotemporal variation and driving factors for cultivated soil organic matter in Shanxi province. Trans Chinese Soc Agric Mach. 53(11):349–359.
- Wang YF, Guo EL, Kang Y, Ma HW. 2022. Assessment of land desertification and its drivers on the Mongolian plateau using intensity analysis and the geographical detector technique. Remote Sens. 14(24):6365. doi: 10.3390/rs14246365.
- Wang YT, Lu JB. 2017. A review on litter decomposition and its impact factor in terrestrial ecosystems. Bull Sci Technol. 33(10):1–10.
- Wen X, Wang YH, Zhong C, Hu BQ, Zhang XY. 2023. Spatial variation of surface soil organic matter and its influencing factors in Guizhou Province. J Soil Water Conserv. 37(3):218–224.
- Wiesmeier M, Urbanski L, Hobley E, Lang B, Lützow MV, Marin-Spiotta E, Wesemael BV, Rabot E, Ließ M, Garcia-Franco N, et al. 2019. Soil organic carbon storage as a key function of soils – a review of drivers and indicators at various scales. Geoderma. 333:149–162. doi: 10.1016/j.geoderma.2018.07.026.
- Wicaksono, K S, Murti BS, S H, Suratman Suharyadi ,. 2019. The use of DEM to delineate spatial variability of soil nutrient content in apple orchard Batu City, East Java Province, Indonesia.IOP Conf. Ser.: Earth Environ. Sci. 256: 012019. doi: 10.1088/1755-1315/256/1/012019.
- Wu ZX, Zhou Y, Liu JY, Xu T. 2021. Spatial variability of soil organic matter and its influencing factors in mountain areas of Northwestern Hubei Province. Resour Environ Yangtze Basin. 30(5):1141–1152.
- Xia XM, Li MW, Liu H, Zhu QH, Huang DY. 2022. Soil organic matter detection based on pyrolysis and electronic nose combined with multi-feature data fusion optimization. Agriculture. 12(10):1540. doi: 10.3390/agriculture12101540.
- Xu DH, Zhang K, Cao LH, Guan XR, Zhang HB. 2022. Driving forces and prediction of urban land use change based on the geodetector and CA-Markov model: a case study of Zhengzhou, China. Int J Digital Earth. 15(1):2246–2267. doi: 10.1080/17538947.2022.2147229.
- Xu XB, Du CW, Ma F, Qiu ZC, Zhou JM. 2023. A framework for high-resolution mapping of soil organic matter (SOM) by the integration of Fourier mid-infrared attenuation total reflectance spectroscopy (FTIR-ATR), Sentinel-2 images, and DEM derivatives. Remote Sens. 15(4):1072. doi: 10.3390/rs15041072.
- Xu YM, Li B, Shen XB, Li K, Cao XY, Cui GN, Yao ZL. 2022. Digital soil mapping of soil total nitrogen based on Landsat 8, Sentinel 2, and WorldView-2 images in smallholder farms in Yellow River Basin, China. Environ Monit Assess. 194(4):282. doi: 10.1007/s10661-022-09902-z.
- Yan Y, Ji WJ, Li BG, Wang GM, Hu BF, Zhang C, Mouazen AM. 2022. Effects of long-term straw return and environmental factors on the spatiotemporal variability of soil organic matter in the black soil region: a case study. Agronomy. 12(10):2532. doi: 10.3390/agronomy12102532.
- Yang JL, Dong JW, Xiao XM, Dai JH, Wu CY, Xia JY, Zhao GS, Zhao MM, Li ZL, Zhang Y, et al. 2019. Divergent shifts in peak photosynthesis timing of temperate and alpine grasslands in China. Remote Sens Environ. 233:111395. doi: 10.1016/j.rse.2019.111395.
- Zhao X, Zhang ZH, Zhao MS, Song XY, Liu XW, Zhang XG. 2023. The quantified and major influencing factors on spatial distribution of soil organic matter in provincial-scale farmland-a case study of Shandong Province in Eastern China. Appl Sci. 13(6):3738. doi: 10.3390/app13063738.
- Zhang BC, Niu LL, Jia TZ, Yu XH, She D. 2022. Spatial variability of soil organic matter and total nitrogen and the influencing factors in Huzhu County of Qinghai Province, China. Acta Agriculturae Scandinavica, Sec B Soil Plant Sci. 72(1):576–588. doi: 10.1080/09064710.2021.2023624.
- Zhu LJ, Meng JJ, Zhu LK. 2020. Applying Geodetector to disentangle the contributions of natural and anthropogenic factors to NDVI variations in the middle reaches of the Heihe River Basin. Ecol Indic. 117:106545. doi: 10.1016/j.ecolind.2020.106545.