
 ?Mathematical formulae have been encoded as MathML and are displayed in this HTML version using MathJax in order to improve their display. Uncheck the box to turn MathJax off. This feature requires Javascript. Click on a formula to zoom.
Abstract
As urbanization accelerates, the degree of human impact on land use is increasing. land use land cover change (LULC) is acknowledged as crucial factor in environmental change. The best way to understand historical land use patterns, changes, drivers, and developments is through a rigorous assessment of LULC changes. In this study, we aim to identify LULC changes from 2015 to 2022, and predict changes for 2030. Sentinel-2 images were employed to analyze LULC change patterns and predict future trends. The Random Forest algorithm was used to classify the various LULC classes with high accuracy and reliability. Multilayer Perceptron and Markov Chain Analysis (MLP-MCA) based Hybrid-Approach was employed to predict the future dynamics of LULC change for 2030. The study revealed that built-up area expanded 90.64 km2 from 2015 to 2022 due to natural resource substitution. Predictions indicate that 58.84% of the study area will be transform into built-up by 2030.
1. Introduction
The contemporary world faces a perpetual stream of scientific progress and innovation. This escalating progress constitutes an ever-evolving process that propels the phenomenon of urbanization (Iqbal et al. Citation2021). Urbanization denotes the enlargement of urban zones that entail developed urban centers and the simultaneous influence on the neighboring regions, commonly referred to as urban sprawl (Baloch et al. Citation2021; Iqbal et al. Citation2023). Metropolitan areas are subject to ongoing exposure to dynamic economic growth and local development experiences, which reflect the activities of over 54% of the globe’s entire population. (S. Ullah et al. Citation2019). Global urbanization is increasingly causing apprehension among experts, given the projected upward trajectory of urbanization rates, which could escalate to a staggering 70% by 2050 (Zhang Citation2016), (N. Malik et al. Citation2017).
In Pakistan, due to seeking enhanced quality of life amenities, individuals migrate from rural areas to urban centers, thereby exerting significant stress on the limited natural resources available (Jat Baloch et al. Citation2022; Z. Ullah et al. Citation2022). Furthermore, urbanization commonly undergoes haphazard expansion because of lacking comprehensive planning and management and resulting in uncontrolled growth in urbanization (Rashid et al. Citation2023; Z. Ullah et al. Citation2022). This uncontrolled and disorganized expansion of urban development has a profound and substantial effect on the alteration of LULC patterns (Yirsaw et al. Citation2017), (Y. Li et al. Citation2017). Expanding urbanization can precipitate many environmental challenges (Hussain et al. Citation2022). An essential component of scrutinizing alterations in LULC categories is the examination of parameters that play a pivotal role in driving the overall transformations (A.-A. Kafy et al. Citation2021; Nath et al. Citation2018; Tendaupenyu et al. Citation2017). Rapid LULC transformation results in converting natural landscapes into anthropogenic areas, posing a threat to environmental sustainability (Abbas et al. Citation2023). Extensive research has been conducted on the impacts of LULC changes, mainly due to rapid urbanization, where the growth of population and economic growth are considered the significant drivers behind the conversion of diverse land covers (S. Ahmed Citation2018; El-Hattab et al. Citation2018; Yang et al. Citation2017). The phenomenon of urbanization, coupled with population growth, engenders a spatial and physical expansion of cities (Zhang Citation2016), thereby giving rise to a surge in impervious cover, copious urban areas, and altered hydrological and climatic conditions of urban environments (Sakieh et al. Citation2015; J. Wu et al. Citation2011). Unplanned urbanization leads to critical problems, such as inadequate housing, traffic congestion, limited essential services, health issues, unemployment, and educational hurdles (Bloom et al. Citation2008; N. Malik et al. Citation2017; Metropolitan et al. Citation2018) the proliferation of crime, slums, lack of clean water and energy availability, and environmental degradation (Makinde Citation2012; Tanguay et al. Citation2010). These factors profoundly impact urban life within cities (Ghalib et al. Citation2017).
In developing countries, the primary driver of urban expansion is the proliferation of unplanned construction projects, often at the expense of converting agricultural land into urban centers (Khalifa Citation2015; Y. Li et al. Citation2017). As more people relocate from rural to urban areas, some cities have expanded for decades (Omurakunova et al. Citation2021). The magnitude and scope of LULC alterations in many countries are influenced by a complex interplay of socioeconomic and biophysical factors (Gutman and Radeloff Citation2017). The underlying causal factors that drive LULC changes can be attributed to unregulated population growth, rapid urbanization, and the expansion or contraction of agricultural practices at varying spatial scales (Cai et al. Citation2017; E. B. Ewane Citation2021). The transformation of LULC is intricately associated with human activities (Manandhar et al. Citation2009) and significantly influences climatic conditions. Land use changes, including urbanization and deforestation, can profoundly impact the hydrological cycle by altering infiltration patterns, evaporation, and runoff (Bradshaw et al. Citation2007; Liverman and Cuesta Citation2008).
In Pakistan (Busgeeth et al. Citation2008), urban centers have rapidly expanded in number and scale without adhering to established guidelines for categorizing cities as planned or unplanned (Kombe Citation2005). There is a shortage of established criteria for differentiating cities into planned and unplanned urban centers. Se guiding principles exist, including low to moderate population density, a deliberately designed development pattern, and a conscious allocation of green spaces (Kuffer and Barros Citation2011). On the other hand, unplanned urban areas are beset with issues of the high density of population, erratic development patterns, insufficient green spaces, and limited building sizes. Conversely, planned cities are divided into tidy towns, phases, and sectors, with a deliberate allocation of resources.
In contrast, unplanned cities lack such structured allocation. Planned cities’ expansion is managed and regulated based on predetermined criteria outlined in a comprehensive master plan. Pakistan has undergone a process of urbanization since achieving independence, although a notable upsurge in urban growth was observed from 1971 onwards (Blank et al. Citation2014; Shahbaz et al. Citation2017). Based on the 6th national population census report findings the proportion of individuals residing in urban areas is estimated to be 36.4%, with a corresponding population density of 261 individuals per square kilometre (PBS Citation2017). This percentage is projected to increase to 50% by 2025 (S. Malik and Wahid Citation2014). These statistics indicate a significant demographic shift towards urbanization, which has substantial implications for various societal and environmental factors. Per the Pakistan Economic Survey 2019-20, Pakistan ranks as the fifth most populous nation globally. The burgeoning populace and rampant urbanization have escalated the need for housing and led to an expansion of impervious cover in urban areas. The environment serves a multitude of functions, such as facilitating soil formation and protection, regulating water resources, supporting agricultural output, and sustaining energy consumption (Lambin and Meyfroidt Citation2011; Niquisse et al. Citation2017; Salazar et al. Citation2015; Tolessa et al. Citation2017). Unfortunately, these vital functions are increasingly under threat due to the unprecedented growth in population and urbanization. As a result, the quality (B. E. Ewane and Lee Citation2020) and quantity (E. B. Ewane Citation2020) of water resources are deteriorating, exacerbating the already critical situation.
Islamabad, the country’s capital city, is persistently facing mounting pressure from urbanization, population expansion, and accelerated economic growth. Recent research has revealed a significant increase in impervious cover and a significant decrease in surface water bodies within the city’s limits, spanning from 1992 to 2012 (Hassan et al. Citation2016). As per the analysis of experts (Umair Citation2022), Islamabad is projected to undergo a significant transformation from a verdant city to a concrete metropolis by 2030. However, the city’s infrastructure and resources are not adequately prepared to accommodate the challenges posed by the rapidly expanding population. Government statistics indicate that Islamabad’s population has grown by 100% over the past two decades, with approximately two million residents recorded in the 2017 census (PBS Citation2017). Unfortunately, the city’s vulnerability to anthropogenic and natural environmental changes exacerbates this situation. The most pressing concern is LULC change, as the uncontrolled expansion of housing complexes and roadways has led to unchecked urban sprawl. The Capital Development Authority has deemed about 150 housing societies as unlawful. Therefore, it is imperative to comprehensively examine the prolonged LULC transformation dynamics, as doing so is pivotal in comprehending and appraising the diverse alterations in the environment. Such scrutiny facilitates the attainment of sustainable development objectives and the mitigation of global environmental alterations (Ying et al. Citation2017).
Remote sensing has emerged as a valuable tool for monitoring changes in LULC by leveraging high spatial resolution satellite imagery, and facilitating accurate mapping and assessment of LULC changes (Abdullahi and Pradhan Citation2016; Al-Sharif and Pradhan Citation2015). Numerous investigations have been carried out to scrutinize LULC variations, utilizing diverse satellite datasets like Landsat (El Ghoul et al. Citation2023; Hussain et al. Citation2022; A. Al Kafy et al. Citation2021), MODIS (Al-Hamdan et al. Citation2017), Sentinel (Guzder-Williams et al. Citation2023; Sánchez-Espinosa and Schröder Citation2019) and SPOT (McCarthy et al. Citation2018) but Sentinel-2 imagery is well-suited for LULC classification due to its free access, high spatial resolution, multispectral bands, and frequent revisit time. The Sentinel-2 satellite facilitates the acquisition of multispectral data encompassing 13 discrete spectral bands, comprising the visible, shortwave infrared, and near-infrared, which can distinguish various land cover types (Bera et al. Citation2023). Integrating Remote Sensing (RS) and Geographic Information System (GIS) technology has garnered significant attention in earth observation. The combined utilization of these two cutting-edge technologies provides a comprehensive platform for analyzing changes in LULC (Dey et al. Citation2021).
Scientists across the globe have employed diverse methodologies to forecast forthcoming LULC alterations within their respective research domains. The MLP-MCA-based Hybrid-Approach, a novel method, has been implemented to integrate the Multilayer Perception (MLP) model with the Markov Chain Analysis (MCA) model. The proposed novel Hybrid-Approach aims to exploit the strengths of Multilayer Perceptron and Markov Chain Analysis to address the limitations of individual methods by leveraging their strengths and addressing specific challenges and tasks more effectively than the existing methods. This integration technique has gained considerable interest in the scientific community due to its ability to improve predictions’ accuracy and enhance models’ overall performance (Fortin et al. Citation2003). The MLP is a powerful tool for generalizing transition potentials in simulating LULC change. It is achieved by utilizing the supervised backpropagation algorithm, which allows for practical training of the MLP model (Maithani Citation2014). MCA is a statistical model that analyzes the probability of transitioning between different states over time. In land use, MCA predicts changes in LULC over a given period. Specifically, the model determines the likelihood of transitioning from one land cover class to another based on historical data (A. Al Kafy et al. Citation2020). However, the MLP-MCA hybrid methodology leverages the strengths of the two distinct MLP and MCA approaches, thereby producing a more precise projection of future changes and a comprehensive urban expansion map (Dey et al. Citation2021; Mishra et al. Citation2018; Saha et al. Citation2022).
The study area has exhibited a notable trend of urban expansion (Bokhari et al. Citation2018), leading to the congestion of previously developed regions over time. Despite the evident significance of LULC transformations, limited research has explored historical changes in the study area (Bokhari et al. Citation2021; Butt et al. Citation2015; Hassan et al. Citation2016; Kamran et al. 2023; A. Khan and Sudheer Citation2022; M. S. Khan et al. Citation2020; Naeem et al. Citation2018; Shah et al. Citation2021). However, no research has been conducted to predict the dynamics of LULC changes in Islamabad. The main objective of this study was to identify LULC changing patterns, gains, and losses, and spatial trends of change from 2015 to 2022 and predict the future dynamics of LULC Changes for 2030 in Islamabad utilizing an MLP-MCA-based Hybrid-Approach with Sentinel-2 Imagery. The findings of this study could be of great significance to urban planners and policymakers by providing them with valuable insights into the current state of urban growth and the potential for future expansion. With this knowledge, sustainable solutions can be developed to address the issue of haphazard urbanization. Furthermore, the study results could be used to formulate and implement short and long-term development plans for Islamabad and its surrounding areas.
2. Materials and methods
2.1. Study area
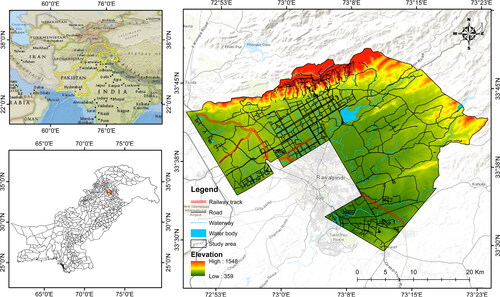
Islamabad (capital) of Pakistan is located on the northern edge of the Potohar plateau in the Punjabi province, 14 km northeast of Rawalpindi. Its map reference is north latitude 33° 49′ and longitudes 72° 24′ east of Greenwich and 610 meters and elevations between 406 and 1451 meters. Islamabad has an area of 903.65 square kilometers. A further specified Area, encompassing an additional 3626 square kilometers, is restricted by the Margala Hills situated towards its northern and northeastern periphery. Islamabad has a humid subtropical climate with hot summers and cool winters. In Winter (Oct-March), avg high temperature is 16.6 °C and avg low temperature is 3.4 °C, and in Summer (April-sept), avg temperature is 34.2 °C and avg low temperature is 24.4 °C. Regarding population composition, Islamabad is the most varied metropolis in Pakistan. The majority of the city’s foreigners and expatriates live there. The reasons are straightforward: its welcoming, moderate climate, picturesque, lush landscape, and first-rate basic infrastructure (CDA Citation2022), Pakistan’s model city for its cleanliness and greenery (Umar Citation2022). Owing to urbanization as well as unplanned building infrastructure and roads is quickly losing its charm. Due to the nearby Margalla Hills, Islamabad experiences hot, humid summers and cool, dry winters. According to PBS (Citation2017), Islamabad has a 1,009,003 urban population and 994,365 rural population, with the country’s highest average annual growth rate of 3.45% between 1998 and 2017. depicts the research area’s location.
Figure 1. Location of the study area.
2.2. Data acquisition
This study necessitates essential spatial data, like Sentinel-2 imageries, digital elevation models, and field data, to gain the main objective. We acquired Sentinel-2 imageries for the years 2015, 2018, and 2022 from the Copernicus Open Access Hub (scihub.copernicus.eu) and obtained the ALOS PALSAR Digital Elevation Model from NASA's data repository (search.asf.alaska.edu). The present study utilized a high-resolution digital elevation model (DEM) dataset, featuring a spatial resolution of 12.5 meters, as a fundamental data source to derive several terrain-related parameters, including slope, aspect, elevation, distance to roads, and distance to streams. For LULC analysis, imagery data from Sentinel-2 acquired in 2015, 2018, and 2022 were employed. To reduce the cloud effect and seasonal variations from the reflectance value, image acquisitions were carried out in October, corresponding to the dry season in the study area of Islamabad. provides a comprehensive overview of the satellite data utilized in the study, delineating pertinent details and specifications. Furthermore, supplementary/referential data were acquired through an extensive field survey and high-resolution imagery sourced from Google Earth Pro version 7.3.6 to ascertain the precise ground truth condition of the study site. The schematic diagram presented in illustrates the methodology employed in this investigation, delineating the sequential steps of the approach clearly and concisely.
Figure 2. The proposed methodology’s flowchart.
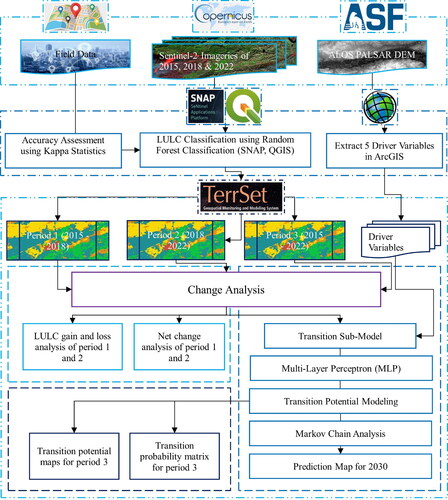
Table 1. Spatial and spectral characteristics of Sentinel-2A.
2.3. LULC classification
The Sentinel-2 images were subjected to automated classification to extract desired thematic information, whereby all pixels were assigned to specific LULC categories (Al-Sharif and Pradhan Citation2014). Before performing LULC classification, the Sentinel-2 images underwent a series of pre-processing steps to address spectral variability by employing the Augmented Linear Mixing Model (Hong et al. Citation2018) and (C. Li et al. Citation2023) used LRR-Net. Researchers across the globe have employed diverse techniques for image classification like extended vision transformer (ExViT) (Li et al. Citation2023), CCR-Net (X. Wu et al. Citation2022), MDL framework (Hong et al. Citation2021), miniGCN (Hong et al. Citation2021), supervised classification (Hussain et al. Citation2022; Hussain and Karuppannan Citation2023). Following image pre-processing, a supervised classification technique utilizing the Random Forest (RF) algorithm was applied within the QGIS software environment to perform LULC classification. (Breiman Citation2001) the Random Forest classifier was proposed as a supervised algorithm based on decision trees and enhanced bagging and bootstrap methods. There are many trees in the RF, and each tree in the forest comprises randomly chosen training pixels for RF classification (H. T. T. Nguyen et al. Citation2018). As part of the supervised classification method, the RF is now one of the most practical algorithms for picture interpretation (Tokar et al. Citation2018). The learning (training) and classification (testing) phases are the two parts of the machine learning algorithm known as supervised classification. A collection of training samples were comprised of the training data. Each sample is a pair consisting of a label and a feature vector. The supervised classification algorithm examines the labeled training data during the training phase and generates classification rules. During the testing phase, the brand-new test data that has never been seen before is divided into classes (also known as labels) using the produced classification rules. The effectiveness of the supervised classification is then verified by comparing the classed labels to the labeled test data (Hu and Sadda Citation2019). Seven distinct LULC classes were considered in this research, as depicted in . The ESA SNAP 9.0 integrated into QGIS 3.22 LTR software was used to classify imageries in a multi-temporal approach and for mapping purposes. The training data were used to categorize, verify, and validate the classified imageries. and show the spatial and statistical distribution of LULC classes for 2015, 2018, and 2022.
Figure 3. Classified LULC maps of Islamabad for the years (a) 2015, (b) 2018, and (c) 2022.
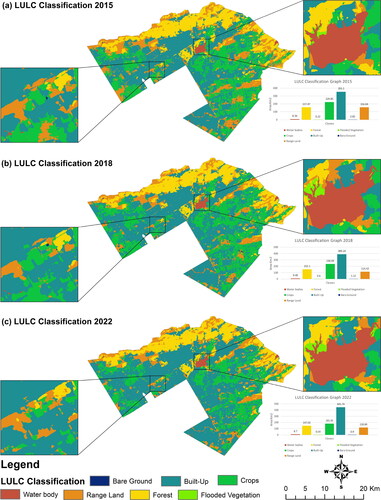
Table 2. Land use land cover types used study area.
Table 3. 2015 2018 & 2022 study area statistics.
2.4. Accuracy assessment
The accuracy of the classification results must be evaluated since LULC maps produced using image classification typically contain some errors. When assessing the accuracy, the corresponding classified images are considered on how they accurately reflect the reality on the ground. Classification accuracy must be evaluated to determine trust in the outcomes and the subsequent change detection(T. Nguyen Citation2015). The classified LULC maps were compared with ground truth data (GPS points) For accuracy assessment. An error/confusion matrix is the most popular and efficient method for measuring how accurately classed imagery is produced from remotely sensed data (Morales-Barquero et al. Citation2019). The confusion matrix provides overall accuracy, user accuracy, producer accuracy, and kappa statistics. EquationEquation (1)(1)
(1) was used to determine the Kappa coefficient (Jenness and Wynne Citation2005). A kappa coefficient value below 0.4 indicates poor agreement, between 0.4 and 0.8 indicates moderate agreement and larger than 0.8 indicates strong agreement, according to the authors (Leta et al. Citation2021).
(1)
(1)
(2)
(2)
where
= rows number in the matrix,
= number of observations in row
and column
(the diagonal elements),
and
= the marginal totals of row
and column
respectively, and
is the number of observations.
The ratio of correct classifications to the total number of classifications determines overall accuracy. User accuracy, conversely, pertains to the ratio of the number of correct classifications in a particular category to the total number of classifications made in that category. Similarly, the Producer’s accuracy refers to the ratio of correctly identified reference plots in a given category to the actual number of plots in that reference category. shows the accuracy assessment of classified LULC maps.
Table 4. Accuracy assessment of classified LULC maps.
2.5. LULC change analysis
The LULC transition assessment conducted in this research was based on LULC maps derived from the classification of Sentinel-2 satellite imageries of the years 2015, 2018, and 2022. To conduct the analysis of LULC changes, as well as simulate and forecast future alterations, the Land Change Modeler (LCM) was employed. Geospatial Monitoring and Modelling Software, TerrSat2020, offers this full-featured framework. The LCM encompasses a comprehensive set of modelling methods, predicting and analyzing LULC change and evaluating the predictions in light of past changes. Among these tools are Multilayer Perceptron, Decision Forest, Logistical Regression, Support Vector Machine, SimWeight Multinomial Logistical Regression, Cellular Automata, Markov Chain Analysis, and Artificial Neural Networks. By including user-specified change factors, the LCM facilitates mapping transformations, classifying alterations between distinct LULC categories, and modelling and forecasting future landscape scenarios (IDRISI, Citation2012). The LCM employs a Markov Chain matrix as the fundamental framework for characterizing changes derived by aligning the LULC maps of two distinct periods. To evaluate the Markov Chain projection, a matrix is generated to compute the areal extent of every LULC category for the upcoming period and the alteration rate for each LULC transition. The change potential is evaluated by calculating the likelihood of each transition (Mas et al. Citation2014). This model is valuable for comprehending the efficacy of Land Use and Land Cover (LULC) systems and aiding in policymaking and critical planning.
Furthermore, it can anticipate prospective alterations in LULC for upcoming dates across diverse conditions (B. Ahmed and Ahmed Citation2012; Mishra et al. Citation2014; Ozturk Citation2015). In numerous studies, the utilization of LCM has been demonstrated for a diverse range of scientific investigations (Gontier et al. Citation2010; Khoi and Murayama Citation2010; Mishra et al. Citation2014; Václavík and Rogan Citation2009). The changes in LULC between time one and time 2 serve as the foundation for the change analysis (Anon n.d.). Identifying a shift from one LULC category to another is accomplished via LULC change analysis. Cross-tabulation analysis was used in this research to quantify LULC variations during the three distinct periods of 2015–2018 (period 1), 2018–2022 (period 2), and 2015–2022 (period 3). This research makes it possible to identify, map, and quantify the regions that switched from one LULC class to another during a specific period (Mozumder and Tripathi Citation2014). The study investigated the alterations in LULC over time by scrutinizing the fluctuations in gains and losses of LULC classes, the corresponding impacts on the net changes in a built-up area, and a spatial trend of changes in a built-up area for the respective periods of interest (periods 1, 2, and 3). illustrates the gains and losses and the individual contributions to the overall net change in the built-up region throughout periods 1, 2, and 3. present a detailed account of the changes in LULC during 2015-2018, 2018-2022, and 2015-2022, respectively.
Figure 4. Gains and losses in LULC (km2) and contributions to the net change in the built-up area (Km2) during (a) 2015–2018, (b) 2018–2022, and (c) 2015–2022.
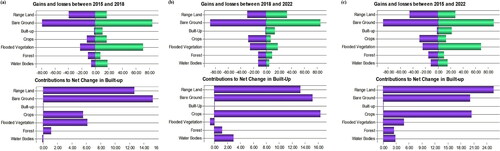
Table 5. Number of changes in LULC during 2015 - 2018 (period 1), 2018 - 2022 (period 2) and 2015 - 2022 (period 3).
2.6. Selection of LULC transitions
Between the LULC maps of two periods, minor to major transitions exist. Concerning the study’s objective, only significant transitions between LULC classes were considered. Including only effective transitions dramatically influences the dynamics of the research region. To improve the performance of the MLP neural network, critical transitions are added to the transition sub-model (Eastman Citation2006). In Islamabad, six significant transitions thought to be possible factors driving LULC change were considered. We had considered the following transitions: from range land to forest, from range land to crops, from forest to built-up, from crops to built-up, from range land to built-up, from forest to range land, and crops to range land.
2.7. Selection of variables and model development
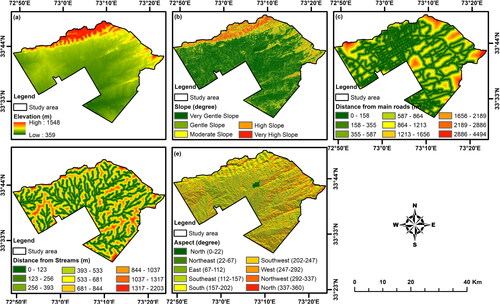
The factors that influence land use and cover changes cannot be generalized; instead, they must be considered for each research region separately. However, these factors’ applicability varies from case to case, as numerous academics have acknowledged (Mitsuda and Ito Citation2011) (Geneletti Citation2013). The factors that prevent built-up area expansion are called constraints. Physical constraints include the already-existing built-up region, waterways, and road network, among many others. Road networks were considered as constraints in this research. The possible explanatory power of variables was investigated when all the transitions were compiled into a sub-model collection. Both static and dynamic components of these variables might be included in the model (Eastman Citation2006). Four static and one dynamic variable were considered in total for this study. This study considered static variables such as slope, aspect, elevation, and distance from streams, while the distance from major roads was regarded as a dynamic variable. Static variables don’t vary over time and are essential for the transition under consideration.
Dynamic variables fluctuate over time and are computed continuously throughout a prediction. The dynamic variable ‘distance to major roads’ was selected due to construction and developmental activities alongside roads. Two model variables already defined are the main driving forces and LULC transitions. Adding to the main driving forces, LULC transitions were divided into sub-models (IDRISI, Citation2012) (Geneletti Citation2013). Various variables, distinct to each sub-model, were used to explain particular LULC transitions over the desired period. Transition potential maps were generated to visualize the LULC class’s suitability for LULC future scenarios. shows the variables that were used in this research.
Figure 5. Different variables used in the study: (a) elevation, (b)slope, (c) distance from main roads, (d) distance from streams, (e) aspect.
2.8. Transition potential modelling
Significant LULC transitions were detected using of transition potentials tool, and Transition potential images were generated with a high degree of precision to run the primary model under consideration effectively. With the help of the multilayer perceptron (MLP) incorporated in LCM, the potential transition images for every sub-model were generated based on static variables, dynamic variables, and LULC transitions. The multilayer perceptron is rooted in BP supervised training algorithm. It has a wide range of applications for classifying and predicting LULC changes and can tackle nonlinear separable issues (B. Ahmed and Ahmed Citation2012). Based on significant transitions of LULC that took place in the study region between 2015 and 2018, MLP was applied to identify LULC changes between those years. A neural network generated the independent group of cells that adhered to each of the selected modelling transitions.
Additionally, a weighted network of neurons was created to calculate the training mistake and adjust the amount of weight for more precision. (i.e. Changing the weight causes the RMS error to decrease). (Eastman Citation2006) recommended 80% as a standard precision rate. Two LULC maps (2015 and 2018) were used to extract the samples for the present study. The MLP algorithm, upon running 10,000 iterations, revealed that a minimum of 45,904 cells transitioned from their respective LULC categories from 2015 to 2018. During this procedure, 50% of the cells were selected for training, while the remaining 50% were assigned to the validation task. The neural network was trained using a dataset comprising seven distinct LULC classes and an additional seven transition classes, wherein individual cells underwent alterations in LULC status over a given period. Upon completing the MLP algorithm, the calibration was quantified using an accuracy rate of 93.01%, signifying high precision in the results obtained. The potential transition maps generated through the present study were subsequently utilized to predict LULC alterations for future dates.
2.9. Prediction & validation of LULC
The MLP-MCA embedded in TerrSat2020 (Geospatial Monitoring and Modelling System) software was used for future LULC prediction based on historically classified imageries. Incorporating Markov Chain analysis, the quantification of alteration was projected by two distinct LULC maps (i.e. 2015 and 2018) in conjunction with the designated date. By employing MLP methodology, one can ascertain the precise magnitudes of the transitions, which can subsequently be incorporated into the probability matrices of Markov chains to facilitate the prognostication of future LULC alterations. The probability function derived from the changes examined by the preceding two scenarios is the foundation for MCA (Mishra and Rai Citation2016). The prediction of LULC alterations relies upon the outcomes derived from the sub-model transitions and the Markov chain Analysis, with the year 2022 serving as the baseline date. The product derived from MCA is a matrix that presents the projected quantity of transformation for each assessed transition toward the anticipated culmination date. To anticipate the LULC map for 2022, the transition probability matrix for the years 2015–2018 was computed. Typically, the predicted and observed maps are compared to validate the model. As a result, the model was verified by utilizing kappa index statistics to reach the predicted and observed LULC maps of 2022 (Kamusoko et al. Citation2009) (Wang et al. Citation2012). The kappa index’s components are kappa for no information kappa for grid cell level location
kappa for stratum-level location
& kappa standard
(Mishra et al. Citation2018)(Pontius and Millones Citation2011). Subsequently, prognostication for the year 2030 was carried out by MLP-MCA, which enabled the identification of potential alterations in LULC.
3. Results
3.1. LULC maps and accuracy assessment
The Random Forest classification method was employed to generate LULC maps for the years 2015, 2018, and 2022 using Sentinel-2 imageries. and vividly illustrate the spatial, quantitative, and graphical distribution of LULC classes across the three different years of 2015, 2018, and 2022. summarizes the overall classification accuracy values, kappa statistics, and producer and user accuracies obtained using the confusion matrix. In analyzing Sentinel-2's classified images for 2015, 2018, and 2022, the study revealed that the overall classification accuracy rates were 94.93%, 95.17%, and 95.23%, respectively. Furthermore, the obtained kappa coefficients for the classified imageries from 2015, 2018, and 2022 were 93.88%, 94.16%, and 94.30%, respectively.
Analyses of LULC class changes across three periods (periods 1, 2, and 3) were conducted. Substantial alterations have taken place in the LULC classes over recent years, particularly in Built-up, Forests, Crops Land, and Rangeland. Based on the observations, the extent of built-up areas escalated from 355.10 Km2 (39.30%) in the year 2015 to 389.24 Km2 (43.07%) in 2018 and further expanded to 445.74 Km2 (49.33%) by the year 2022.
During Period 1, there was an increase of (3.77%); in Period 2, the built-up area experienced a more significant growth rate of (6.26%). Over eight years, the forested land in the region experienced a gradual decline, with a reduction from 157.47 Km2, comprising (17.43%) of the total area, in 2015 to 152.10 Km2, equivalent to (16.83%), in 2018 and then further down to 147.02 Km2, accounting for (16.27%) of the area, in 2022. Specifically, the forest area decreased by (0.6%) during period one and subsequently by (0.56%) during period 2. The cropland area in 2015 was 224.85 Km2, comprising (24.88%) of the total land area. By 2018, this had increased to 236.69 Km2, accounting for (26.19%) of the area. However, in 2022, the cropland area decreased to 181.91 Km2, representing only (20.13%) of the total land area. Overall, the cropland area experienced a modest growth of (1.31%) during period 1, followed by a significant decline of (6.06%) during period 2. In 2015, the expanse of range land measured 156.84 Km2, accounting for (17.36%) of the total land area. However, by 2018, this had dwindled to 114.42 Km2, representing a decline of (12.66%). As of 2022, the range land area had increased to 118.84 Km2, equivalent to (13.15%) of the total land area. Thus, there was a reduction of (4.7%) in period 1, followed by a subsequent increase of (0.49%) in period 2. The area of water bodies increased from 8.38 km2 (0.92%) in 2015 to 9.49 km2 (1.05%) in 2018 but subsequently decreased to 8.70 km2 (0.96%) in 2022. During Period 1, the area of water bodies experienced a modest increase of (0.13%), while in Period 2, it decreased by (0.09%). In 2015, the land area covered by flooded vegetation was 0.22 km2, accounting for a mere 0.02% of the total land area. By 2018, this figure had risen to 0.60 km2, representing 0.07% of the total land area. However, by 2022, the area covered by flooded vegetation had reduced to 0.54 km2, comprising (0.06%) of the total land area. Throughout the two periods, the area covered by flooded vegetation increased by (0.05%) in Period 1 but decreased by (0.01%) in Period 2. During the same period, bare ground areas increased from 0.82 km2, accounting for (0.09%) of the total land area in 2015, to 1.12 km2, comprising (0.12%) of the total land area in 2018. However, by 2022, the area of bare ground had reduced to 0.90 km2, representing (0.10%) of the total land area. Over the two periods, the area of bare ground increased by (0.03%) in Period 1 but decreased by (0.02%) in Period 2.
While throughout the entire period 3, the area of flooded vegetation experienced a modest increase from 0.22 km2 (0.02%) to 0.54 km2 (0.06%), representing a gain of 0.04%. Similarly, the bare ground also increased from 0.82 km2 (0.09%) to 0.90 km2 (0.10%) during this period, with a gain of 0.01%. In 2015, crop Land coverage accounted for 224.85 km2 (24.88%) of the total area during period 3, but by 2022, it decreased to 181.91 km2 (20.13%) of the total area, indicating a loss of 4.75% during this period. On the other hand, Rangeland covered 156.84 km2 (17.36%) of the total area during period three but decreased to 118.84 km2 (13.15%) in 2022, reflecting a loss of 4.21% during this period. Additionally, forest land decreased from 157.47 km2 (17.43%) to 147.02 km2 (16.27%) during period 3, representing a loss of 1.16%. However, the built-up area significantly increased, from 355.10 km2 (39.30%) of the total area in 2015 to 445.74 km2 (49.33%) in 2022, as indicated in .
3.2. LULC change analysis
The land use land cover (LULC) changes analysis over periods 1, 2, and 3 was conducted utilizing LULC maps for 2015, 2018, and 2022. This analysis was performed using the change analysis tool available in the Land Change Modeler (LCM). The changes in LULC were assessed by examining the gains and losses incurred by various classes. The majority of these classes exhibit both positive and negative changes.
During period 1, the changes in LULC were quantified for various LULC classes. Specifically, the Range land experienced a 39.80% reduction and a 17.48% increase, resulting in a net loss of 22.32%. Bare Ground exhibited a 79.50% decrease, followed by an 84.99% increase, resulting in a net gain of 5.49%. The built-up area underwent a 2.46% reduction and an 11.02% increase, resulting in a net gain of 8.56%. Crops experienced a 12.67% reduction and a subsequent 17.04% increase, resulting in a net gain of 4.37%. Flooded vegetation experienced a 22.95% reduction and a substantial 71.03% increase, resulting in a net gain of 48.08%. Forest exhibited an 11.08% decrease followed by a 7.94% increase, resulting in a net loss of 3.14%. Lastly, Water Bodies underwent a 6.24% reduction and a subsequent 17.58% increase, resulting in a net gain of 11.34%.
In period 2, the Range land experienced a 30.43% reduction and a subsequent 33.01% increase, resulting in a net gain of 2.58%. Bareland exhibited an 88.60% decrease, followed by an 85.91% increase, resulting in a net loss of 2.69%. The built-up area underwent a 1.84% reduction and a 14.28% increase, resulting in a net gain of 12.44%. Crops experienced a 28.37% reduction and a 6.80% increase, resulting in a net loss of 21.57%. Flooded vegetation experienced a 25.53% reduction and a substantial 17.72% increase, resulting in a net loss of 7.81%. Forest exhibited a 12.79% decrease followed by a 9.77% increase, resulting in a net loss of 3.02%. Lastly, Water Bodies underwent a 12.68% reduction and a subsequent 4.75% increase, resulting in a net loss of 7.93%.
While throughout the entire period 3, the Range land experienced a 45.74% reduction and a subsequent 28.39% increase, resulting in a net loss of 16.61%. Bare Ground exhibited an 88.07% decrease followed by an 89.20% increase, resulting in a net gain of 1.13%. The built-up area underwent a 1.91% reduction and a 21.85% increase, resulting in a net gain of 19.94%. Crops experienced a 30.03% reduction and a 13.52% increase, resulting in a net loss of 16.51%. Flooded vegetation experienced a 24.47% reduction and a substantial 68.62% increase, resulting in a net gain of 44.62%. Forest exhibited a 15.69% decrease followed by a 9.70% increase, resulting in a net loss of 5.99%. Lastly, Water Bodies underwent an 11.72% reduction and a subsequent 15.35% increase, resulting in a net gain of 3.63%.
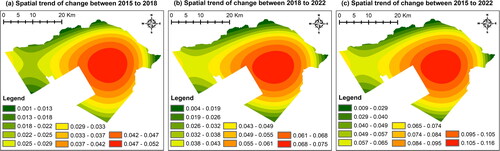
3.3. Spatial trend of LULC changes
Using the spatial trend of LULC change presents a productive approach to visualize and offer a generalized pattern of alterations, relying on examining two observed LULC maps. The study employed a spatial trend of change analysis tool to produce maps illustrating the patterns of transitions from all LULC classes to built-up areas over three distinct periods: periods 1, 2, and 3. The trend maps were developed using the default third-order polynomial parameter, which is determined to be the best fit for the observed trend of change. The numbers reflected in the maps indicate the extent and direction of the changes; lower and higher numbers indicate less or more changes, respectively. The spatial trends of LULC maps are presented in . The results revealed a more pronounced transition of built-up areas in the central region of the study area, indicating a significant expansion of built-up areas in a westward direction compared to other parts.
3.4. Transition probability
The Markov chain analysis was employed to calculate the transition probability matrix to forecast the LULC trends for 2022, based on the LULC maps from the interval of 2015-2018. The resulting matrix is presented in .
Table 6. Markov transition probability matrix for 2022, varying among LULC.
The transition probability matrix, resulting from the cross-tabulation of the 2015 and 2018 LULC images, encapsulates the anticipated probability or amount of change from each specific LULC classification to another throughout the designated time span. The columns and rows of the transition probability matrix correspond to the distinct LULC classifications depicted in the images acquired at earlier and later periods. The results of MCA offer valuable insights into the temporal patterns, dynamics, and magnitudes of LULC transformations within a given geographic domain. This stochastic process generates a transition probability matrix and conditional probability image through the analysis of LULC maps from two distinct periods.
Furthermore, it is noteworthy from the transition probability matrix of 2022 that the probability of conversion from cropland to built-up land is 10.94%, from barren ground to built-up land is 24.9%, and from range land to built-up land is 17.36%. From the forest area, to built-up land is 2.11%. On the other hand, the transition probability matrix for the year 2030 reveals that the probability of conversion from cropland to built-up land amounts to 24.76%, whereas the corresponding possibilities for barren ground to built-up amounts to 37.11%, range land built-up amounts to 29.91%, and forest area built-up amounts to 3.66%.
3.5. Prediction & validation
The current study employs a cutting-edge approach that integrates the Multilayer Perceptron (MLP) and Markov Chain Analysis (MCA), two advanced techniques in machine learning and statistical modelling. (Fattah et al. Citation2021) Elucidated that the MLP-MC model is the most productive approach for simulating forthcoming spatiotemporal variations, particularly in high-precision LULC transformations. MLP-MCA combines these two techniques by using an MLP to model the time series data and then using a Markov chain to predict future states based on the MLP's output. Specifically, the MLP algorithm is employed to develop potential transition maps with a remarkable accuracy of 93.04% for multiple LULC transitions. To ensure a reliable projection of future LULC scenarios, the MLP-MCA method is employed to forecast LULC patterns in 2022 based on the 2015 and 2018 LULC maps.
To evaluate the model’s performance, the predicted LULC map for 2022 is compared with the actual LULC map of 2022 using kappa index statistics, a widely accepted measure for assessing the agreement between two categorical maps. Validation is a rigorous scientific process that involves quantitatively measuring or comparing the degree of concordance between the predicted data and the actual or reference data (Verburg et al. Citation2006). The Kappa statistic index is extensively utilized to validate the agreement between the observed and anticipated LULC classifications (McHugh Citation2012). The Kappa statistic values for both location and quantity are calculated using a comparative analysis between the projected LULC of 2022 and the actual observed LULC map of 2022. The results of the kappa statistics analysis indicate that
&
It has been observed that all Kappa index values surpass 0.80. It indicates a moderately high level of agreement between the actual and predicted LULC, which is deemed acceptable. This finding reveals the successful and accurate predictive capabilities of the MLP-MCA-based Hybrid-Approach in forecasting future LULC patterns (Halmy et al. Citation2015), (Saha et al. Citation2022). Following the highly successful forecasting of the LULC map for 2022, the subsequent LULC change map for the year 2030 was forecasted. Utilizing the LULC maps of 2015 and 2022 as base maps, LULC transition potential maps for period 3, the LULC transition probability matrix and map spanning the period from 2022 to 2030, and the anticipated LULC change maps for 2030 were prognosticated as visually presented in the . And presents the pertinent area statistics about diverse anticipated LULC categories for 2030.
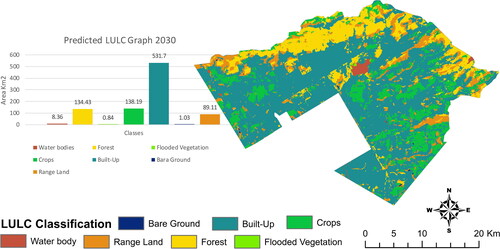
The MLP-MCA-based Hybrid-Approach prediction for the year 2030 indicates a concerning trend of environmental degradation in the study area. Specifically, throughout the period spanning from 2022 to 2030, the total area of water bodies is projected to decrease from 8.70 km2 (0.96%) in 2022 to 8.36 km2 (0.03%) in 2030, resulting in a loss of 3.29% during this period. The forested area is also expected to decrease from 147.02 km2 (16.27%) in 2022 to 134.43 km2 (14.88%) in 2030 of the total area, indicating a loss of 1.39% during this period. Furthermore, the crop area is predicted to decrease from 181.91 km2 (20.13%) in 2022 to 138.19 km2 (15.29%) in 2030 of the total area, indicating a loss of 4.84% during this period. Similarly, the range land area is expected to decrease from 118.84 km2 (13.15%) in 2022 to 89.11 km2 (9.86%) in 2030 of the total area, resulting in a loss of 3.29% during this period. In contrast, the built-up area is projected to increase from 445.74 km2 (49.33%) in 2022 to 531.70 km2 (58.84%) in 2030 of total area, indicating a gain of 9.51% during this period. The flooded vegetation area is also expected to increase from 0.54 km2 (0.06%) in 2022 to 0.84 km2 (0.09%) in 2030 of the total area, indicating a gain of 0.03% during this period. Finally, the bare ground area is predicted to increase from 118.84 km2 (0.10%) in 2022 to 89.11 km2 (0.13%) in 2030 of the total area, indicating a gain of 0.01% during this period in Islamabad, Pakistan.
4. Discussion
Between 2015 and 2022, the built-up area underwent a significant shift, increasing by 10.03%. This expansion resulted in a substantial loss of crop (4.75%), range land (4.21%), and forest (1.16%), which contributed to the overall increase in the built-up area during the study period. According to Kamran et al. (2023), between 1990 and 2021 in Islamabad, the built-up area expanded from 5.7% (52 km2) to 25.7% (233 km2). The dynamic growth of the built-up area can be attributed to the rising demand for land and urban resources, coupled with an increase in population. present a detailed account of the changes in LULC during 2015-2018, 2018-2022, and 2015-2022, respectively.
The analysis of LULC changes over periods 1, 2, and 3 demonstrates that significant changes and transitions occurred across various LULC classes during all study periods (periods 1, 2 & 3). depicts the percentage gains and losses in LULC for Periods 1, 2, and 3 and how they contributed to the net change in built-up areas. Meanwhile, illustrates the combined LULC change map from 2015-2022. Finally, presents the gains and losses in different LULC classes during the 2015-2022 timeframe.
Figure 6. Combined LULC change map during the 2015-2022 timeframe.
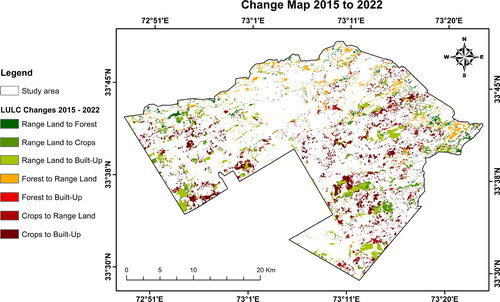
Figure 7. Gains and losses in different LULC classes during the 2015-2022 timeframe.
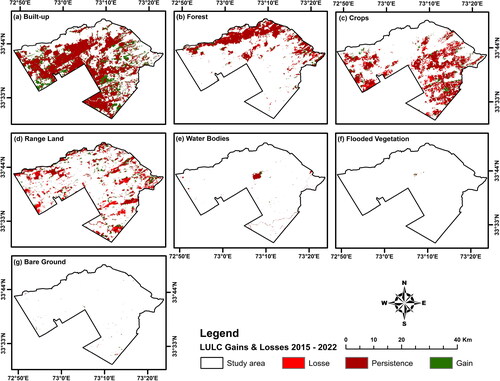
Figure 8. Built-up area spatial trends of change from years (a) 2015 to 2018, (b) 2018 to 2022, and (c) 2015 to 2022.
In Islamabad, the alarming difference in the probability of change reveals the rapid decrease in crops, range land, barren grounds, forest, and a rapid increase in a built-up area. The transition probability from cropland to built-up land has increased from 10.94% in 2022 to 24.76% in 2030. This indicates that a more significant proportion of cropland is being converted to built-up areas, potentially due to urban expansion or infrastructure development. Conversely, the transition probability from barren ground to built-up land increased from 24.9% in 2022 to 37.11% in 2030. This suggests that previously low ecological value areas are being transformed into urban spaces. The transition probability from range land to built-up land has increased from 17.36% in 2022 to 29.91% in 2030. This signals a trend of urbanization encroaching upon previously designated range land.
On the other hand, the transition probability from forest areas to built-up land has also seen a modest increase, from 2.11% in 2022 to 3.66% in 2030. While this increase is relatively small, it could still impact biodiversity, ecosystem services, and carbon sequestration provided by forests. and give the Markov transition probability matrices, representing the probability of LULC changes occurring between different categories for 2022 and 2030. illustrates the Markov conditional probability map for the year 2030.
Figure 9. Markov conditional probability Map for 2030.
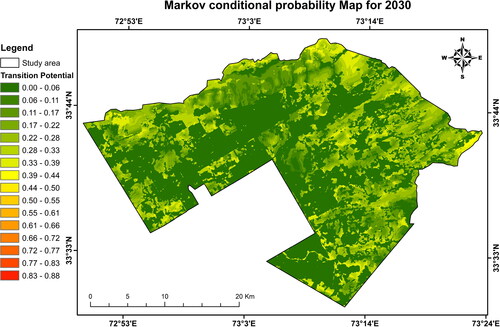
Table 7. Markov transition probability matrix for 2030, varying among LULC.
Table 8. Area statistics of projected LULC for the year 2030.
It is particularly noteworthy that the built-up area is projected to undergo a substantial increase of 9.51% in 2030, resulting in a significant loss of crop (4.84%), range land (3.29%), and forest (1.39%) as depicted in and . Unfortunately, the alterations to cropland, forest, and range land will be accompanied by an unregulated surge in the built-up area, as depicted in .
Figure 10. Predicted LULC 2030.
5. Conclusions
The study identified LULC changing patterns from 2015 to 2022 to predict the future dynamics of LULC Changes for 2030 in Islamabad, Pakistan. To achieve the intended objective, a random-forest classification algorithm was employed to carry out LULC classification by utilizing Multispectral Sentinel-2 satellite images of the years 2015, 2018, and 2022, respectively. A Hybrid-Approach that used Multilayer Perceptron and Markov Chain Analysis was utilized to model time series data, identify LULC changing patterns, gains, and losses, spatial trends of change from 2015 to 2022, and predict future dynamics of LULC Change for the year 2030. The precision of the projected LULC map for 2022 was evaluated utilizing the Kappa statistics index. Subsequently, the MLP-MCA-based Hybrid Approach was employed to anticipate future LULC transformation scenarios for 2030. This predictive outcome yields comprehension regarding the expected alterations’ quantitative and spatial dimensions, encompassing the potential magnitude and distribution thereof.
According to the predicted outcomes projected for 2030, a significant increase of 85.96 km2 in the built-up area is expected. At the same time, minor increments of 0.3 km2 and 0.13 km2 are projected for the flooded vegetation and the bare ground region, respectively. In contrast, substantial decreases of 43.72 km2 in the crop region, 29.73 km2 in the range land, and 12.59 km2 in the forest are anticipated, alongside a marginal decrement of 0.34 km2 in the water bodies. These changes are expected to occur between the time frame of 2022 to 2030. It is particularly noteworthy that the built-up area is projected to undergo a substantial increase of 9.51% in 2030, resulting in a significant loss of crop (4.84%), range land (3.29%), and forest (1.39%). The LULC change analysis conducted for the time period spanning 2015 to 2022 has displayed a considerable upsurge in built-up areas of (10.03%), concurrent with a significant decline in crops of (4.75), range land of (4.21%), and forest of (1.16%).
Urgent action is needed to mitigate the adverse effects of this trend and promote sustainable land use practices that prioritize protecting natural resources and conserving ecological integrity. This study demonstrates that the MLP-MCA-based Hybrid-Approach outperforms other models in terms of accuracy, consideration of spatial and temporal aspects, incorporation of multiple data sources, and support for policy and decision-making. This indicates that the hybrid model is the most suitable approach for LULC modelling and prediction, offering enhanced accuracy and valuable insights for land management and planning.
This study’s findings can give urban planners and policymakers valuable insights into the shifting patterns of LULC, enabling them to make informed and productive decisions about sustainable development. The current investigation has further corroborated the efficacy of integrating GIS and remote-sensing data in facilitating LULC change analysis and forecasting future LULC scenarios. However, it should be noted that the classification accuracy of LULC and predictive outcomes are subject to the resolution of satellite images, which necessitates enhancing image quality. To achieve improved results, advanced satellite platforms, such as WorldView, GeoEye, and QuickBird, which furnish superior spatial information about the intricate and heterogeneous land use features within urban regions, should be utilized to attain optimal results.
Future research could explore the interaction between LULC changes and climate change impacts. This could involve assessing how changing land use affects local climate patterns and contributes to or mitigates climate-related challenges.
Disclosure statement
No potential conflict of interest was reported by the authors.
Data availability statement
The satellite data used in this study are accessible online: The Sentinel-2 imageries were acquired from the Copernicus Open Access Hub (scihub.copernicus.eu) and obtained the ALOS PALSAR Digital Elevation Model from NASA's data repository (search.asf.alaska.edu).
Additional information
Funding
References
- Abbas F, Zhang F, Ismail M, Khan G, Iqbal J, Alrefaei AF, Albeshr MF. 2023. Optimizing machine learning algorithms for landslide susceptibility mapping along the Karakoram Highway, Gilgit Baltistan, Pakistan: a comparative study of baseline, Bayesian, and metaheuristic hyperparameter optimization techniques. Sensors (Basel). 23(15):6843. doi: 10.3390/S23156843.
- Abdullahi S, Pradhan B. 2016. Sustainable brownfields land use change modeling using GIS-based weights-of-evidence approach. Appl Spat Anal. 9(1):21–38. doi: 10.1007/S12061-015-9139-1/TABLES/5.
- Ahmed B, Ahmed R. 2012. Modeling urban land cover growth dynamics using multi-temporal satellite images: a case study of Dhaka, Bangladesh. IJGI. 1(1):3–31. doi: 10.3390/ijgi1010003.
- Ahmed S. 2018. Assessment of urban heat islands and impact of climate change on socioeconomic over Suez Governorate using remote sensing and GIS techniques. Egy J Remote Sens Space Sci. 21(1):15–25. doi: 10.1016/j.ejrs.2017.08.001.
- Al-Hamdan MZ, Oduor P, Flores AI, Kotikot SM, Mugo R, Ababu J, Farah H. 2017. Evaluating land cover changes in Eastern and Southern Africa from 2000 to 2010 using validated Landsat and MODIS data. Int J Appl Earth Obs Geoinf. 62:8–26. doi: 10.1016/j.jag.2017.04.007.
- Al-Sharif AAA, Pradhan B. 2014. Monitoring and predicting land use change in Tripoli Metropolitan City using an integrated Markov chain and cellular automata models in GIS. Arab J Geosci. 7(10):4291–4301. doi: 10.1007/S12517-013-1119-7/FIGURES/5.
- Al-Sharif AAA, Pradhan B. 2015. A novel approach for predicting the spatial patterns of urban expansion by combining the chi-squared automatic integration detection decision tree, Markov chain and cellular automata models in GIS. Geocarto Int. 30(8):858–881. doi: 10.1080/10106049.2014.997308.
- Baloch MYJ, Zhang W, Chai J, Li S, Alqurashi M, Rehman G, Tariq A, Talpur SA, Iqbal J, Munir M, et al. 2021. Shallow groundwater quality assessment and its suitability analysis for drinking and irrigation purposes. Water. 13(23):3361. doi: 10.3390/w13233361.
- Bera D, Das Chatterjee N, Bera S, Ghosh S, Dinda S. 2023. Comparative performance of Sentinel-2 MSI and Landsat-8 OLI data in canopy cover prediction using Random Forest model: comparing model performance and tuning parameters. Adv Space Res. 71(11):4691–4709. doi: 10.1016/j.asr.2023.01.027.
- Blank J, Clary C, Nichiporuk B. 2014. Drivers of long-term insecurity and instability in Pakistan : urbanization.
- Bloom DE, Canning D, Fink G. 2008. Urbanization and the wealth of nations. Science. 319(5864):772–775. doi: 10.1126/SCIENCE.1153057.
- Bokhari SA, Saqib Z, Ali A, Haq MZu 2018. Perception of residents about urban vegetation: a comparative study of planned versus semi-planned cities of Islamabad and Rawalpindi, Pakistan. J Ecosyst Ecogr. 08(01) doi: 10.4172/2157-7625.1000251.
- Bokhari SA, Saqib Z, Ali A, Mahmud A, Akhtar N, Kanwal A, Haq MZu 2021. The impacts of land use/land cover changes on the supply-demand budget of urban ecosystem services. Arab J Geosci. 14(14):1–27. doi: 10.1007/S12517-021-07504-6/TABLES/5.
- Bradshaw CJA, Sodhi NS, Peh KSH, Brook BW. 2007. Global evidence that deforestation amplifies flood risk and severity in the developing world. Glob Change Biol. 13(11):2379–2395. doi: 10.1111/j.1365-2486.2007.01446.x.
- Breiman L. 2001. Random forests. Mach Learn. 45(1):5–32. doi: 10.1023/A:1010933404324/METRICS.
- Busgeeth K, Brits A, Whisken J. 2008. Potential application of remote sensing in monitoring informal settlements in developing countries where complimentary data does not exist.
- Butt A, Shabbir R, Ahmad SS, Aziz N. 2015. Land use change mapping and analysis using Remote Sensing and GIS: a case study of Simly watershed, Islamabad, Pakistan. Egy J Remote Sens Space Sci. 18(2):251–259. doi: 10.1016/j.ejrs.2015.07.003.
- Cai E, Jing Y, Liu Y, Yin C, Gao Y, Wei J. 2017. Spatial-temporal patterns and driving forces of ecological-living-production land in Hubei Province, Central China. Sustainability 2018. 10(2):66. doi: 10.3390/su10010066.
- CDA. 2022. Facts & statistics - Islamabad. Capital Development Authority. https://www.cda.gov.pk/about_islamabad/vitalstats.asp.
- Dey NN, Al Rakib A, Kafy AA, Raikwar V. 2021. Geospatial modelling of changes in land use/land cover dynamics using Multi-layer Perceptron Markov chain model in Rajshahi City, Bangladesh. Environ Chall. 4:100148. doi: 10.1016/j.envc.2021.100148.
- Eastman JR. 2006. IDRISI Andes Tutorial.
- El Ghoul I, Sellami H, Khlifi S, Vanclooster M. 2023. Impact of land use land cover changes on flow uncertainty in Siliana watershed of northwestern Tunisia. CATENA. 220:106733. doi: 10.1016/j.catena.2022.106733.
- El-Hattab M, S.m A, G.e L. 2018. Monitoring and assessment of urban heat islands over the Southern region of Cairo Governorate, Egypt. Egy J Remote Sens Space Sci. 21(3):311–323. doi: 10.1016/j.ejrs.2017.08.008.
- Ewane BE, Lee HH. 2020. Assessing land use/land cover change impacts on the hydrology of Nyong River Basin, Cameroon. J Mt Sci. 17(1):50–67. doi: 10.1007/S11629-019-5611-8/METRICS.
- Ewane EB. 2020. Assessing land use and landscape factors as determinants of water quality trends in Nyong River basin, Cameroon. Environ Monit Assess. 192(8) doi: 10.1007/s10661-020-08448-2.
- Ewane EB. 2021. Land use land cover change and the resilience of social-ecological systems in a sub-region in South west Cameroon. Environ Monit Assess. 193(6):338. doi: 10.1007/S10661-021-09077-Z/FIGURES/8.
- Fattah MA, Morshed SR, Morshed SY. 2021. Multi-layer perceptron-Markov chain-based artificial neural network for modelling future land-specific carbon emission pattern and its influences on surface temperature. SN Appl Sci. 3(3):1–22. doi: 10.1007/S42452-021-04351-8/TABLES/17.
- Fortin MJ, Boots B, Csillag F, Remmel TK. 2003. On the role of spatial stochastic models in understanding landscape indices in ecology. Oikos. 102(1):203–212. doi: 10.1034/j.1600-0706.2003.12447.x.
- Geneletti D. 2013. Assessing the impact of alternative land-use zoning policies on future ecosystem services. Environ Impact Assess Rev. 40(1):25–35. doi: 10.1016/j.eiar.2012.12.003.
- Ghalib A, Qadir A, Ahmad SR. 2017. Evaluation of developmental progress in some cities of Punjab, Pakistan, using urban sustainability indicators. Sustainability. 9(8):1473. doi: 10.3390/su9081473.
- Gontier M, Mörtberg U, Balfors B. 2010. Comparing GIS-based habitat models for applications in EIA and SEA. Environ Impact Assess Rev. 30(1):8–18. doi: 10.1016/j.eiar.2009.05.003.
- Gutman G, Radeloff V. 2017. Land-cover and land-use changes in Eastern Europe after the collapse of the Soviet Union in 1991. Land-Cover and Land-Use Changes in Eastern Europe after the Collapse of the Soviet Union in 1991. 1–247. doi: 10.1007/978-3-319-42638-9.
- Guzder-Williams B, Mackres E, Angel S, Blei AM, Lamson-Hall P. 2023. Intra-urban land use maps for a global sample of cities from Sentinel-2 satellite imagery and computer vision. Comput Environ Urban Syst. 100:101917. doi: 10.1016/j.compenvurbsys.2022.101917.
- Halmy MWA, Gessler PE, Hicke JA, Salem BB. 2015. Land use/land cover change detection and prediction in the north-western coastal desert of Egypt using Markov-CA. Appl Geogr. 63:101–112. doi: 10.1016/j.apgeog.2015.06.015.
- Hassan Z, Shabbir R, Ahmad SS, Malik AH, Aziz N, Butt A, Erum S. 2016. Dynamics of land use and land cover change (LULCC) using geospatial techniques: a case study of Islamabad Pakistan. SpringerPlus. 5(1) doi: 10.1186/s40064-016-2414-z.
- Hong D, Gao L, Yao J, Zhang B, Plaza A, Chanussot J. 2021. Graph convolutional networks for hyperspectral image classification. IEEE Trans Geosci Remote Sens. 59(7):5966–5978. doi: 10.1109/TGRS.2020.3015157.
- Hong D, Gao L, Yokoya N, Yao J, Chanussot J, Du Q, Zhang B. 2021. More diverse means better: multimodal deep learning meets remote-sensing imagery classification. IEEE Trans Geosci Remote Sens. 59(5):4340–4354. doi: 10.1109/TGRS.2020.3016820.
- Hong D, Yokoya N, Chanussot J, Zhu XX. 2018. An augmented linear mixing model to address spectral variability for hyperspectral unmixing. IEEE Trans Image Process. 28(4):1923–1938. doi: 10.1109/TIP.2018.2878958.
- Hu ZJ, Sadda SR. 2019. Image analysis tools for assessment of atrophic macular diseases. Computational Retinal Image Analysis. Amsterdam, The Netherlands: Elsevier; p. 353–378. doi: 10.1016/B978-0-08-102816-2.00018-6.
- Hussain S, Karuppannan S. 2023. Land use/land cover changes and their impact on land surface temperature using remote sensing technique in district Khanewal, Punjab Pakistan. Geol Ecol Landsc. 7(1):46–58. doi: 10.1080/24749508.2021.1923272.
- Hussain S, Lu L, Mubeen M, Nasim W, Karuppannan S, Fahad S, Tariq A, Mousa BG, Mumtaz F, Aslam M. 2022. Spatiotemporal variation in land use land cover in the response to local climate change using multispectral remote sensing data. Land. 11(5):595. doi: 10.3390/land11050595.
- Hussain S, Mubeen M, Karuppannan S. 2022. Land use and land cover (LULC) change analysis using TM, ETM + and OLI Landsat images in district of Okara, Punjab, Pakistan. Phys Chem Earth, Parts A/B/C. 126:103117. doi: 10.1016/j.pce.2022.103117.
- Hussain S, Qin S, Nasim W, Bukhari MA, Mubeen M, Fahad S, Raza A, Abdo HG, Tariq A, Mousa BG, et al. 2022. Monitoring the dynamic changes in vegetation cover using spatio-temporal remote sensing data from 1984 to 2020. Atmosphere. 13(10):1609. doi: 10.3390/atmos13101609.
- IDRISI. IDRISI. 2012. IDRISI Selva GIS Image Processing Brochure - [PDF Document]. Software. https://vdocument.in/idrisi-selva-gis-image-processing-brochure.html.
- Iqbal J, Su C, Rashid A, Yang N, Baloch MYJ, Talpur SA, Ullah Z, Rahman G, Rahman NU, Earjh E, et al. 2021. Hydrogeochemical assessment of groundwater and suitability analysis for domestic and agricultural utility in Southern Punjab, Pakistan. Water. 13(24):3589. doi: 10.3390/w13243589.
- Iqbal J, Su C, Wang M, Abbas H, Baloch MYJ, Ghani J, Ullah Z, Huq ME. 2023. Groundwater fluoride and nitrate contamination and associated human health risk assessment in South Punjab, Pakistan. Environ Sci Pollut Res Int. 30(22):61606–61625. doi: 10.1007/S11356-023-25958-X/METRICS.
- Jat Baloch MY, Zhang W, Shoumik BAA, Nigar A, Elhassan AAM, Elshekh AEA, Bashir MO, Mohamed Salih Ebrahim AF, Adam Mohamed KA, Iqbal J. 2022. Hydrogeochemical mechanism associated with land use land cover indices using geospatial, Remote sensing techniques, and health risks model. Sustainability. 14(24):16768. doi: 10.3390/su142416768.
- Jenness J, Wynne J. 2005. Cohen’s Kappa and Classification Table Metrics 2.0 : an ArcView 3x Extension for Accuracy Assessment of Spatially Explicit Models. USGS Publications Warehouse. doi: 10.3133/OFR20051363.
- Kafy A-A, Islam M, Sikdar S, Ashrafi TJ, Al-Faisal A, Islam MA, Al Rakib A, Hasan Khan MH, Sarker MHS, Ali MY. 2021. Remote sensing-based approach to identify the influence of land use/land cover change on the urban thermal environment : a case study in Chattogram City, Bangladesh. Re-Envisioning Remote Sensing Applications, London: Taylor & Francis Group; p. 217–240. doi: 10.1201/9781003049210-16.
- Kafy, A. Al, Abdullah-Al-Faisal, Raikwar, V., Rakib, A. Al, Kona, M. A., & Ferdousi, J. (2021). Geospatial approach for developing an integrated water resource management plan in Rajshahi, Bangladesh. Environ Chall, 4, 100139. doi: 10.1016/j.envc.2021.100139.
- Kafy AA, Rahman MS, Faisal AA, Hasan MM, Islam M. 2020. Modelling future land use land cover changes and their impacts on land surface temperatures in Rajshahi, Bangladesh. Remote Sens Appl: Soc Environ. 18:100314. doi: 10.1016/j.rsase.2020.100314.
- Khan, JA, Khayyam U, Waheed A, Khokhar MF, Kamran. 2023. Exploring the nexus between land use land cover (LULC) changes and population growth in a planned city of islamabad and unplanned city of Rawalpindi, Pakistan. Heliyon, 9(2), e13297. doi: 10.1016/J.HELIYON.2023.E13297.
- Kamusoko C, Aniya M, Adi B, Manjoro M. 2009. Rural sustainability under threat in Zimbabwe – simulation of future land use/cover changes in the Bindura district based on the Markov-cellular automata model. Appl Geogr. 29(3):435–447. doi: 10.1016/j.apgeog.2008.10.002.
- Khalifa MA. 2015. Evolution of informal settlements upgrading strategies in Egypt: from negligence to participatory development. Ain Shams Eng J. 6(4):1151–1159. doi: 10.1016/j.asej.2015.04.008.
- Khan A, Sudheer M. 2022. Machine learning-based monitoring and modeling for spatio-temporal urban growth of Islamabad. Egy J Remote Sens Space Sci. 25(2):541–550. doi: 10.1016/j.ejrs.2022.03.012.
- Khan MS, Ullah S, Sun T, Rehman AU, Chen L. 2020. Land-use/land-cover changes and its contribution to urban heat island: a case study of Islamabad, Pakistan. Sustainability. 12(9):3861. doi: 10.3390/su12093861.
- Khoi DD, Murayama Y. 2010. Forecasting areas vulnerable to forest conversion in the tam Dao National Park region, Vietnam. Remote Sens. 2(5):1249–1272. doi: 10.3390/rs2051249.
- Kombe WJ. 2005. Land use dynamics in peri-urban areas and their implications on the urban growth and form: the case of Dar es Salaam, Tanzania. Habitat Int. 29(1):113–135. doi: 10.1016/S0197-3975(03)00076-6.
- Kuffer M, Barros J. 2011. Urban morphology of unplanned settlements: the use of spatial metrics in VHR remotely sensed images. Procedia Environ Sci. 7:152–157. doi: 10.1016/j.proenv.2011.07.027.
- Lambin EF, Meyfroidt P. 2011. Global land use change, economic globalization, and the looming land scarcity. Proc Natl Acad Sci U S A. 108(9):3465–3472. doi: 10.1073/PNAS.1100480108/SUPPL_FILE/PNAS.201100480SI.PDF.
- Leta MK, Demissie TA, Tränckner J. 2021. Modeling and prediction of land use land cover change dynamics based on land change modeler (LCM) in Nashe watershed, Upper Blue Nile Basin, Ethiopia. Sustainability. 13(7):3740. doi: 10.3390/su13073740.
- Li C, Zhang B, Hong D, Yao J, Chanussot J. 2023. LRR-Net: an interpretable deep unfolding network for hyperspectral anomaly detection. IEEE Trans Geosci Remote Sens. 61:1–12. doi: 10.1109/TGRS.2023.3279834.
- Li Y, Cao Z, Long H, Liu Y, Li W. 2017. Dynamic analysis of ecological environment combined with land cover and NDVI changes and implications for sustainable urban–rural development: the case of Mu Us Sandy Land, China. J Cleaner Prod. 142:697–715. doi: 10.1016/j.jclepro.2016.09.011.
- Liverman DM, Cuesta RMR. 2008. Human interactions with the Earth system: people and pixels revisited. Earth Surf Process Landforms. 33(9):1458–1471. doi: 10.1002/esp.1715.
- Maithani S. 2014. Neural networks-based simulation of land cover scenarios in Doon valley, India. Geocarto Int. 30(2):1–23. doi: 10.1080/10106049.2014.927535.
- Makinde OO. 2012. Urbanization, housing and environment: megacities of Africa. Int J Dev Sustain. 1(3). www.isdsnet.com/ijds.
- Malik N, Asmi F, Ali M, Rahman MM. 2017. Major factors leading rapid urbanization in China and Pakistan: a comparative study. JSSS. 5(1):148. doi: 10.5296/jsss.v5i1.11710.
- Malik S, Wahid J. 2014. Rapid urbanization: problems and challenges for adequate housing in Pakistan. JSSW. 2(2) doi: 10.15640/jssw.v2n2a6.
- Manandhar R, Odeh I, Ancev T. 2009. Improving the accuracy of land use and land cover classification of landsat data using post-classification enhancement. remote. Sens. 1(3):330–344. doi: 10.3390/rs1030330.
- Mas JF, Kolb M, Paegelow M, Camacho Olmedo MT, Houet T. 2014. Inductive pattern-based land use/cover change models: a comparison of four software packages. Environ Modell Softw. 51:94–111. doi: 10.1016/j.envsoft.2013.09.010.
- McCarthy MJ, Radabaugh KR, Moyer RP, Muller-Karger FE. 2018. Enabling efficient, large-scale high-spatial resolution wetland mapping using satellites. Remote Sens Environ. 208:189–201. doi: 10.1016/j.rse.2018.02.021.
- McHugh ML. 2012. Interrater reliability: the kappa statistic. Biochem Med. 22(3):276–282. doi: 10.11613/BM.2012.031.
- Metropolitan A, Rahman Rakad Alshabeeb A, Alshawabkeh Y, Rezgallah Al-Amoush H, Al-Fugara R, Kif A-SA, Rahman Al-Shabeeb A, Rania Q, Al-Amoush H, Al-Adamat R. 2018. Simulation and prediction of urban spatial expansion in highly vibrant cities using the sleuth model: a case study of Amman metropolitan, Jordan. https://www.researchgate.net/publication/323238203.
- Mishra VN, Rai K, Mohan K. 2014. Prediction of land use changes based on land change modeler (LCM) using remote sensing: a case study of Muzaffarpur (Bihar), India. J Geographical I JC. 64(1):111–127. doi: 10.2298/IJGI1401111M.
- Mishra VN, Rai PK. 2016. A remote sensing aided multi-layer perceptron-Markov chain analysis for land use and land cover change prediction in Patna district (Bihar), India. Arab J Geosci. 9(4):1–18. doi: 10.1007/S12517-015-2138-3/FIGURES/10.
- Mishra VN, Rai PK, Prasad R, Punia M, Nistor MM. 2018. Prediction of spatio-temporal land use/land cover dynamics in rapidly developing Varanasi district of Uttar Pradesh, India, using geospatial approach: a comparison of hybrid models. Appl Geomat. 10(3):257–276. doi: 10.1007/S12518-018-0223-5/TABLES/12.
- Mitsuda Y, Ito S. 2011. A review of spatial-explicit factors determining spatial distribution of land use/land-use change. Landscape Ecol Eng. 7(1):117–125. doi: 10.1007/S11355-010-0113-4/TABLES/1.
- Morales-Barquero L, Lyons MB, Phinn SR, Roelfsema CM. 2019. Trends in remote sensing accuracy assessment approaches in the context of natural resources. Remote Sens. 11(19):2305. doi: 10.5281/ZENODO.3464691.
- Mozumder C, Tripathi NK. 2014. Geospatial scenario based modelling of urban and agricultural intrusions in Ramsar wetland Deepor Beel in Northeast India using a multi-layer perceptron neural network. Int J Appl Earth Obs Geoinf. 32(1):92–104. doi: 10.1016/j.jag.2014.03.002.
- Naeem S, Cao C, Fatima K, Najmuddin O, Acharya BK. 2018. Landscape greening policies-based land use/land cover simulation for Beijing and Islamabad—an implication of sustainable urban ecosystems. Sustainability 2018. 10(4):10, 1049. doi: 10.3390/su10041049.
- Nath B, Niu Z, Singh RP. 2018. Land use and land cover changes, and environment and risk evaluation of Dujiangyan City (SW China) using remote sensing and GIS techniques. Sustainability. 10(12):4631. doi: 10.3390/su10124631.
- Nguyen HTT, Doan TM, Radeloff V. 2018. Applying random forest classification to map land use/land cover using Landsat 8 OLI. Int Arch Photogramm Remote Sens Spatial Inf Sci. XLII-3/W4(3W4):363–367. doi: 10.5194/isprs-archives-XLII-3-W4-363-2018.
- Nguyen T. 2015. Optimal ground control points for geometric correction using genetic algorithm with global accuracy. Eur J Remote Sens. 48(1):101–120. doi: 10.5721/EuJRS20154807.
- Niquisse S, Cabral P, Rodrigues Â, Augusto G. 2017. Ecosystem services and biodiversity trends in Mozambique as a consequence of land cover change. Int J Biodivers Sci Ecosyst Serv Manage. 13(1):297–311. doi: 10.1080/21513732.2017.1349836/SUPPL_FILE/TBSM_A_1349836_SM1650.ZIP.
- Omurakunova G, Bao A, Jiapaer G, Khan G, Jiang L, Jolochieva E. 2021. Urban growth dynamics during the period 1992–2013 in Kyrgyzstan based on DMSP-OLS nightlight satellite data. Arab J Geosci. 14(19) doi: 10.1007/s12517-021-08291-w.
- Ozturk D. 2015. Urban growth simulation of Atakum (Samsun, Turkey) using cellular automata-Markov chain and multi-layer perceptron-Markov chain models. Remote Sens. 7(5):5918–5950. doi: 10.3390/rs70505918.
- PBS. 2017. Census. Pakistan Bureau of Statistics. https://www.pbs.gov.pk/content/final-results-census-2017.
- Pontius RG, Millones M. 2011. Death to Kappa: birth of quantity disagreement and allocation disagreement for accuracy assessment. Int J Remote Sens. 32(15):4407–4429. doi: 10.1080/01431161.2011.552923.
- Rashid A, Ayub M, Ullah Z, Ali A, Sardar T, Iqbal J, Gao X, Bundschuh J, Li C, Khattak SA, et al. 2023. Groundwater quality, health risk assessment, and source distribution of heavy metals contamination around chromite mines: application of GIS, sustainable groundwater management, geostatistics, PCAMLR, and PMF receptor model. Int J Environ Res Public Health. 20(3):2113. doi: 10.3390/IJERPH20032113/S1.
- Saha P, Mitra R, Chakraborty K, Roy M. 2022. Application of multilayer perceptron neural network Markov Chain model for LULC change detection in the sub-Himalayan North Bengal. Remote Sens Appl: Soc Environ. 26:100730. doi: 10.1016/j.rsase.2022.100730.
- Sakieh Y, Salmanmahiny A, Jafarnezhad J, Mehri A, Kamyab H, Galdavi S. 2015. Evaluating the strategy of decentralized urban land-use planning in a developing region. Land Use Policy. 48:534–551. doi: 10.1016/j.landusepol.2015.07.004.
- Salazar A, Baldi G, Hirota M, Syktus J, McAlpine C. 2015. Land use and land cover change impacts on the regional climate of non-Amazonian South America: a review. Glob Planet Change. 128:103–119. doi: 10.1016/j.gloplacha.2015.02.009.
- Sánchez-Espinosa A, Schröder C. 2019. Land use and land cover mapping in wetlands one step closer to the ground: sentinel-2 versus landsat 8. J Environ Manage. 247:484–498. doi: 10.1016/J.JENVMAN.2019.06.084.
- Shah A, Ali K, Nizami SM. 2021. Four decadal urban land degradation in Pakistan a case study of capital city islamabad during 1979–2019. Environ Sustain Indic. 10:100108. doi: 10.1016/j.indic.2021.100108.
- Shahbaz M, Chaudhary AR, Ozturk I. 2017. Does urbanization cause increasing energy demand in Pakistan? Empirical evidence from STIRPAT model. Energy. 122:83–93. doi: 10.1016/j.energy.2017.01.080.
- Tanguay GA, Rajaonson J, Lefebvre JF, Lanoie P. 2010. Measuring the sustainability of cities: an analysis of the use of local indicators. Ecol Indic. 10(2):407–418. doi: 10.1016/j.ecolind.2009.07.013.
- Tendaupenyu P, Magadza CHD, Murwira A. 2017. Changes in landuse/landcover patterns and human population growth in the Lake Chivero catchment, Zimbabwe. Geocarto Int. 32(7):797–811. doi: 10.1080/10106049.2016.1178815.
- Tokar O, Vovk O, Kolyasa L, Havryliuk S, Korol M. 2018. Using the random forest classification for land cover interpretation of landsat images in the prykarpattya region of Ukraine. Int Sci Tech Conf Comput Sci Inf Technol. 1, 241–244. doi: 10.1109/STC-CSIT.2018.8526646.
- Tolessa T, Senbeta F, Kidane M. 2017. The impact of land use/land cover change on ecosystem services in the central highlands of Ethiopia. Ecosyst Serv. 23:47–54. doi: 10.1016/j.ecoser.2016.11.010.
- Ullah S, Ahmad K, Sajjad RU, Abbasi AM, Nazeer A, Tahir AA. 2019. Analysis and simulation of land cover changes and their impacts on land surface temperature in a lower Himalayan region. J Environ Manage. 245:348–357. doi: 10.1016/J.JENVMAN.2019.05.063.
- Ullah Z, Rashid A, Ghani J, Nawab J, Zeng XC, Shah M, Alrefaei AF, Kamel M, Aleya L, Abdel-Daim MM, et al. 2022. Groundwater contamination through potentially harmful metals and its implications in groundwater management. Front Environ Sci. 10:1021596. doi: 10.3389/FENVS.2022.1021596/BIBTEX.
- Ullah Z, Xu Y, Zeng XC, Rashid A, Ali A, Iqbal J, Almutairi MH, Aleya L, Abdel-Daim MM, Shah M. 2022. Non-carcinogenic health risk evaluation of elevated fluoride in groundwater and its suitability assessment for drinking purposes based on water quality index. IJERPH. 19(15):9071. doi: 10.3390/ijerph19159071.
- Umair A. 2022. March 14. Islamabad fast losing its charm due to rapid urbanisation. The News International. https://www.thenews.com.pk/print/941223-islamabad-fast-losing-its-charm-due-to-rapid-urbanisation.
- Umar A. 2022. March 14. Islamabad fast losing its charm due to rapid urbanisation. International The News. https://www.thenews.com.pk/print/941223-islamabad-fast-losing-its-charm-due-to-rapid-urbanisation.
- Václavík T, Rogan J. 2009. Identifying trends in land use/land cover changes in the context of post-socialist transformation in Central Europe: a case study of the greater Olomouc region, Czech Republic. GISci Remote Sens. 46(1):54–76. doi: 10.2747/1548-1603.46.1.54.
- Verburg PH, Kok K, Pontius RG, Veldkamp A. 2006. Model Land-Use Land-Cover Change. 117–135. doi: 10.1007/3-540-32202-7_5.
- Wang SQ, Zheng XQ, Zang XB. 2012. Accuracy assessments of land use change simulation based on Markov-cellular automata model. Procedia Environ Sci. 13:1238–1245. doi: 10.1016/j.proenv.2012.01.117.
- Wu J, Jenerette GD, Buyantuyev A, Redman CL. 2011. Quantifying spatiotemporal patterns of urbanization: the case of the two fastest growing metropolitan regions in the United States. Ecol Complex. 8(1):1–8. doi: 10.1016/j.ecocom.2010.03.002.
- Wu X, Hong D, Chanussot J. 2022. Convolutional neural networks for multimodal remote sensing data classification. IEEE Trans Geosci Remote Sen. 60:1–10. doi: 10.1109/TGRS.2021.3124913.
- Yang C, He X, Yan F, Yu L, Bu K, Yang J, Chang L, Zhang S. 2017. Mapping the influence of land use/land cover changes on the urban heat island effect—a case study of Changchun, China. Sustainability. 9(2):312. doi: 10.3390/su9020312.
- Ying C, Ling H, Kai H. 2017. Change and optimization of landscape patterns in a basin based on remote sensing images: a case study in China. Pol J Environ Stud. 26(5):2343–2353. doi: 10.15244/pjoes/70007.
- Yirsaw E, Wu W, Shi X, Temesgen H, Bekele B. 2017. Land use/land cover change modeling and the prediction of subsequent changes in ecosystem service values in a coastal area of China, the Su-Xi-Chang region. Sustainability. 9(7):1204. doi: 10.3390/su9071204.
- Zhang XQ. 2016. The trends, promises and challenges of urbanisation in the world. Habitat Int. 54:241–252. doi: 10.1016/j.habitatint.2015.11.018.