
Abstract
Landslide susceptibility mapping (LSM) research is vital for averting and mitigating regional landslide disasters. Nevertheless, there has been a lack of systematic analysis regarding LSM's developmental drivers. Utilizing SciMAT, a scientometric tool, we analyzed 1661 papers on LSM from the Web of Science core collection database, spanning 1993 to 2022. We employed cluster and thematic evolution analysis in SciMAT to unveil trends. The results indicate a consistent upward trend over the past three decades. LSM modeling methods, geological data, and contributing factors are major focal points. Notably, the evolution of LSM models, with a rising adoption of machine learning and deep learning for risk assessment, emerges as a central knowledge pathway. This study offers valuable insights to scholars by identifying literature gaps and highlighting crucial research directions, facilitating informed decision-making in the realm of LSM.
SciMAT tool initially employs cluster analysis and thematic evolution analysis to pinpoint the current popular themes and evolutionary trends of landslide susceptibility.
The main trajectory of knowledge lies in the progression of landslide modeling methods.
The latest trend in landslide susceptibility research is centered on the use of deep learning techniques, particularly convolutional neural networks, to achieve precise risk zonation.
The study aims to highlight critical research directions, predict the future of LSM technology, and provide guidance for scholars.
HIGHLIGHTS
1. Introduction
Landslides are a prevalent and serious geological hazard that poses a significant threat to both life and property safety (Guzzetti et al. Citation1999; Guzzetti et al. Citation2012; Li et al. Citation2020; Dou et al. Citation2023). In recent years, human activities and global changes have led to a significant increase in the frequency of landslide disasters, causing substantial harm to social and economic development (Dou et al. Citation2019; Merghadi et al. Citation2020). To address this issue, prediction and risk assessment of landslides is key to reducing loss of lives and property damage (Huang et al. Citation2021; Dou et al. Citation2020). landslide susceptibility mapping (LSM) research aims to predict the spatial distribution and likelihood of landslides (Guzzetti et al. Citation2005). LSM indicates the landslide-prone areas, which can be used by policy-makers, scientists, engineers, and the general public to avoid catastrophic landslides (Nurwatik et al. Citation2022; Ji et al. Citation2023). It represents a fundamental step toward assessing landslide hazards and developing mitigation strategies (Dou et al. Citation2019; Li et al. Citation2020). Therefore, conducting landslide susceptibility modeling and mapping research is essential.
The study of landslide susceptibility began in the 1980s and 1990s, with early papers discussing qualitative and quantitative methods for modeling and mapping susceptibility (Aleotti and Chowdhury Citation1999; Guzzetti et al. Citation1999). Montgomery and Dietrich (Citation1994) used a physical method, namely a simple limit equilibrium model, to model landslide susceptibility. Later on, more sophisticated physical methods have been applied (Rigon et al. Citation2006; van Asch et al. Citation2007; Simoni et al. Citation2008; Anagnostopoulos and Burlando Citation2012; Anagnostopoulos et al. Citation2015; Alvioli and Baum Citation2016). These methods are mainly applied to cases where the landslide type is relatively simple and the basic physical properties of the study object are fairly consistent. physical method relies on physical laws and can analyze the main factors, but it is very demanding in terms of parameters and is limited to small-scale areas. After 2010, statistical models and machine learning gradually became the most frequently used methods for landslide susceptibility modeling. In addition, advances in GIS technology have resulted in the emergence of numerous quantitative methods and techniques in statistical models, which mainly contribute to understanding landslide patterns and triggering mechanisms (Pham et al. Citation2016; Dou et al. Citation2019). In recent years, many advanced machine learning (ML) techniques have been developed to model the complex relationships between landslides and causal factors (Nurwatik et al. Citation2022; C. Huang et al. Citation2022; Sarfraz et al. Citation2022; Kulsoom et al. Citation2023; Liang et al. Citation2023). Various landslide susceptibility models produced by different statistical methods can be implemented in machine learning environments to obtain accurate risk zoning maps. The success of ML in landslide susceptibility mapping is further enhanced by easily accessible satellite images, remote sensing data, historical records of landslides, and geographical information systems (GIS). Further, these landslide hazard techniques can be applied at different scales depending on the area to be studied, the geological and geo-morphological factors to be considered. The performance of the final model is also related to the quantity and quality of the data, the different sampling strategies used, etc (Chang et al. Citation2023; Gupta and Shukla Citation2023; Ji et al. Citation2023; Zhuo et al. Citation2023). This paper intends to present a bibliometric analysis of publications on landslide susceptibility in the period of 1993-2022.
Several literature surveys and critical review articles have been conducted with diverse analysis contents to collate a large amount of annual growth landslide susceptibility documents. Pourghasemi et al. (Citation2018) investigated the research background of landslide susceptibility worldwide from 2005 to 2016, identifying important elements for increasing research interest in the topic. Reichenbach et al. (Citation2018) reviewed statistical methods for landslide susceptibility modeling and associated terrain zonation based on the analysis of the information collected in the literature database. Merghadi et al. (Citation2020) presented an overview of the most popular machine learning techniques available for landslide susceptibility, including background information on their operation, implementation, and performance. Ma et al. (Citation2021) critically reviewed current machine learning models for landslide susceptibility investigations and suggested exploring the application of deep learning methods in future work. Ado et al. (Citation2022) comprehensively discussed the application of recently developed hybrid, integrated, and deep learning approaches to landslide susceptibility assessment and demonstrated that deep learning models can overcome the limitations of traditional machine learning models to generate more accurate landslide susceptibility maps. Liu et al. (Citation2023) comprehensively reviewed the whole process of generating landslide susceptibility maps based on machine learning methods, and discusses the topics for future research. Although the above reviews provide valuable insights into the field of landslide susceptibility, most of them are reviewed based on classification and combination of literature, and they mostly focused on comparative studies of different approaches without providing a holistic and comprehensive review of the field of landslide susceptibility, and there was a certain subjectivity in the research content. This subjective survey method cannot accurately grasp the research trends in landslide susceptibility and would raise concerns about the representativeness and potential bias of the papers studied.
In recent years, with the rapid development of information technology, it has become increasingly popular for scholars to identify the structure and evolution of knowledge in research areas by drawing visual scientific mapping tools for literature data mining. Various bibliometric methods and visualization tools have been used to explore the research hotspots, frontiers, and trends, the analysis tools including R language, VOSviewer, and CiteSpace (Fosso Wamba et al. Citation2020; Putri et al. Citation2021). These bibliometric methods have strong capabilities for bibliometric coupling and collaborative relationship network analysis. The extensive range of research conducted and the span of time covered in existing publications (1993–2022) underscores the suitability of employing a comprehensive bibliometric analysis as an effective approach to gain insights into the overall landscape of research in a particular field. Such analysis aids researchers in obtaining a holistic view of the research area, identifying emerging trends, and facilitating informed decision-making by supporting other researchers (Liu et al. Citation2022; Yong et al. Citation2022). However, the utilization of bibliometric methods and visualization tools specifically for assessing landslide susceptibility studies remains limited to a few literature surveys and reviews. Notably, four review articles have been identified [Liu et al. Citation2022; Yong et al. Citation2022; Huang et al. Citation2022; Pacheco Quevedo et al. Citation2023], all of which were published in 2022. These reviews employed visualization scientific mapping tools for LSM, which are listed on the Web of Science (WoS) as review articles. presents these four bibliometric articles, providing details such as the authors’ names, article titles, utilized visualization scientific mapping tools, and research objectives. Despite the existence of previous bibliometric studies on LSM, none of them have exhibited the same level of dynamic evolutionary process analysis as demonstrated in this present study. Notably, these studies have failed to adopt a broad approach, such as extensively investigating future research trends related to the subject matter, as has been conducted in this study. This significant differentiation may arise from the limitations of the aforementioned scientific mapping tools in accurately analyzing thematic development and temporal changes, which highlights the distinctive contribution of the present article. Motivated by this scientific gap, the main objective of our research is to address three fundamental questions:
Table 1. Bibliometric articles found in the scientific literature that approaches LSM.
Q1: What are the popular themes in LSM research?
Q2: What are the dynamic evolutionary processes of LSM research?
Q3: What are the trends of LSM research and opportunities for further research in the future?
To achieve our goal, in this review, we used the SciMAT tool for a complete scientific mapping analysis (from pre-processing to bibliometric network analysis), which is a robust pre-processing step compared to other bibliometric software (e.g. VOSviewer, CiteSpace) (Cobo et al. Citation2012). In addition, the scientometric tool SciMAT is unique in presenting the evolution, strategy, and clustering of network maps. Among the existing visualization tools, SciMAT is the best software for analyzing longitudinal time series and tracking the dynamic evolution processes of discipline and themes (Xie et al. Citation2019). Specifically, SciMAT can obtain the cluster network diagram of the research hotpots by constructing the keyword co-occurrence matrix. Based on this, the strategic map can be further formed on the basis of density and centrality value, which can reveal the evolution state of research hotspots and identify the research field’s evolution trend (Qiu et al. Citation2023). In summary, this tool provides an extensive overview and brand-new knowledge perspectives. summarizes the features of SciMAT compared to other scientific mapping software tools. Although SciMAT is a complete and powerful science mapping tool, other software tools have impressive and notable characteristics. Taking into account visualization capabilities, VOSviewer has a powerful GUI that allows us to easily examine the generated maps (Chen et al. Citation2021; Rahman and Haris Citation2022). Therefore, this paper employs VOSviewer to analyze the collaborative network among authors and countries. Moreover, the tool SciMAT is utilized to examine the theme and evolution trend in landslide susceptibility research from 1993 to 2022, based on the core data collection of the Web of Science. Rather than conduct a comprehensive review and diversified analysis of the literature on landslide susceptibility, this study focuses on uncovering the evolutionary characteristics, development status, and future directions of this research. This paper is divided into six parts, and the following parts describe the methodology and dataset used in this paper. Parts II to IV present the bibliometric performance analysis, VOSviewer-based collaboration networks mapping, SciMAT-based science mapping and analysis, and Parts V to VI are the discussion and conclusion.
Table 2. Summary of SciMAT’s characteristics versus other science mapping software tools.
ABCA = author bibliographic coupling; DBCA = document bibliographic coupling; JBCA = journal bibliographic coupling; ACAA = author coauthor; CCAA = country coauthor; ICAA = institution coauthor; ACA = author cocitation; DCA = document cocitation; JCA = journal cocitation; CWA = co-word; DL = direct linkage.
2. Methodology and Dataset
2.1. Methodology
In bibliometrics, there are two primary methods in the field of research: science mapping and performance analysis (Cobo et al. Citation2011). The purpose of scientific mapping is to reveal the behavior patterns and disciplines in scientific research, as well as the interrelationship among the elements at various levels in the structure of scientific knowledge. Currently, more than ten scientific mapping tools have been used in various research, and each software has its advantages (Cobo et al. Citation2012).
VOSviewer, a visualization software researched by Van Eck and Waltman, is a powerful textual-analysis tool for scientific knowledge mapping analysis and is widely used in author collaboration networks, institutional collaboration networks, and literature co-citation analysis. SciMAT software was developed by a research group at the University of Granada, Spain. It is an open-source scientific mapping tool that combines scientific mapping and performance analysis techniques. The software is commonly used to draw up scientific mapping flow, build bibliometric networks, and track the evolution of a research field. The software can achieve several kinds of maps, including overlapping item graphs, strategic maps, cluster network maps, and evolution maps (Cobo et al. Citation2012).
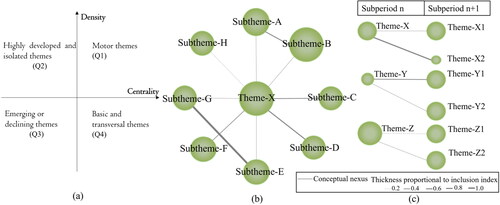
Our research using SciMAT software was conducted in three steps: 1) detecting research themes, 2) drawing the thematic network structure for the research themes, and 3) conducting performance analysis. displays the thematic network structure, and the strategic map () divides research themes based on their centrality and density level into four regions: Motor themes (Q1: Upper-right quadrant), Highly developed and isolated themes (Q2: Upper-left quadrant), Emerging or declining themes (Q3: Lower-left quadrant), and Basic and transversal themes (Q4: Lower-right quadrant). The cluster network map () illustrates the relationship between the theme and its subthemes. The circle size is proportional to the number of documents corresponding to each theme. The thicknesses of the lines between the circles are proportional to the specified index. The evolution map () shows the relationship and development of various themes over different periods. It provides an appropriate image of how the themes preserve a conceptual nexus throughout the following subperiods. The size of each cluster is proportional to the number of core documents and the links indicate co-occurrence among the clusters. Solid lines indicate shared core themes among clusters, suggesting an inheritance relationship between the themes. Dashed lines, on the other hand, represent weak connections between themes, indicating some degree of differentiation between them. The thickness of the lines is proportional to the inclusion index, which indicates that the themes have elements in common.
Figure 1. Strategic map (a); Cluster network map (b); evolution map (c).
2.2. Dataset
The data utilized in this article came from the core collection of the Web of Science. The search was conducted on August 12, 2022. The specific search term was ‘TI = (landslide susceptibility)’. The research focuses on the English language, and the document type was limited to ‘Article’. To ensure a complete research period, the period was defined as ‘1993-2022’ since the first documented paper on landslide susceptibility was recorded in the Web of Science in 1993. After removing duplicates and irrelevant data, a total of 1661 papers were obtained and saved in a text format that could be read directly by VOSviewer and SciMAT.
To accurately identify research hotspots in the field, data cleaning was necessary before analyzing the acquired data. The cleaning function embedded in SciMAT, ‘Find Similar Words by Plurals’ was used for cleaning and manual cleaning. This function allows for the merging of singular and plural forms of keywords, and the identification of keywords with different spellings but the same meaning. Due to the limited number of early publications on landslide susceptibility, this study divided the literature data into four periods, namely 1993-2010, 2011-2015, 2016-2019, and 2020-2022, to ensure data balance and avoid data smoothness. For each period, parameter settings and indexes were established, and the analysis unit included the author’s words and the Source’s words. The data reduction thresholds for the four time periods were set to (1,1,1,1), and the selection matrix was co-occurrence. The network reduction threshold was also set to (1,1,1,1), and the similarity index of the standardized network was set to Association strength. The simple center’s algorithm was chosen as the clustering algorithm. The maximum network value was set to 16, and the minimum was set to 2. The core drawing method and h-index were used, while the Jaccard coefficient was selected as the similarity index for the theme evolution map and the theme overlapping map.
3. Bibliometric performance analysis
The number and trends of published papers in a year reflect the importance and developing trend of a field. The number of articles in LSM has experienced three stages: slow growth, steady growth, and vigorous growth. The first stage was from 1993 to 2015, during which the number of papers was small and grew slowly, indicating that the development of landslide susceptibility had not received enough attention, resulting in low and limited research output. The second stage corresponds to 2016-2019, during which the field of landslide susceptibility showed a developing trend and gained widespread attention from scholars worldwide, leading to a period of expansion and promotion. The third stage is from 2020-2022, during which the field of landslide susceptibility experienced an uptrend and received wide attention. In particular, 596 papers were published, accounting for 35.88% of all publications ().
Figure 2. Number of landslide susceptibility research papers published in different periods.
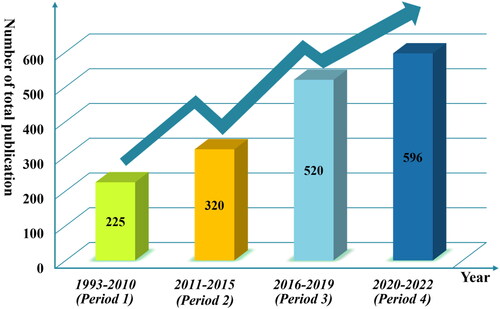
In this paper, the research period was divided into four periods based on the number of documents (). During the early stage (before 2015), research on landslide susceptibility didn’t receive widespread attention and was limited by technology. Although the number of publications increased year by year, it remained at a low level. To avoid data smoothing and maintain data balance, the data was divided into two periods: 1993-2010 was used as the first research period, and 2011-2015 was used as the second research period. Furthermore, there was a rapidly increasing number of publications after 2015. The third period was set as 2016-2019, and the fourth period was 2020-2022. Overall, the study was divided into four research periods: 1993–2010, 2011–2015, 2016–2019, and 2020–2022, with 225, 320, 520, and 596 publications, respectively.
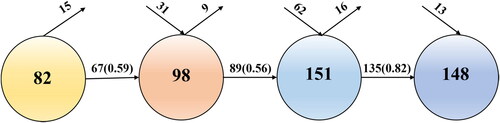
shows the overlapping-items graph of landslide susceptibility over the four study periods above, depicting the emerging and declining keywords in this field. The number of keywords related to landslide susceptibility during each period was 82, 98, 151, and 148, respectively. The research periods of 1993-2010 and 2011-2015 had a total of 180 keywords, with a stability index of 0.59 between the two periods, and the number of papers grew slowly over time (). Due to the limited economic development and theoretical understanding at that time, the research on landslide susceptibility developed slowly for a long time. However, the papers published during the periods generated numerous scientific questions and established the foundation for the development of landslide susceptibility.
Figure 3. Overlapping items graph of landslide susceptibility research field in different periods.
Regarding the journals that publish landslide susceptibility research, shows that the majority of the articles (133) were published in Environmental Earth Sciences, followed by Natural Hazards, Geomorphology, Landslides, Remote Sensing, and other journals. As seen in , the top 10 cited publications in landslide susceptibility include eight papers that were published during 1993-2010. This finding indicates that papers from this period serve as the basis of landslide susceptibility research and the scientific foundation for subsequent research in this field. These articles are frequently cited, implying that an obvious knowledge context has been formed in the later period.
Table 3. Top 10 journals of landslide susceptibility research papers.
Table 4. Top 10 cite publications in the landslide susceptibility research field.
4. Collaboration network mapping based on VOSviewer
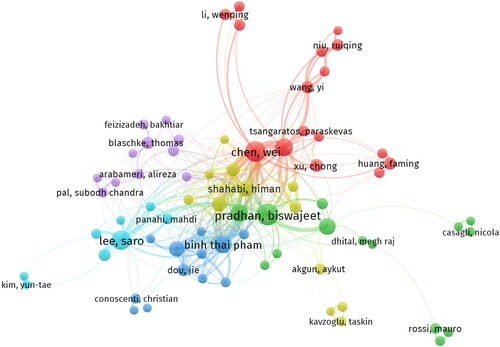
It is worth noting that the analysis of author and country collaboration networks in VOSviewer encompasses all contracted authors and countries, rather than solely the first author and their country. Out of 1661 papers, a total of 4481 authors contributed to the landslide susceptibility study (). However, 76% of the authors published only one paper, while 0.9% (42 authors) published more than ten papers, and 0.2% (11 authors) published more than 20 papers. The top 10 prolific authors were responsible for 27% of all papers, with 443 publications among them. This finding suggests that although many researchers are involved in LSM, only a few produce a large volume of work. Perhaps these researchers have switched research areas or focused on other topics, leaving only a handful to specialize in this field. Biswajeet Pradhan from the University of Technology Sydney was the most productive and cited author, with 74 publications and 10,646 citations. He has been very instrumental in LSM, pioneering the use of machine learning methods in this area. In his most frequently cited publication (Pradhan Citation2013), he employed three different machine learning methods, including decision trees (DT), support vector machines (SVM), and adaptive network-based Fuzzy inference system (ANFIS), to model landslide susceptibility and evaluate their predictive performance. The second most prolific author was Wei Chen from Xi’an University of Science and Technology in China, with 63 papers and 4,775 citations. In recent years, he has utilized various advanced data mining techniques and machine learning methods for landslide susceptibility modeling. In his most cited publication (Chen et al. Citation2017), he compared the performance of the logistic model tree (LMT), random forest (RF), and classification and regression tree (CART).
Figure 4. Collaboration network of authors.
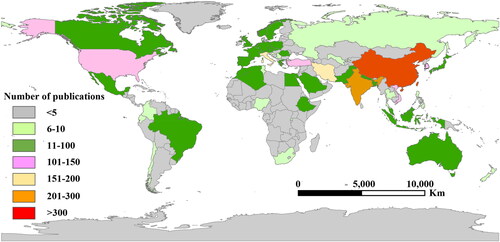
With 90 countries having published literature on landslide susceptibility, there appears to be a geographical clustering of academic activities related to landslide susceptibility research. The most prolific countries are mainly in Asia, Europe, and North America, and most of the published papers are concentrated in a few countries with frequent geologic hazards. China is the world’s most prolific publisher, with 486 papers accounting for 29% of the global total. India, Iran, and Italy follow with 211, 182, and 168 publications, respectively. The remaining countries in the top 10 most productive countries are South Korea (8.97%), the United States (7.89%), Turkey (7.83%), Vietnam (6.50%), Malaysia (5.42%), and Japan (4.76%) (). The number of publications in different countries is related to the incidence of local landslide hazards and the research capacity of relevant research institutes and universities. It is worth noting that the frequency statistics of countries or regions are based on the affiliation of all signatory authors, so individual authors with high productivity are essential for the number of national publications. Collaborative relationships between countries are important and linked to lead authors’ international collaborations. After setting the literature clustering threshold, label optimization is necessary. The cluster analysis map based on the number of publications and country collaborations is shown in . The map has four clusters of different colors, with the largest cluster (red) led by China occupying the center of the map and forming an international collaborative network with 35 countries (links = 35), including the United States, Canada, and Austria. The China cluster maintains co-authorship with the other three international collaboration networks. The blue cluster reflects an international collaborative network with significant nodes in Iran, India, Vietnam, and other countries. At the bottom right of the map, the green cluster mainly includes countries such as Turkey, Brazil, and Slovakia, primarily in Eastern Europe and South America. The remaining yellow cluster, led by Japan, contains the fewest countries, mainly Japan cooperates with several countries in South Asia.
Figure 5. Collaboration network of countries.
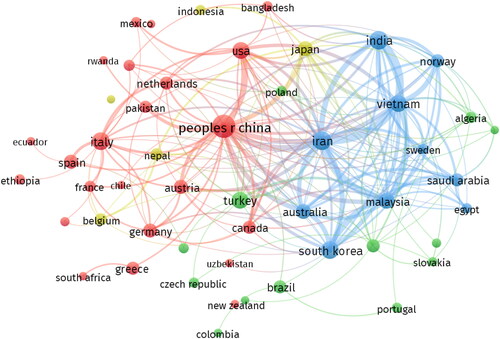
Figure 6. The number of publications in different countries.
5. Science mapping and analysis based on SciMAT for LSM
5.1. Analysis of the Strategic map themes for LSM
The SciMAT strategic map was used to visualize the evolution of themes in the four research periods and to predict future development trends (). The evolution status of the research themes is combined with the clustering literature measurement indicators, such as the total number of documents, total citations, and h-index. In particular, the h-index is positively correlated with the size of the hot themes in the strategic map.
Table 5. The hotspot research topics from 1993 to 2022.
5.1.1 Analysis of hot themes between 1993-2010
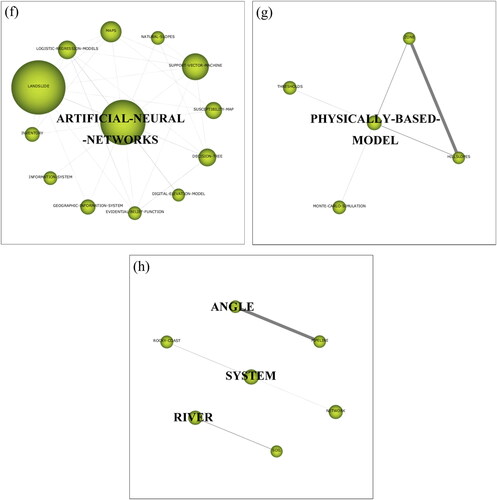
The results indicate that the dominant motor themes in this study period are ‘maps’ and ‘artificial neural networks’, with centrality values of 33.08 and 30.61, density values of 21.05 and 12.37, respectively (). The higher centrality and density values associated with ‘maps’ suggest its greater importance in the field and wider popularity, as well as a strong evolution over time. Clustering network diagrams () illustrate that ‘maps’ and ‘artificial neural networks’ clusters are interconnected with various external subthemes, such as ‘mass movement’, ‘digital-elevation-model’, ‘inventory’, and ‘thresholds’. However, the associations between ‘artificial neural networks’ and these subthemes are loose, indicating that ‘artificial neural networks’ is still in the early stage of development. For example, Gómez and Kavzoglu (Citation2005) employed a range of slope instability characteristics gathered from DEMs, remote sensing images, and documentary data, and showed that the ANN approach provided about 90% overall accuracy, which is promising for future landslide susceptibility zonation investigations.
Figure 7. Strategic map of the 1993 to 2010 period. Note. (a) Strategic map(h-index) and performance from 1993 to 2010. Themes include (b) maps, (c) artificial-neural-networks, (d) hazard, (e) models, (f) landslide.
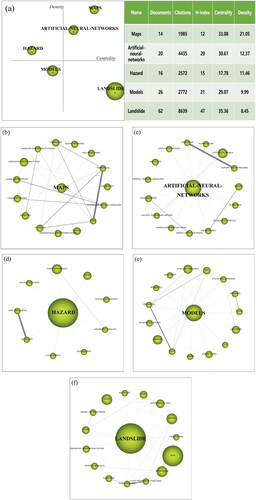
The ‘hazard’ theme is highly developed and isolated, with a centrality value of 17.78 and a density value of 11.46 (). Despite being a mature theme that receives sustained attention in LSM, studies related to ‘hazard’ seem to be highly confined and less interconnected with external subthemes during the study period. reveals a strong connection between ‘land-use-change’ and ‘hillslopes’. Dymond et al. (Citation2006) created a susceptibility model to evaluate the impact of land use changes on landslide occurrences. Their model assigned high susceptibility to precipitous land that is not protected by vegetation and a low susceptibility everywhere else.
The theme of ‘models’ is emerging or declining, with lower centrality and density values of 29.07 and 13.33, respectively (), This indicates a stage of immature development, although the high citation frequency of 2772 implies that research on ‘models’ has a significant impact on later studies. The cluster network map in shows that the ‘models’ theme has complex interconnections with many other subthemes, such as ‘shallow landslides’, ‘soil’, ‘flow’, and ‘mechanism’. Rainfall-induced shallow landslides of the flow type involve various types of soils and often cause enormous social and economic disasters. Sorbino et al. (Citation2010) compared the results obtained from three models (SHALSTAB, TRIGRS, and TRIGRS-unsaturated) by introducing two indices to quantify the ‘success’ and the ‘error’ provided by each model in simulating observed source areas. The authors discussed the advantages and limitations of these models for forecasting the rainfall-induced source areas of shallow landslides over large areas.
The basic and transversal theme is ‘landslide’, with the highest centrality value of 35.36 and the maximum number of citations of 8639 (). This is reasonable because ‘landslide’ is a fundamental concept in LSM. According to the clustering network map (), the thematic word ‘landslide’ is closely connected to different types of subthemes, such as ‘area’, ‘system’, ‘fuzzy-sets’ and ‘island’.
5.1.2. Analysis of hot themes between 2011 and 2015
From 2011 to 2015, ‘hazard’, ‘models’, and ‘artificial neural networks’ remained prominent research topics, while other themes emerged as new areas of interest (). Despite a slow increase in the number of publications, the literature published during this period provided a crucial foundation for subsequent research endeavors.
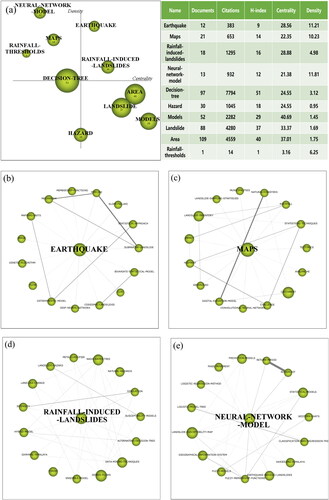
Figure 8. Strategic map of the 2011 to 2015 period. Note. (a) Strategic map(h-index) and performance from 2011 to 2015. Themes include (b) hazard, (c) prediction-models, (d) area, (e) models, (f) artificial-neural-networks, (g) physically-based-model, (h) system, angle, river.
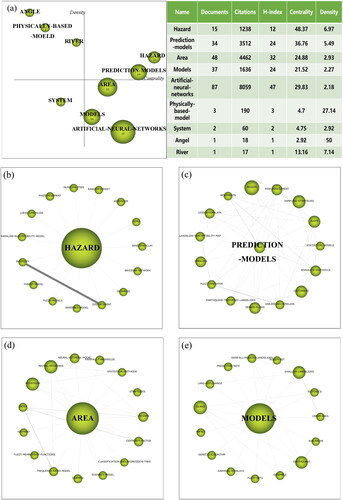
illustrates a strategic diagram that identifies ‘hazard’ and ‘prediction models’ as motor themes. Notably, ‘hazard’ moves from the second quadrant in the 1993-2010 period to the first quadrant in 2011-2015, underscoring the pivotal role of ‘hazard’ in landslide susceptibility research. In contrast to the first period, ‘hazard’ now exhibits more connections with external subthemes, such as ‘database’, ‘sensitive-clay’, ‘displacement’, ‘intensity’, and ‘mass movement’ (). The theme ‘intensity’ is strongly connected with ‘displacement’ in the context of ‘hazard’. For instance, Lenti and Martino (Citation2013) examined the impact of seismic waves and slopes on the existing landslides, where correlations between seismically generated displacements, frequency ratios, Arias intensity, and critical accelerations were observed.
Meanwhile, the theme ‘Prediction models’ appears in the first quadrant with a centrality value of 36.76 and the density value of 5.49 (). It displays complex interconnections with numerous subthemes, such as ‘fuzzy-operator’, ‘Himalaya’, ‘earthquake-triggered-landslides’, ‘bivariate-statistics’, ‘debris-flows’, and ‘risk-assessment’ (). For example, Ghosh et al. (Citation2011) empirically selected and weighted geographical variables of landslides to build prediction models for shallow translational rock and debris sliding in the Darjeeling Himalayas, India. The recommended technique includes bivariate analysis. Similarly, Kayastha et al. (Citation2013) utilized fuzzy operators to build landslide susceptibility maps in the Nepal Himalayas and discovered that the fuzzy gamma operator with a 0.60 gamma value predicts the landslide inventory map best.
In contrast, ‘physically-based-model’, ‘river’, and ‘angle’ are situated in the highly developed or isolated quadrant, with the centrality values of 4.7, 13.16, and 2.92, and density values of 27.14, 7.14, and 50, correspondingly (). They exhibit limited connections with external subthemes. ‘physically-based-model’ is solely associated with ‘thresholds’, ‘Monte-Carlo simulation’, ‘zone’, and ‘hillslopes’, where ‘zone’ is linked to ‘hillslopes’. ‘Angle’ is closely related to the ‘pipeline’, where slope angles must be considered to reduce landslide risks when selecting appropriate pipeline paths in hilly areas (Ma et al. Citation2013).
The theme with a low centrality value of 4.75 and a low-density value of 2.92 in pertains to the ‘system’, suggesting an immature stage of development. It is connected with two subthemes of ‘network’ and ‘rocky-cast’. For instance, Montoya-Montes et al. (Citation2012) used the Rock Engineering System (RES) to evaluate the susceptibility of cliff landslides caused by worn and cracked conglomerate cliffs near pocket beaches.
The themes ‘artificial neural networks’, ‘models’, and ‘area’ have centrality values of 29.83, 21.52, and 24.88, and density values of 2.18, 2.27, and 2.93, respectively. These themes are considered as basic and transversal themes in the current period (). Except the ‘area’ theme is new to this quadrant, ‘artificial neural networks’ and ‘models’ have shifted from the motor theme and the emerging or declining theme, respectively. The evolution indicates that the two themes become the foundation for landslide susceptibility in this period. Furthermore, the cluster network map in and f indicate that the theme of ‘artificial neural networks’ is linked to several subthemes, including ‘landslide’, ‘support-vector-machine’, ‘decision-tree’, ‘logistic-regression-models’, and ‘maps’. However, their linkages are relatively weak. Different machine learning models have been extensively used for the geographical prediction of landslide risks since 2011. For example, Bui et al. (Citation2012) employed support vector machines (SVM), decision tree (DT), and logistic regression (LR) models to predict the susceptibility of landslides in the Hoa Binh region of Vietnam. The results indicated that the SVM model had superior prediction capability. In addition, extensive links exist between the ‘area’ theme and other subthemes, such as ‘index’, ‘frequency-ratio-model’, ‘certainty-factor’, ‘evidence-model’, and ‘weights’, as shown in . The aforementioned models are widely used in landslide susceptibility mapping as robust estimators (Ozdemir and Altural Citation2013).
5.1.3. Analysis of hot themes between 2016 and 2019
The motor themes include ‘earthquake’ and ‘rainfall-induced-landslides’, with centrality values of 28.56 and 28.88 and density values of 11.21 and 4.98 (). These results indicate that research on rainfall-induced landslides and earthquake-induced landslides receive the most attention and become the central focus of LSM research during this period. Both themes are associated with numerous subthemes, as shown in and d. However, intricate linkages could be observed among several subthemes including, ‘intensity’, ‘simulation’, ‘landslide hazard’, and ‘susceptibility models’. These linkages seem to be equally important when investigating rainfall-induced landslides, which is in contrast with the stronger associations between ‘submarine landslides’, ‘pipelines’ and ‘mechanisms’, and between ‘coseismic landslides’ and ‘bivariate statistical models’ within the theme of ‘earthquake’. Submarine landslides, which can evolve into high-speed sliding masses, pose a significant threat to ocean engineering safety and the stability of submarine pipelines (Nian et al. Citation2019). Regmi et al.(Citation2016) utilized a bivariate statistical model with distinct landslide causative elements to create a landslide susceptibility map of the 2015 Gorkha earthquake in Nepal based on coseismic landslides using remotely sensed data and fieldwork.
Figure 9. Strategic map of the 2016 to 2019 period. Note. (a) Strategic map(h-index) and performance from 2016 to 2019. Themes include (b) earthquake, (c) maps, (d) rainfall-induced-landslides, (e) neural-network-model, (f) decision-tree, (g) hazard, (h) models, (i) landslides, (j) area, (k) rainfall-thresholds.
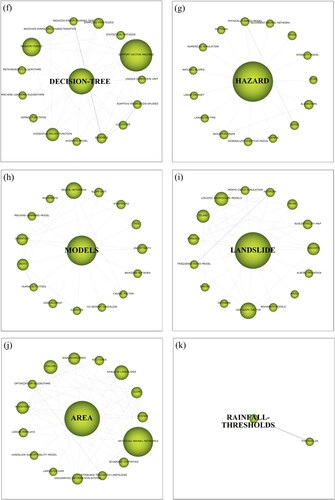
‘Neural-network-model’, ‘maps’, and ‘rainfall thresholds’ are the highly developed and isolated themes, with centralities of 21.38, 22.35, and 3.16, respectively, and density values of 11.81, 10.23, and 6.25, respectively (). From 2016 to 2019, ‘neural-network-model’ theme exhibits the highest density values among all themes, despite its relatively low centrality, indicating a great interest from a small group of researchers. The theme of ‘neural-network-model’ is found to be closely related to various subthemes, such as the ‘rough-set’ and ‘return-period’ (). The rough-set approach in modeling landslide susceptibility has the advantage of accounting for data ambiguity and uncertainty while reducing data collection requirements (Gorsevski and Jankowski Citation2008). On the other hand, return period estimation is critical for LSM, which assists local administrations and decision-makers in disaster planning by analyzing landslide susceptibility under the annual 48-h maximum rainfall of various return periods using machine learning techniques (Lin et al. Citation2017).
The theme of ‘maps’ shifted from the first quadrant in 1993-2010 to the second quadrant in 2016-2019, with decreased density and centrality values. However, in this period, ‘maps’ has been highly developed, and more complex techniques are being employed (). Reichenbach et al. (Citation2018) conducted a comprehensive evaluation of statistically-based landslide susceptibility modeling and mapping methodologies and indicated an overwhelming interest in statistical experimentation in their analysis.
No prominent emerging or declining themes are observed in the third quadrant during this period. Nevertheless, the ‘decision tree’ theme with intermediate density is situated at the intersection of the second and third quadrants, while ‘hazard’ with intermediate centrality is located at the intersection of the third and fourth quadrants. In previous periods, ‘hazard’ is positioned in the second quadrant in the first period and the first quadrant in the second period. Multiple connections between ‘hazard’ and subthemes are observed in the current period, as seen in the previous ones.
On the other hand, the theme ‘decision tree’ appears for the first time in the strategic map with the highest citation frequency of 7794 and the highest h-index of 51, indicating its significant influence on later research. Based on the cluster network map depicted in , intricate connections can be seen between the ‘decision tree’ theme and other subthemes. the important nodes that appear on the connection are the themes ‘support-vector-machine (SVM)’, ‘random-forest (RF)’, and ‘evidential-belief-function (EBF)’. A review of related literature reveals that the SVM method has gained widespread usage in recent years due to its simple and effective advantages, notwithstanding some weaknesses attributable to its unique theoretical basis. Combining SVM with other techniques can improve landslide susceptibility assessment and mapping (Huang and Zhao Citation2018). The use of RF and EBF also garnered significant attention in LSM. Dou et al. (Citation2019) employed decision-tree and random-forest approaches to predict huge rainfall-triggered landslides on the Izu-Oshima Volcanic Island, Japan, generating precise and stable LSM quickly. Furthermore, Pourghasemi and Kerle (Citation2016) investigated the RF technique with an EBF approach for LSM in the west of Mazandaran Province, northern Iran, which has varying topography and data circumstances. The coupling of the RF and EBF techniques provides an objective and adaptable method to improve predicted accuracy and control overfitting for regional landslide susceptibility mapping.
The basic and transversal themes are ‘area’, ‘models’, and ‘landslide’, with the centrality value of 37.01, 40.69, and 33.37, respectively, and with the density value of 1.75, 1.45, 1.69, respectively (refer to ). Note that the theme of ‘landslide’ consistently falls in the fourth quadrant from 1993 to 2010, emphasizing its importance as a foundational concept in the landslide susceptibility field. Furthermore, the theme ‘area’ and ‘model’ exhibit a remarkable degree of stability, consistently falling in the fourth quadrant from 2011 to 2015 and 2016 to 2019, respectively. As shown in , the ‘area’ theme is interconnected with multiple subthemes, with complex interactions between them. It is noteworthy that, although abundant articles about ‘artificial neural networks’ were published in this period, no significant linkage was observed between ANN and ‘area’. Nevertheless, ANN, being a powerful model, continues to play a critical role in LSM. For example, Aditian et al. (Citation2018) showed that ANN outperforms bivariate frequency ratio (FR) and multivariate logistic regression (LR) in estimating landslide vulnerability. In addition, the most important subtheme associated with the ‘model’ theme is ‘neural networks’ (). Between 2016 and 2019, convolutional neural networks (CNN) began being applied to landslide susceptibility research for the first time, except for the classical neural networks models that are widely used such as ANN and MLP neural networks (Wang et al. Citation2019).
5.1.4. Analysis of hot themes between 2020 and 2022
The motor themes are ‘rainfall-induced landslides’, ‘earthquake’, ‘logistic regression models’, and ‘river’. ‘Rainfall-induced-landslides’ and ‘earthquake’ remain popular themes in LSM studies, with centrality values of 28.43 and 34.24 and with density values of 7.72 and 3.54, respectively (). This indicates that these two themes are well-established and central to the field of landslide susceptibility research, with broad appeal. reveals a close association between ‘clay’ and ‘logistic regression model’ among the subthemes linked to ‘rainfall-induced landslides’. The high clay concentrations of the lithological units along the road line may generate continued landslides and debris flow, with heavy rain showers increasing the risk of natural hazards (Hepdeniz Citation2020). For rainfall-induced landslides, the logistic regression (LR) approach is frequently utilized to create a landslide susceptibility model based on annual or monthly rainfall (Xing et al. Citation2021). The ‘earthquake’ theme has connections with multiple subthemes, with ‘landslide-susceptibility-zone’ and ‘urban area’ being strongly connected ().
Figure 10. Strategic map of the 2020 to 2022 period. Note. (a) Strategic map(h-index) and performance from 2020 to 2022. Themes include (b) rainfall-induced-landslides, (c) logistic-regression-models, (d) convolutional-neural-network, (e) river, (f) earthquake, (g) hazard, (h) decision-tree, (i) area, (j) earthquake-induced-landslides, (k) monte-carlo-simulation, flow.
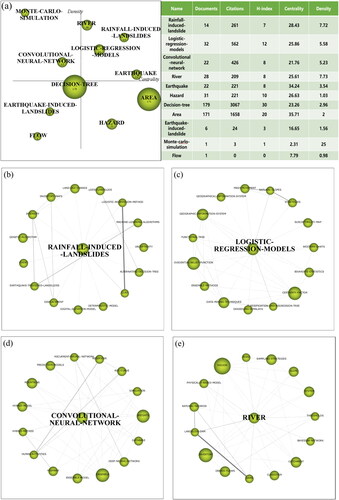
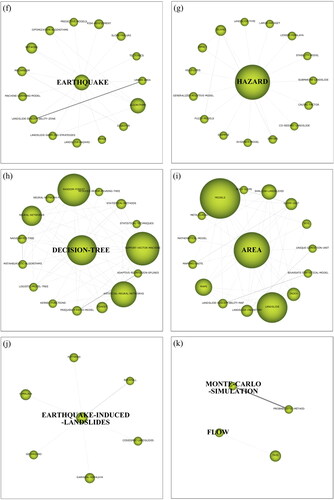
The ‘river’ theme has increased centrality and density values, moving from the second quadrant in 2011-2015 to the first quadrant in 2020-2022, indicating increased attention and application in LSM (). In 2011-2015, the ‘river’ theme is only connected to the subtheme ‘soil’, but in 2020-2022, it has more complex associations with numerous subthemes (). The ‘Logistic-regression-models’ theme appears in the first quadrant for the first time, with a centrality value of 25.86 and the density value of 5.58. The subthemes ‘certainty-factor’, ‘evidential-belief-function’, and ‘data-mining-techniques’ are highly relevant to the ‘logistic-regression-models’ theme (). Data-mining-techniques integrate multiple models into a comprehensive model for landslide susceptibility research. For example, Zhao et al. (Citation2019) employed functional tree-based bagging, and rotation forest ensemble data mining for landslide susceptibility modeling in Zichang County, China.
The themes of ‘Monte-Carlo-simulation’ and ‘convolutional-neural-network’ are highly developed and isolated, with centralities of 0.09 and 0.36, respectively, and density values of 1 and 0.64, respectively (). These themes are receiving some attention, and have a non-negligible impact in LSM. As depicted in , ‘Monte-Carlo-simulation’ is closely related to the ‘probabilistic method’. Monte Carlo simulation accounts for the diversity of input parameters and uncertainties related to landslide susceptibility assessment (Gorsevski et al. Citation2006). Lee et al. (Citation2020) proposed a probabilistic technique for analyzing landslide susceptibility based on a physical slope model, which utilized Monte Carlo simulation based on landslide inventory. The landslide prediction rate using the Monte Carlo simulation was greater than the deterministic analysis. The theme ‘convolutional neural network’ has intricate connections with many subthemes (). Among these subthemes, ‘human activities’ and ‘reservoirs’ are closely intertwined. Human activities are critical factors that trigger frequent landslides, and the fluctuation of reservoir water levels affects the development of landslide susceptibility. Li et al. (Citation2020) integrated multiresolution segmentation and convolutional neural network algorithms to produce high-precision landslide susceptibility maps in the Three Gorges reservoir area, where human activities have caused frequent slope instability.
The emerging or declining themes include ‘decision tree’, ‘earthquake-induced landslides’, and ‘flow’. While the centrality and density value of ‘decision tree’ decreased in comparison to the period of 2016-2019, its influence cannot be disregarded, considering its highest citation frequency (3067). As shown in , ‘decision tree’ is closely linked to ‘support-vector-machine’, ‘random forest’, and ‘artificial neural networks’, which are classic and popular machine learning methods currently utilized in LSM.
The ‘earthquake-induced landslides’ theme is related to six subthemes: ‘Himalaya’, ‘geohazard’, ‘Garhwal-Himalaya’, ‘coseismic landslides’, ‘rockfall’, and ‘patterns’ (). It is highly correlated with the theme ‘earthquake’ that appears in the first quadrant. The research on earthquake-induced landslides emerged during this period with two hot themes, indicating that it is widely researched in LSM. In contrast, ‘flow’ is a small node with low centrality (7.79) and density value (0.98) (). It is not a research center and is not vital to current development prospects. The ‘flow’ theme has only a weak connection to the ‘tree’ subtheme.
‘Hazard’ and ‘area’ are the basic and transversal themes with centrality values of 26.63, and 35.71 and density values of 1.03, and 2, respectively (). ‘Hazard’ appears in all four research periods and has evolved from an isolated theme to a core aspect of the field, moving from the second quadrant to the first and then to the fourth quadrant, indicating its increased stability and importance. The ‘hazard’ theme is intricately linked to multiple external subthemes, as seen in previous periods ().
Similarly, the ‘area’ theme has retained its position in the fourth quadrant from 2011 to 2022, suggesting it will continue to be a prominent topic in landslide susceptibility. It is connected with various subthemes, such as ‘models’, ‘landslides’, ‘maps’, and ‘shallow-landslides’ (). The subtheme ‘models’ is the most important subtheme connected to the ‘area’ having a significant influence in LSM from 1993 to 2019. However, it doesn’t appear in the strategic map for this research period because of the strong evolution.
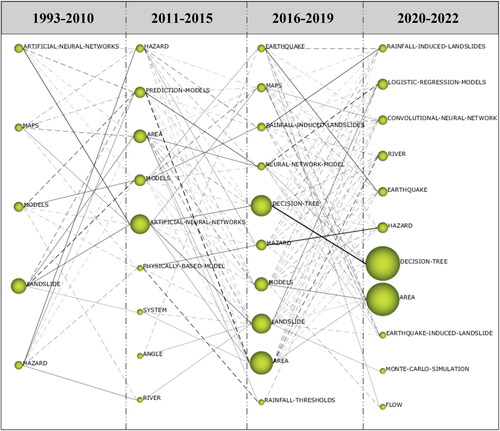
5.2. Analysis of the overall thematic evolution path for LSM
depicts the theme evolution map of LSM across four research periods. This map provides a visual representation of the emergence and disappearance of various themes within each period. Notably, the ‘hazard’ theme is persistent throughout all four periods, whereas ‘artificial-neural-networks’ has vanished and ‘convolutional-neural-network’ is a newcomer, appearing only in the most recent period. The evolution map suggests that themes tend to expand from left to right and their interconnections become more intricate over time, implying growing interest in LSM and the continual emergence of novel research topics.
Figure 11. Thematic evolution of the landslide susceptibility research field (1993-2022).
5.2.1. The perspective of landslide susceptibility modeling methods
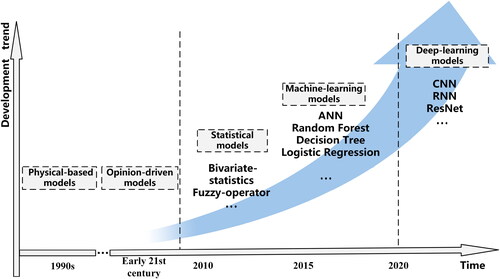
From 1993 to 2022, the themes related to landslide susceptibility modeling have consistently been popular, underscoring the critical importance of landslide modeling methods for evaluating susceptibility. Over time, these methods have become increasingly diverse, and they can be grouped into four categories: physical-based models, opinion-driven models, statistical models, and machine-learning models (Merghadi et al. Citation2020). Opinion-driven models are highly subjective, relying heavily on the investigator’s ability to understand the real causes and stability factors of landslides in a particular area (Castellanos Abella and Van Westen Citation2008; Ruff and Czurda Citation2008; Dou et al. Citation2023), while physical-based models require detailed data, making them unsuitable for large-area landslide susceptibility mapping. In contrast, statistical models have rapidly developed over the past decade, and numerous methods and techniques have been proposed and successfully implemented.
The theme of ‘prediction models’, including statistical models such as bivariate statistics and fuzzy operators, has been situated in the first quadrant in the strategic map for the 2011-2015 period (), and it has continued to grow. In recent years, machine learning and deep learning methods have been successfully applied in geoscience, and many statistical models are being developed again using these methods to produce accurate risk zonation maps (Merghadi et al. Citation2020). Artificial-neural-networks were one of the first machine learning methods for LSM, Lee et al. (Citation2001) were the first to apply artificial neural networks to LSM. Since then, the algorithm based on ANN has been refined through network adjustments and has become a popular and well-established method. Some case studies have reported achieving an accuracy of approximately 90% (as measured by the AUC value) using the ANN model (Gautam et al. Citation2021). Decision tree is one of the most commonly used machine learning methods, Nefeslioglu et al. (Citation2010) were pioneers in using the decision tree method for landslide susceptibility modeling. Over time, this method has gained popularity and has become one of the most widely used traditional machine learning methods in LSM. It has been reported to achieve a prediction rate of over 90% (Shirzadi et al. Citation2018). As shown in , both ANN and decision tree are important nodes in the evolutionary map. The theme of ‘logistic regression models’ emerged in the fourth period and has been further developed in the field of machine learning. This model’s advantages are fast training speed, simple structure, strong universality, and, most importantly, its prediction effect mainly depends on feature engineering. Based on the literature, the logistic regression model accounts for a large proportion of usage and is often used as the baseline model to prove the superiority of the proposed model in many studies.
In addition, geological hazard data’s quality and quantity have greatly improved in recent years, enabling successful applications of deep learning methods, particularly convolutional neural networks (CNNs) with strong representation learning abilities in LSM research. Wang et al. (Citation2019) were the first to apply CNN to LSM, and Yi et al. (Citation2020) proved that the landslide susceptibility modeling method based on CNN has good goodness of fit and strong prediction ability, the AU-SRC value based on CNN method is up to 97.45%. Furthermore, CNN can be combined with traditional machine learning methods. For example, Fang et al. (Citation2020) combined CNN technology with three traditional machine learning classifiers: Support Vector Machine (SVM), Random Forest (RF), and Logical Regression (LR). The results showed that combining CNN technology can effectively improve these machine learning classifiers’ performance. illustrates the development trend in LSM. Moreover, in recent research, there appears to be a growing trend toward improving the structure of neural networks to adapt to landslide susceptibility assessment tasks. For instance, Huang et al. (Citation2022) constructed a deep random neural network (DRNN) that incorporates random dropout of network layers and nodes during the landslide modeling process. Performance evaluation results demonstrated its favorable generalization performance (Kappa = 0.829). Wang et al. (Citation2023) proposed a CNN network model called the combination of deep autoencoder and multiscale residual network (DAE-MRCNN). Experimental results indicated that this model effectively captures the complex nonlinear relationships among evaluation factors, mitigates the issue of insufficient samples in convolutional neural network (CNN) training, and significantly improves the accuracy of susceptibility prediction. Deep learning-based susceptibility assessment models consistently achieve performance optimization through the reconstruction of networks, which explains their attraction to the majority of researchers, although this level of performance is still achieved at the expense of interpretation capacity.
Figure 12. Trends in landslide susceptibility modeling methods.
5.2.2. The perspectives of geo-environmental information and landslide triggering factors
In addition to landslide susceptibility modeling methods, geological information and factors triggering landslides can be extracted from evolution maps. Geo-environmental information is an essential factor in modeling landslide susceptibility, and researchers have increasingly used such variables since the end of the last century. According to the existing literature, researchers tend to rely on basic topographic variables, including elevation, slope, aspect, and curvature, in their landslide susceptibility models. This preference can be attributed to the ease and accuracy of obtaining these variables through existing GIS software utilizing Digital Elevation Models (DEM). Nonetheless, it should be noted that these morphometric variables may not be the most effective predictors of landslide susceptibility. In the present study, the distance to rivers is frequently employed as a variable for landslide susceptibility modeling (Reichenbach et al. Citation2018). This variable reflects the associated hydrogeological conditions that are less favorable for slope stability due to concentrated groundwater flow at the bottom of a slope. Existing GIS toolkits, such as ArcGIS, GRASS, and SAGA, can be programmed to calculate complex morphological and hydrological variables for landslide susceptibility modeling (Reichenbach et al. Citation2018). However, the correlation between hydrological variables or more complex variables and landslide susceptibility modeling only applies to a specific location or area, mainly for hydrologically-controlled landslides (Reichenbach et al. Citation2018). Moreover, various geo-environmental information parameters can be considered as random variables in landslide susceptibility analysis (Park et al. Citation2013). Monte Carlo simulation properly accounts for the variability of input parameters and considers the uncertainty associated with landslide susceptibility (Gorsevski et al. Citation2006). Lee et al. (Citation2020) conducted a Monte Carlo simulation using landslide inventory data and compared it with deterministic analysis for landslide susceptibility modeling. The results showed a significantly higher predictive rate of landslide using Monte Carlo simulation compared to deterministic analysis.
Selecting an appropriate area to map a landslide inventory is a crucial step in landslide susceptibility modeling. The selected area must have a triggering event, such as rainfall, earthquake, or snowmelt, to effectively assess the predictive ability of the susceptibility model. Previous studies have identified rainfall and earthquakes as the two primary factors that trigger large-scale landslides (Dahal et al. Citation2008; Rapolla et al. Citation2010; Lv et al. Citation2022). Rainstorms and prolonged rainfall cause surface water to infiltrate into the slope, while earthquakes can disrupt the balance of the slope and trigger landslides. Furthermore, studies have demonstrated that the most significant geo-environmental variables differ depending on the triggering factor of landslides (Budimir et al. Citation2015). Therefore, it is essential to examine the specific factors that trigger landslides and create inventories of landslide events to study landslide susceptibility.
6 Discussion and future directions
This study offers two significant contributions to the field of landslide susceptibility. Firstly, it conducts a critical analysis of the research development process in LSM by examining published journal articles from 1993 to 2022, with a focus on the hot themes for each period. Secondly, the study provides recommendations for future research. Unlike prior studies, this research adopts a quantitative approach to identify past research themes and assess their contributions. Specifically, SciMAT is employed to quantify and visualize the knowledge development structure and evolution in LSM. This approach provides researchers and professionals with a comprehensive understanding of the current state of LSM research and predicts its future trajectory.
6.1. LSM research development characteristics
The literature on landslide susceptibility has gone through three distinct stages: slow growth (period 1 and period 2), steady growth (period 3), and vigorous growth (period 4). Notably, the number of documents published in period 4 reached an all-time high of 596, with 248 published in 2021 alone. While the literature used in this study was officially published before August 2022, it is anticipated that the number of publications will continue to rise. From the perspective of emerging and declining keywords in LSM research, the number of keywords in the early research stage was limited, and their popularity was low, whereas the number of keywords in the later period was more diverse and increasing.
There is a discernible geographic clustering of academic activities in LSM research, with author and country collaborations predominantly located in Asia, Europe, and North America. Although more researchers are now involved in LSM research, there are few highly productive authors. In terms of thematic evolution, the popular themes are landslide, hazard, models, area, and maps, which have appeared more than once during the four research periods and gradually became the basic and transversal themes. Most of the hot themes emerged in period 2. However, while research on LSM has improved and matured from 2016 to 2022, the frequency of new research hotspots is currently low, and the research perspective is not innovative enough to grasp future trends.
Regarding evolutionary research trends, landslide modeling methods, geological information, and landslide triggering factors are the primary topics of interest to researchers. Landslide modeling methods are the key knowledge path, and related themes appear most frequently in the evolutionary map and are significant nodes. The adoption of machine learning and deep learning techniques to achieve precise risk assessment has gained traction and emerged as a prominent area of interest in LSM research. In particular, convolutional neural networks (CNNs) have garnered significant attention and represent a promising avenue for future research.
6.2. LSM research dynamic direction prediction
6.2.1. Focusing on modeling techniques and delving into the capabilities of deep learning
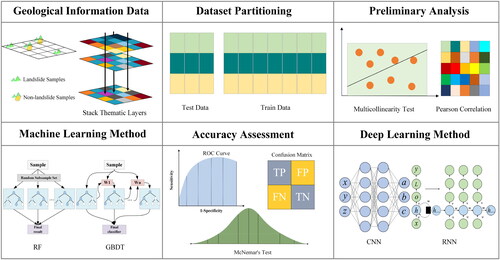
Modeling methods dominate the hot topics in landslide susceptibility, followed by topics related to geological information variables (data) and landslide triggers. Modeling has been the hottest topic in LSM research. Among the various modeling methods, the artificial neural network modeling method was the first method used in landslide susceptibility research. Although it is no longer a hot theme since the latter two periods, it can be seen from the theme network structure diagram that the ‘artificial neural network’ subtheme is still an important node of the hot themes ( and ), and as a benchmark for comparison due to its strong performance. Other prevalent machine learning (ML) methods include decision tree, random forest, and support vector machine. The ‘decision tree’ theme has been of importance since its appearance in the third period and remains the most popular topic in the latter two periods. Although ‘random forest’ and ‘support vector machine’ do not appear as hot themes in the evolution graph, they are the two most important sub-nodes of ‘decision tree’ theme ( and ), indicating that they are frequently employed and compared in research. Deep learning (DL)-based modeling approaches first emerged in recent years, and convolutional neural networks (CNNs) have proven their efficacy in landslide susceptibility studies. Although the CNNs topic occupies a relatively isolated niche in the field, there have been a limited number of studies exploring their application to landslide susceptibility. However, with the advancement of artificial intelligence technology in computer science, various advanced neural networks have been extended based on CNNs have been developed, offering enormous potential for future research in this area. Compared to statistical methods and machine learning (ML) approaches, deep learning (DL) has shown improved performance due to its utilization of nonlinearity, complex interconnections between layers, and internal data representations. shows the methodological workflow of LSM. However, with DL, it is nearly impossible to determine the exact relationship between individual inputs and outputs. This is a weakness of deep learning and a fundamental drawback for high-stakes applications such as landslide mitigation, making it difficult for experts to comprehend and trust its results.
Figure 13. Methodological workflow of LSM.
6.2.2. More acquisition means obtaining high-quality data
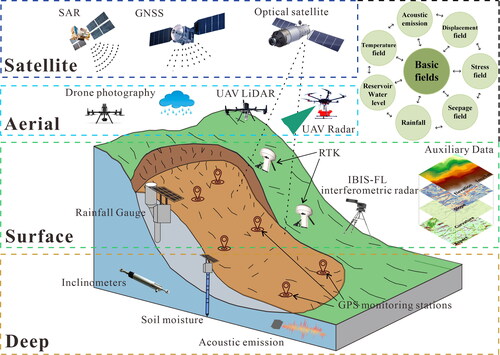
The two most important types of landslides for susceptibility studies are rainfall-induced and earthquake-induced landslides, which have become hot themes since the third period and are in the motor theme area. Researchers need to focus on these two types of landslides because different landslide triggers affect the importance of different geological information variables. Machine learning algorithms and other data-driven predictive models for landslide susceptibility studies rely heavily on observational data for assessing landslide hazard risks. Therefore, the accuracy and validity of geological information variables have received increased attention from researchers in the last two years. Although geological information variables were not among the more popular themes identified, the importance of data was emphasized in the fourth period’s themes of Monte Carlo simulation. Since data quality can significantly impact the results of landslide susceptibility evaluation, it is crucial to ensure error-free data in future studies and use feature selection methods to assess the evaluative power of input factors and eliminate irrelevant or partially relevant factors before constructing susceptibility models. Furthermore, by combining SAR, multispectral remote sensing, UAV digital image, and digital elevation model, it is possible to accurately extract various geological information, such as topography and geomorphology, surface cover, geology, and hydrological conditions. These extracted data, when combined with precipitation or other triggering factors, can establish regional landslide susceptibility evaluation indexes. The ‘Satellite-Aerial-Surface-Deep’ multi-source data characterized by large scope, objectivity, and high timeliness will have great potential for application in landslide susceptibility mapping (see ).
Figure 14. ‘Satellite-Aerial-Surface-Deep’ multi-source data for landslide susceptibility.
6.2.3. Improved strategy to simplify models and avoid high specificity
Machine learning and hybrid models are currently popular research topics in accordance with the thematic network structure diagram. However, it is important to note that relying solely on an ‘optimal’ model for landslide sensitivity analysis may only be effective for a specific location or region. Overfitting may also compromise the accuracy of the results, and the training time for the model increases with its complexity. Therefore, it is crucial to strike a balance between model performance and complexity, and simplify the model as much as possible while maintaining excellent performance to avoid high specificity and lengthy training times. What’s more, many researchers even study the same sites repeatedly. Due to the lack of a large number of samples, single-area studies are not very helpful for developing landslide susceptibility science. To address this issue, we propose the following strategies: (1) standardizing landslide information and various thematic variables, which can exploit the results of susceptibility models constructed in an area to neighboring and distant areas; (2) instead of over-optimizing a single model, using multiple classical methods for coupling to improve the models. These classical methods have been proven to perform well, and the coupled methods still maintain good generalizability; (3) utilizing artificial intelligence to learn about landslide events in real-time and then selecting appropriate factors and models based on the characteristics of the study area to achieve an intelligent evaluation of landslide susceptibility in different areas.
6.2.4. Appropriate landslide cataloging methods for local conditions
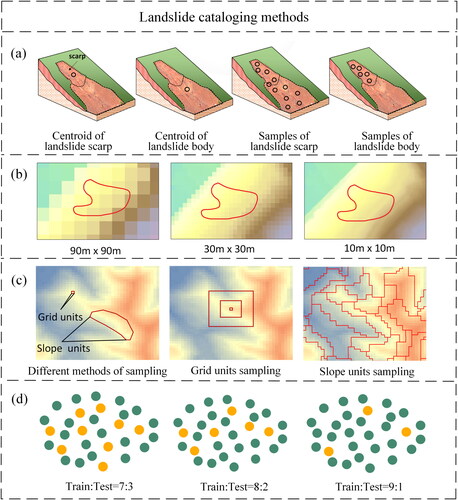
The application of data-driven models has gradually improved the accuracy and precision of landslide susceptibility assessment. However, in LSM, the landslide cataloging method introduces various sources of uncertainty. Addressing these uncertainties requires a clear definition of criteria for selecting positive and negative samples, followed by the consideration of specific sampling strategies. This encompasses the selection of landslide sampling point locations, spatial resolution of causative factors, selection of different sampling units, and the ratio of training to testing samples (Gupta and Shukla Citation2023; Ji et al. Citation2023; Zhuo et al. Citation2023) (). Positive samples are derived from historical landslide records, reflecting conducive geographic conditions for landslides. However, consensus is lacking in the selection of negative samples, with three main methods: 1) random selection outside historical landslide boundaries (Pourghasemi and Rahmati Citation2018; Shirzadi et al. Citation2019); 2) random selection outside landslide buffer zones (Xing et al. Citation2014; Qiu et al. Citation2017); 3) choosing low-slope non-landslide areas in regions with gentler gradients (Choi et al. Citation2010; Kavzoglu et al. Citation2014). These methods might inadvertently include potential landslide samples. A novel approach involves using an initial model to select non-landslide areas from very low and low susceptibility zones indicated by the initial model results, offering a more effective negative sample strategy (Su et al. Citation2022; Zhou et al. Citation2022; Ji et al. Citation2023). Additionally, adjustments to the proportion between positive and negative samples are necessary to prevent bias in susceptibility predictions (Fu et al. Citation2023). Future research is necessary to establish uniform negative sample selection criteria adaptable to various geographic contexts. Regarding different sampling strategies, different spatial resolutions directly affect the number of grid cells in different sub-intervals of environmental factors, which in turn influence the weights of these factors in the model and the number of landslide and non-landslide samples required for model construction. Currently, there is no unified standard for determining the optimal spatial resolution for LSM. Furthermore, it is generally believed that a larger number of training samples leads to a more comprehensive representation of landslide and environmental factor features in the constructed model, resulting in stronger generalization ability for testing data (Conforti et al. Citation2023). However, the information on landslide attributes and the number of sampling units at different spatial resolutions are closely related to the overfitting state of different models. Therefore, the optimal ratio of training to testing datasets should be determined based on specific conditions. The determination of sampling units, including grid cells, slope units, unique conditions, administrative divisions, and watershed units, forms an important modeling basis for landslide assessment. Among these mapping units, grid cells and slope units have received extensive attention (Huang et al. Citation2021). Grid cells can be stored in various matrix forms for computational convenience, particularly the grid samples generated based on a multi-scale sampling strategy (), which can be input into a CNN model for automatic extraction of multi-scale spatial information and high-level semantic features around landslides. In contrast to grid cells, slope units can a priori reflect the physical relationship between landslides and basic terrain features (Chang et al. Citation2023). Under similar model performance, landslide susceptibility assessment based on slope units tends to achieve better results. Currently, commonly used multi-scale segmentation methods accurately extract slope units (), but they primarily rely on terrain features and involve subjective parameter settings. Therefore, future research on slope unit extraction methods should pay more attention to integrating environmental factors. Additionally, exploring effective ways to incorporate slope units into CNN models for computation is a valuable direction worth exploring.
Figure 15. The landslide cataloging method: (a) landslide sampling point locations (Modified from Dou et al. Citation2020, reused with the permission); (b) spatial resolution of causative factors; (c) selection of different sampling units; (d) the ratio of training to testing samples.
6.2.5. Explainable AI-based modeling methods
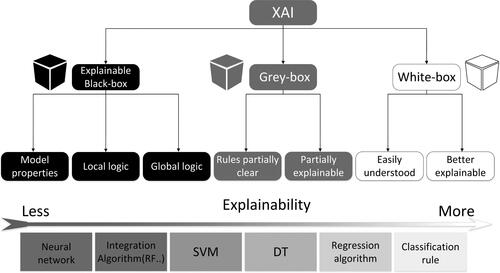
It is noteworthy that the landslide susceptibility modeling approaches based on machine learning algorithms do not incorporate physical mechanisms and ignore intrinsic evolutionary mechanisms of landslides. Despite notable achievements in landslide susceptibility mapping facilitated by data-driven approaches, a significant limitation arises from the predominantly black-box nature of these algorithms. This characteristic impedes the interpretability of the constructed AI models and hampers the integration of physical mechanisms. While white-box models, such as rule-based models, logistic regression, and decision trees, explicitly provide insights into prediction mechanisms through their weights or decision nodes, black-box models like random forests and neural networks lack such transparency. Their internal systems remain concealed, obstructing comprehension of the underlying decision mechanism (Kavzoglu and Teke Citation2023). Consequently, machine learning models suffer from high specificity and poor generalizability, limiting their utility. It is foreseeable that Explainable Artificial Intelligence (XAI) represents a crucial research direction for the future. XAI refers to the efforts of researchers to provide comprehensible explanations for the behavior of black-box models, increasing their transparency and converting them to gray boxes (). XAI aims to help people understand the complex logic and internal working mechanism of machine learning algorithms from ante-hoc and post-hoc perspectives (Fang et al. Citation2023). Facilitating comprehension of the model’s outcomes and alleviating the negative associations associated with the black-box terminology can be achieved by introducing the concept of a gray-box approach, which ultimately aims to progress toward incorporating white-box features within the realm of machine learning. In recent years, several researchers have explored the domain of XAI in the context of landslide susceptibility (Al-Najjar et al. Citation2022; Zhou et al. Citation2022; Dahal and Lombardo Citation2023; Youssef et al. Citation2023; Zhang et al. Citation2023). They have accomplished this by integrating machine learning models with post-interpretation algorithms such as SHAP (Shapley Additive Explanations), LIME (Local Interpretable Model-Agnostic Explanations), and PDP (Partial Dependence Plots) to interpret the results of landslide susceptibility mapping. However, the current state of research on XAI in this field is still nascent, and further investigations are required to transition from interpreting existing black box models to developing inherently interpretable methods. Additionally, addressing the trade-off between accuracy and interpretability remains an ongoing challenge that warrants continuous exploration.
Figure 16. The Explainable AI Taxonomy.
6.2.6. Scenario-based risk decision making through knowledge sharing
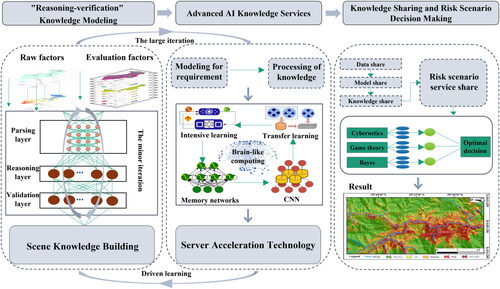
With the advent of big data, artificial intelligence (AI) techniques are developing rapidly and have unlimited possibilities. However, the application of AI methods in LSM has been limited to traditional machine learning methods and deep learning network classification methods. Despite the vast potential of deep learning, its accuracy has not yet been able to consistently surpass that of traditional machine learning methods, and the performance of deep learning models for landslide susceptibility evaluation varies widely in different regions and under different data quality conditions. Therefore, AI algorithms and systems for LSM still require innovation. In this study, we project the future of LSM technology and propose three stages of AI-based LSM methods, namely ‘Reasoning-verification’ knowledge modeling, ‘Advanced AI knowledge services’, and ‘Knowledge sharing and scenario decision making’ (as illustrated in ). Currently, the deep learning method applied to landslide susceptibility is still in the ‘Reasoning-verification’ knowledge modeling stage. In the ‘Advanced AI knowledge services’ stage, a substantial amount of high-quality data is required for in-depth learning, and the iteration process of landslide susceptibility data training is achieved through transfer learning, intensive learning, and memory network technologies. Specifically, the landslide susceptibility model is trained unsupervised using a very large database, using a multi-headed attention mechanism to improve model performance, and using adversarial training techniques to improve model robustness. The pre-generated ‘big model’ can be fine-tuned in the ‘inference validation’ knowledge modeling stage to achieve fast and accurate susceptibility modeling in an interactive ‘promote’ manner. The ‘Knowledge sharing and scenario decision making’ stage involves the establishment of a knowledge-depth sharing system, risk scenario decision-making, and adaptive zoning mapping and assessment of landslide susceptibility using various decision theories such as Cybernetics, Game theory, and Bayes.
Figure 17. AI-based LSM methods in the future.
6.3. Study implications
Although this paper is a valuable contribution, its analysis has certain limitations. Firstly, only publications indexed in the WOS repository were considered. For future studies, it is recommended to compare these results with those obtained from other databases, such as Scopus or Google Scholar. Secondly, the different grouping algorithms and similarity metric tools provided by the SciMAT software were chosen by the researcher, and the resulting mappings depend on the parameters set. Thus, we selected the best possible parameters for scientific mapping analysis based on our expertise. The next step in this study could be to conduct a more in-depth content analysis of the articles in each thematic cluster using text analysis software, such as NVivo, to provide a more detailed discussion of each identified theme.
7. Conclusion
This study employed VOSviewer and SciMAT, two information visualization software, to analyze 1661 papers retrieved from the Web of Science between 1993 and 2022. The primary aim was to identify highly cited papers and the main journals that publish in the field of landslide susceptibility. Collaboration networks of authors and countries were also mapped, and strategic diagrams and cluster network maps were utilized to determine the evolution capability and status of each research theme. By mapping the evolution map of landslide susceptibility research, the study identified the relationships and development of various themes. Results indicated that landslide susceptibility research has exhibited a steady upward trend over the past three decades. Key research issues of interest to scholars in this field include landslide modeling methods, geological information, and landslide-triggering factors. The evolution of landslide modeling methods is the primary knowledge path, with related topics appearing as important nodes in the evolutionary map. Additionally, research on accurate risk zonation using machine learning or deep learning methods is on the rise and is becoming a popular trend in landslide susceptibility research. Particularly, Convolutional Neural Network (CNN)-based approaches for landslide susceptibility modeling have emerged as a dominant theme, showcasing exceptional fitting capabilities and robust predictive performance.
Disclosure statement
The authors declare that they have no known competing financial interests or personal relationships that could have appeared to influence the work reported in this paper.
Data availability statement
Data are available if you contact authors with reasonable requests.
Additional information
Funding
References
- Aditian A, Kubota T, Shinohara Y. 2018. Comparison of GIS-based landslide susceptibility models using frequency ratio, logistic regression, and artificial neural network in a tertiary region of Ambon, Indonesia. Geomorphology. 318:101–111. doi: 10.1016/j.geomorph.2018.06.006.
- Ado M, Amitab K, Maji AK, Jasińska E, Gono R, Leonowicz Z, Jasiński M. 2022. Landslide susceptibility mapping using machine learning: a literature survey. Remote Sens. 14(13):3029. doi: 10.3390/rs14133029.
- Aleotti P, Chowdhury R. 1999. Landslide hazard assessment: summary review and new perspectives. Bull Eng Geol Env. 58(1):21–44. doi: 10.1007/s100640050066.
- Alvioli M, Baum RL. 2016. Parallelization of the TRIGRS model for rainfall-induced landslides using the message passing interface. Environ Modell Softw. 81:122–135. doi: 10.1016/j.envsoft.2016.04.002.
- Al-Najjar HAH, Pradhan B, Beydoun G, Sarkar R, Park HJ, Alamri A. 2022. A novel method using explainable artificial intelligence (XAI)-based shapley additive explanations for spatial landslide prediction using time-series SAR dataset. Gondwana Res. 2020(Xxxx). doi: 10.1016/j.gr.2022.08.004.
- Anagnostopoulos GG, Burlando P. 2012. An Object-oriented computational framework for the simulation of variably saturated flow in soils, using a reduced complexity model. Environ Modell Softw. 38:191–202. doi: 10.1016/j.envsoft.2012.06.002.
- Anagnostopoulos GG, Fatichi S, Burlando P. 2015. An advanced process-based distributed model for the investigation of rainfall-induced landslides: the effect of process representation and boundary conditions. Water Resour Res. 51(9):7501–7523. doi: 10.1002/2015WR016909.
- van Asch TWJ, Malet J-P, van Beek LPH, Amitrano D. 2007. Techniques, issues and advances in numerical modelling of landslide hazard. Bull Soc Géol Fr. 178(2):65–88. doi: 10.2113/gssgfbull.178.2.65.
- Budimir MEA, Atkinson PM, Lewis HG. 2015. A systematic review of landslide probability mapping using logistic regression. Landslides. 12(3):419–436. doi: 10.1007/s10346-014-0550-5.
- Bui DT, Pradhan B, Lofman O, Revhaug I, Dick OB. 2012. Landslide susceptibility assessment in the Hoa Binh province of Vietnam: a comparison of the Levenberg–Marquardt and Bayesian regularized neural networks. Geomorphology. 171–172:12–29. doi: 10.1016/j.geomorph.2012.04.023.
- Castellanos Abella EA, Van Westen CJ. 2008. Qualitative landslide susceptibility assessment by multicriteria analysis: a case study from San Antonio del Sur, Guantánamo, Cuba. Geomorphology. 94(3-4):453–466. doi: 10.1016/j.geomorph.2006.10.038.
- Chang Z, Catani F, Huang F, Liu G, Meena SR, Huang J, Zhou C. 2023. Landslide susceptibility prediction using slope unit-based machine learning models considering the heterogeneity of conditioning factors. J Rock Mech Geotech Eng. 15(5):1127–1143. doi: 10.1016/j.jrmge.2022.07.009.
- Chen W, Xie X, Wang J, Pradhan B, Hong H, Bui DT, Duan Z, Ma J. 2017. A comparative study of logistic model tree, random forest, and classification and regression tree models for spatial prediction of landslide susceptibility. CATENA. 151:147–160. doi: 10.1016/j.catena.2016.11.032.
- Chen Y, Cheng L, Lian R, Song Z, Tian J. 2021. COVID-19 vaccine research focusses on safety, efficacy, immunoinformatics, and vaccine production and delivery: a bibliometric analysis based on VOSviewer. Biosci Trends. 15(2):64–73. doi: 10.5582/bst.2021.01061.
- Choi J, Oh H-J, Won J-S, Lee S. 2010. Validation of an artificial neural network model for landslide susceptibility mapping. Environ Earth Sci. 60(3):473–483. doi: 10.1007/s12665-009-0188-0.
- Cobo MJ, López-Herrera AG, Herrera-Viedma E, Herrera F. 2011. An approach for detecting, quantifying, and visualizing the evolution of a research field: a practical application to the Fuzzy Sets Theory field. J Informetr. 5(1):146–166. doi: 10.1016/j.joi.2010.10.002.
- Cobo MJ, López-Herrera AG, Herrera-Viedma E, Herrera F. 2012. SciMAT: a new science mapping analysis software tool. J Am Soc Inf Sci Tec. 63(8):1609–1630. doi: 10.1002/asi.22688.
- Conforti M, Borrelli L, Cofone G, Gullà G. 2023. Exploring performance and robustness of shallow landslide susceptibility modeling at regional scale using different training and testing sets. Environ Earth Sci. 82(7):161. doi: 10.1007/s12665-023-10844-z.
- Dahal A, Lombardo L. 2023. Explainable artificial intelligence in geoscience: a glimpse into the future of landslide susceptibility modeling. Comput Geosci. 176(January):105364. doi: 10.1016/j.cageo.2023.105364.
- Dahal RK, Hasegawa S, Nonomura A, Yamanaka M, Masuda T, Nishino K. 2008. GIS-based weights-of-evidence modelling of rainfall-induced landslides in small catchments for landslide susceptibility mapping. Environ Geol. 54(2):311–324. doi: 10.1007/s00254-007-0818-3.
- Dou J, Xiang ZL, Xu Q, Zheng PL, Wang XK, Su AJ, Liu JQ, Luo WQ. 2023. Application and development trends of machine learning in intelligent disaster prevention and reduction for landslides. Eart Sci. 48(5):1657–1674. doi: 10.3799/dqkx.2022.419.
- Dou J, Yunus AP, Bui DT, Merghadi A, Sahana M, Zhu Z, Chen C-W, Khosravi K, Yang Y, Pham BT. 2019. Assessment of advanced random forest and decision tree algorithms for modeling rainfall-induced landslide susceptibility in the Izu-Oshima Volcanic Island, Japan. Sci Total Environ. 662:332–346. doi: 10.1016/j.scitotenv.2019.01.221.
- Dou J, Yunus AP, Bui DT, Sahana M, Chen C-W, Zhu Z, Wang W, Pham BT. 2019. Evaluating GIS-based multiple statistical models and data mining for earthquake and rainfall-induced landslide susceptibility using the LiDAR DEM. Remote Sens. 11(6):638. doi: 10.3390/rs11060638.
- Dou J, Yunus AP, Merghadi A, Shirzadi A, Nguyen H, Hussain Y, Avtar R, Chen Y, Pham BT, Yamagishi H. 2020. Different sampling strategies for predicting landslide susceptibilities are deemed less consequential with deep learning. Sci Total Environ. 720(February):137320. doi: 10.1016/j.scitotenv.2020.137320.
- Dou J, Yunus AP, Xu Y, Zhu Z, Chen C-W, Sahana M, Khosravi K, Yang Y, Pham BT. 2019. Torrential rainfall-triggered shallow landslide characteristics and susceptibility assessment using ensemble data-driven models in the Dongjiang Reservoir Watershed, China. Nat Hazards. 97(2):579–609. doi: 10.1007/s11069-019-03659-4.
- Dymond JR, Ausseil A-G, Shepherd JD, Buettner L. 2006. Validation of a region-wide model of landslide susceptibility in the Manawatu–Wanganui region of New Zealand. Geomorphology. 74(1-4):70–79. doi: 10.1016/j.geomorph.2005.08.005.
- Fang H, Shao Y, Xie C, Tian B, Shen C, Zhu Y, Guo Y, Yang Y, Chen G, Zhang M. 2023. A new approach to spatial landslide susceptibility prediction in karst mining areas based on explainable artificial intelligence. Sustainability. 15(4):3094. doi: 10.3390/su15043094.
- Fang Z, Wang Y, Peng L, Hong H. 2020. Integration of convolutional neural network and conventional machine learning classifiers for landslide susceptibility mapping. Comput Geosci. 139:104470. doi: 10.1016/j.cageo.2020.104470.
- Fosso Wamba S, Bawack R, Guthrie C, Queiroz M, Carillo K. 2020. Are we preparing for a good AI society? A bibliometric review and research agenda. SSRN J. 164:120482. doi: 10.2139/ssrn.3735322.
- Fu Z, Wang F, Dou J, et al. 2023. Enhanced Absence Sampling Technique for Data-Driven Landslide Susceptibility Mapping: A Case Study in Songyang County, China. Remote Sens. 15:3345. doi: 10.3390/rs15133345.
- Gautam P, Kubota T, Sapkota LM, Shinohara Y. 2021. Landslide susceptibility mapping with GIS in high mountain area of Nepal: a comparison of four methods. Environ Earth Sci. 80(9):359. doi: 10.1007/s12665-021-09650-2.
- Ghosh S, Carranza EJM, van Westen CJ, Jetten VG, Bhattacharya DN. 2011. Selecting and weighting spatial predictors for empirical modeling of landslide susceptibility in the Darjeeling Himalayas (India). Geomorphology. 131(1-2):35–56. doi: 10.1016/j.geomorph.2011.04.019.
- Gómez H, Kavzoglu T. 2005. Assessment of shallow landslide susceptibility using artificial neural networks in Jabonosa River Basin, Venezuela. Eng Geol. 78(1-2):11–27. doi: 10.1016/j.enggeo.2004.10.004.
- Gorsevski PV, Gessler PE, Boll J, Elliot WJ, Foltz RB. 2006. Spatially and temporally distributed modeling of landslide susceptibility. Geomorphology. 80(3-4):178–198. doi: 10.1016/j.geomorph.2006.02.011.
- Gorsevski PV, Jankowski P. 2008. Discerning landslide susceptibility using rough sets. Comput Environ Urban Syst. 32(1):53–65. doi: 10.1016/j.compenvurbsys.2007.04.001.
- Gupta SK, Shukla DP. 2023. Handling data imbalance in machine learning based landslide susceptibility mapping: a case study of Mandakini River Basin, North-Western Himalayas. Landslides. 20(5):933–949. doi: 10.1007/s10346-022-01998-1.
- Guzzetti F, Carrara A, Cardinali M, Reichenbach P. 1999. Landslide hazard evaluation: a review of current techniques and their application in a multi-scale study, Central Italy. Geomorphology. 31(1-4):181–216. doi: 10.1016/S0169-555X(99)00078-1.
- Guzzetti F, Mondini AC, Cardinali M, Fiorucci F, Santangelo M, Chang K-T. 2012. Landslide inventory maps: new tools for an old problem. Earth Sci Rev. 112(1-2):42–66. doi: 10.1016/j.earscirev.2012.02.001.
- Guzzetti F, Reichenbach P, Cardinali M, Galli M, Ardizzone F. 2005. Probabilistic landslide hazard assessment at the basin scale. Geomorphology. 72(1-4):272–299. doi: 10.1016/j.geomorph.2005.06.002.
- Hepdeniz K. 2020. Using the analytic hierarchy process and frequency ratio methods for landslide susceptibility mapping in Isparta-Antalya highway (D-685), Turkey. Arab J Geosci. 13(16):795. doi: 10.1007/s12517-020-05764-2.
- Huang C, Li F, Wei L, Hu X, Yang Y. 2022. Landslide susceptibility modeling using a deep random neural network. Appl Sci. 12(24):12887. doi: 10.3390/app122412887.
- Huang F, Tao S, Chang Z, Huang J, Fan X, Jiang S-H, Li W. 2021. Efficient and automatic extraction of slope units based on multi-scale segmentation method for landslide assessments. Landslides. 18(11):3715–3731. doi: 10.1007/s10346-021-01756-9.
- Huang J, Wu X, Ling S, Li X, Wu Y, Peng L, He Z. 2022. A bibliometric and content analysis of research trends on GIS-based landslide susceptibility from 2001 to 2020. Environ Sci Pollut Res Int. 29(58):86954–86993. doi: 10.1007/s11356-022-23732-z.
- Huang Y, Zhao L. 2018. Review on landslide susceptibility mapping using support vector machines. Catena (Amst). 165:520–529. doi: 10.1016/j.catena.2018.03.003.
- Ji J, Zhou Y, Cheng Q, Jiang S, Liu S. 2023. Landslide susceptibility mapping based on deep learning algorithms using information value analysis optimization. Land. 12(6):1125. doi: 10.3390/land12061125.
- Kavzoglu T, Sahin EK, Colkesen I. 2014. Landslide susceptibility mapping using GIS-based multi-criteria decision analysis, support vector machines, and logistic regression. Landslides. 11(3):425–439. doi: 10.1007/s10346-013-0391-7.
- Kavzoglu T, Teke A. 2023. Explainable artificial intelligence to explore intrinsic characteristics of factors controlling landslide susceptibility: opening the Black-Box. SSRN. 4378239. doi: 10.2139/ssrn.4378239.
- Kayastha P, Bijukchhen SM, Dhital MR, De Smedt F. 2013. GIS based landslide susceptibility mapping using a fuzzy logic approach: a case study from Ghurmi-Dhad Khola area, Eastern Nepal. J Geol Soc India. 82(3):249–261. doi: 10.1007/s12594-013-0147-y.
- Kulsoom I, Hua W, Hussain S, Chen Q, Khan G, Shihao D. 2023. SBAS-InSAR based validated landslide susceptibility mapping along the Karakoram Highway: a case study of Gilgit-Baltistan, Pakistan. Sci Rep. 13(1):3344. doi: 10.1038/s41598-023-30009-z.
- Lee S, Jang J, Kim Y, Cho N, Lee M-J. 2020. Susceptibility analysis of the Mt. Umyeon landslide area using a physical slope model and probabilistic Method. Remote Sens (Basel). 12(16):2663. doi: 10.3390/rs12162663.
- Lee S, Ryu J, Min K, Won J. 2001. Development of two artificial neural network methods for landslide susceptibility analysis. In IGARSS 2001 Scanning the Present and Resolving the Future Proceedings IEEE 2001 International Geoscience and Remote Sensing Symposium (Cat No01CH37217). Vol. 5. IEEE; p. 2364–2366. doi: 10.1109/IGARSS.2001.978003.
- Lenti L, Martino S. 2013. A parametric numerical study of the interaction between seismic waves and landslides for the evaluation of the susceptibility to seismically induced displacements. Bull Seismol Soc Am. 103(1):33–56. doi: 10.1785/0120120019.
- Li Y, Liu X, Han Z, Dou J. 2020. Spatial proximity-based geographically weighted regression model for landslide susceptibility assessment: a case study of Qingchuan Area, China. Appl Sci. 10(3):1107. doi: 10.3390/app10031107.
- Li Y, Wang X, Mao H. 2020. Influence of human activity on landslide susceptibility development in the Three Gorges area. Nat Hazards. 104(3):2115–2151. doi: 10.1007/s11069-020-04264-6.
- Liang Z, Peng W, Liu W, Huang H, Huang J, Lou K, Liu G, Jiang K. 2023. Exploration and comparison of the effect of conventional and advanced modeling algorithms on landslide susceptibility prediction: a case study from Yadong Country, Tibet. Appl Sci. 13(12):7276. doi: 10.3390/app13127276.
- Lin G-F, Chang M-J, Huang Y-C, Ho J-Y. 2017. Assessment of susceptibility to rainfall-induced landslides using improved self-organizing linear output map, support vector machine, and logistic regression. Eng Geol. 224:62–74. doi: 10.1016/j.enggeo.2017.05.009.
- Liu LL, Zhang J, Li JZ, Huang F, Wang LC. 2022. A bibliometric analysis of the landslide susceptibility research (1999–2021). Geocarto Int. 37(26):14309–14334. doi: 10.1080/10106049.2022.2087753.
- Liu S, Wang L, Zhang W, He Y, Pijush S. 2023. A comprehensive review of machine learning‐based methods in landslide susceptibility mapping. Geol J. 58(6):2283–2301. doi: 10.1002/gj.4666.
- Lv L, Chen T, Dou J, Plaza A. 2022. A hybrid ensemble-based deep-learning framework for landslide susceptibility mapping. Int J Appl Earth Obs Geoinf. 108:102713. doi: 10.1016/j.jag.2022.102713.
- Ma F, Wang J, Yuan R, Zhao H, Guo J. 2013. Application of analytical hierarchy process and least-squares method for landslide susceptibility assessment along the Zhong-Wu natural gas pipeline, China. Landslides. 10(4):481–492. doi: 10.1007/s10346-013-0402-8.
- Ma Y, Li H, Wang L, Zhang W, Zhu Z, Yang H, Wang L, Yuan X. 2021. Machine learning algorithms and techniques for landslide susceptibility investigation: literature review. J Civ Environ. 44(1):53–67.
- Merghadi A, Yunus AP, Dou J, Whiteley J, ThaiPham B, Bui DT, Avtar R, Abderrahmane B. 2020. Machine learning methods for landslide susceptibility studies: a comparative overview of algorithm performance. Earth Sci Rev. 207:103225. doi: 10.1016/j.earscirev.2020.103225.
- Montgomery DR, Dietrich WE. 1994. A physically based model for the topographic control on shallow landsliding. Water Resour Res. 30(4):1153–1171. doi: 10.1029/93WR02979.
- Montoya-Montes I, Rodríguez-Santalla I, Sánchez-García MJ, Alcántara-Carrió J, Martín-Velázquez S, Gómez-Ortiz D, Martín-Crespo T. 2012. Mapping of landslide susceptibility of coastal cliffs: the Mont-Roig del Camp case study. Geologica Acta. 10(4):439–455.
- Nefeslioglu HA, Sezer E, Gokceoglu C, Bozkir AS, Duman TY. 2010. Assessment of landslide susceptibility by decision trees in the metropolitan area of Istanbul, Turkey. Math Prob Eng. 2010:1–15. doi: 10.1155/2010/901095.
- Nian T, Guo X, Zheng D, Xiu Z, Jiang Z. 2019. Susceptibility assessment of regional submarine landslides triggered by seismic actions. Appl Ocean Res. 93:101964. doi: 10.1016/j.apor.2019.101964.
- Nurwatik N, Ummah MH, Cahyono AB, Darminto MR, Hong J-H. 2022. A comparison study of landslide susceptibility spatial modeling using machine learning. IJGI. 11(12):602. doi: 10.3390/ijgi11120602.
- Ozdemir A, Altural T. 2013. A comparative study of frequency ratio, weights of evidence and logistic regression methods for landslide susceptibility mapping: sultan Mountains, SW Turkey. J Asian Earth Sci. 64:180–197. doi: 10.1016/j.jseaes.2012.12.014.
- Pacheco Quevedo R, Velastegui-Montoya A, Montalván-Burbano N, Morante-Carballo F, Korup O, Daleles Rennó C. 2023. Land use and land cover as a conditioning factor in landslide susceptibility: a literature review. Landslides. 20(5):967–982. doi: 10.1007/s10346-022-02020-4.
- Park HJ, Lee JH, Woo I. 2013. Assessment of rainfall-induced shallow landslide susceptibility using a GIS-based probabilistic approach. Eng Geol. 161:1–15. doi: 10.1016/j.enggeo.2013.04.011.
- Pham BT, Pradhan B, Bui DT, Prakash I, Dholakia MB. 2016. A comparative study of different machine learning methods for landslide susceptibility assessment: a case study of Uttarakhand area (India). Environ Modell Softw. 84:240–250. doi: 10.1016/j.envsoft.2016.07.005.
- Pourghasemi HR, Kerle N. 2016. Random forests and evidential belief function-based landslide susceptibility assessment in Western Mazandaran Province, Iran. Environ Earth Sci. 75(3):185. doi: 10.1007/s12665-015-4950-1.
- Pourghasemi HR, Rahmati O. 2018. Prediction of the landslide susceptibility: which algorithm, which precision? CATENA. 162:177–192. doi: 10.1016/j.catena.2017.11.022.
- Pourghasemi HR, Teimoori Yansari Z, Panagos P, Pradhan B. 2018. Analysis and evaluation of landslide susceptibility: a review on articles published during 2005–2016 (periods of 2005–2012 and 2013–2016). Arab J Geosci. 11(9):193. doi: 10.1007/s12517-018-3531-5.
- Pradhan B. 2013. A comparative study on the predictive ability of the decision tree, support vector machine and neuro-fuzzy models in landslide susceptibility mapping using GIS. Comput Geosci. 51:350–365. doi: 10.1016/j.cageo.2012.08.023.
- Putri CR, Soleh SM, Saregar A, Anugrah A, Susilowati NE. 2021. Bibliometric analysis: augmented reality-based physics laboratory with VOSviewer software. J Phys: Conf Ser. 1796(1):012056. doi: 10.1088/1742-6596/1796/1/012056.
- Qiu DD, Niu RQ, Zhao YN. 2017. Sensitivity analysis of seismic landslides under different sampling strategies. J Rock Mech Geotech Eng. 36:3401–3408. doi: 10.13722/j.cnki.jrme.2015.1528.
- Qiu X, Kong H, Wang K, Zhang N, Park S, Bu N. 2023. Past, present, and future of tourism and climate change research: bibliometric analysis based on VOSviewer and SciMAT. Asia Pacific J Tour Res. 28(1):36–55. doi: 10.1080/10941665.2023.2187702.
- Rahman FF, Haris F. 2022. COVID-19 emergency response in Southeast Asian region: a bibliographic analysis using VOSviewer software. Bali Med J. 11(3):1656–1659. doi: 10.15562/bmj.v11i3.3758.
- Rapolla A, Paoletti V, Secomandi M. 2010. Seismically-induced landslide susceptibility evaluation: application of a new procedure to the island of Ischia, Campania Region, Southern Italy. Eng Geol. 114(1-2):10–25. doi: 10.1016/j.enggeo.2010.03.006.
- Regmi AD, Dhital MR, Zhang J, Su L, Chen X. 2016. Landslide susceptibility assessment of the region affected by the 25 April 2015 Gorkha earthquake of Nepal. J Mt Sci. 13(11):1941–1957. doi: 10.1007/s11629-015-3688-2.
- Reichenbach P, Rossi M, Malamud BD, Mihir M, Guzzetti F. 2018. A review of statistically-based landslide susceptibility models. Earth Sci Rev. 180:60–91. doi: 10.1016/j.earscirev.2018.03.001.
- Rigon R, Bertoldi G, Over TM. 2006. GEOtop: a distributed hydrological model with coupled water and energy budgets. J Hydrometeorol. 7(3):371–388. doi: 10.1175/JHM497.1.
- Ruff M, Czurda K. 2008. Landslide susceptibility analysis with a heuristic approach in the Eastern Alps (Vorarlberg, Austria). Geomorphology. 94(3-4):314–324. doi: 10.1016/j.geomorph.2006.10.032.
- Sarfraz Y, Basharat M, Riaz MT, Akram MS, Xu C, Ahmed KS, Shahzad A, Al-Ansari N, Thuy Linh NT. 2022. Application of statistical and machine learning techniques for landslide susceptibility mapping in the Himalayan road corridors. Open Geosci. 14(1):1606–1635. doi: 10.1515/geo-2022-0424.
- Shirzadi A, Soliamani K, Habibnejhad M, Kavian A, Chapi K, Shahabi H, Chen W, Khosravi K, Thai Pham B, Pradhan B, et al. 2018. Novel GIS based machine learning algorithms for shallow landslide susceptibility mapping. Sensors (Basel). 18(11):3777. doi: 10.3390/s18113777.
- Shirzadi A, Solaimani K, Roshan MH, Kavian A, Chapi K, Shahabi H, Keesstra S, Ahmad B, Bin, Bui DT. 2019. Uncertainties of prediction accuracy in shallow landslide modeling: sample size and raster resolution. CATENA. 178:172–188. doi: 10.1016/j.catena.2019.03.017.
- Simoni S, Zanotti F, Bertoldi G, Rigon R. 2008. Modelling the probability of occurrence of shallow landslides and channelized debris flows using GEOtop-FS. Hydrol Process. 22(4):532–545. doi: 10.1002/hyp.6886.
- Sorbino G, Sica C, Cascini L. 2010. Susceptibility analysis of shallow landslides source areas using physically based models. Nat Hazards. 53(2):313–332. doi: 10.1007/s11069-009-9431-y.
- Su X, Xia X, Liang Q, Hou J. 2022. A coupled discrete element and depth-averaged model for dynamic simulation of flow-like landslides. Comput Geotech. 141:104537. doi: 10.1016/j.compgeo.2021.104537.
- Wang Y, Fang Z, Hong H. 2019. Comparison of convolutional neural networks for landslide susceptibility mapping in Yanshan County, China. Sci Total Environ. 666:975–993. doi: 10.1016/j.scitotenv.2019.02.263.
- Wang Z, Xu S, Liu J, Wang Y, Ma X, Jiang T, He X, Han Z. 2023. A Combination of Deep Autoencoder and Multi-Scale Residual Network for Landslide Susceptibility Evaluation. Remote Sens. 15(3):653. doi: 10.3390/rs15030653.
- Xie, H, Huang Y, Chen Q, Zhang Y, Wu Q. 2019. Prospects for agricultural sustainable intensification: a review of research. Land (Basel). 8(11):157. doi: 10.3390/land8110157.
- Xing L, Wang SM, Wang L. 2014. Response of typical hydrodynamic pressure landslide to reservoir water level fluctuation: shuping landslide in Three Gorges Reservoir as an example. J Eng Geol. 22:876–882. doi: 10.13544/j.cnki.jeg.2014.05.016.
- Xing X, Wu C, Li J, Li X, Zhang L, He R. 2021. Susceptibility assessment for rainfall-induced landslides using a revised logistic regression method. Nat Hazards. 106(1):97–117. doi: 10.1007/s11069-020-04452-4.
- Yi Y, Zhang Z, Zhang W, Jia H, Zhang J. 2020. Landslide susceptibility mapping using multiscale sampling strategy and convolutional neural network: A case study in Jiuzhaigou region. Catena (Amst). 195:104851. doi: 10.1016/j.catena.2020.104851.
- Yong C, Jinlong D, Fei G, Bin T, Tao Z, Hao F, Li W, Qinghua Z. 2022. Review of landslide susceptibility assessment based on knowledge mapping. Stoch Environ Res Risk Assess. 36(9):2399–2417. doi: 10.1007/s00477-021-02165-z.
- Youssef K, Shao K, Moon S, Bouchard LS. 2023. Landslide susceptibility modeling by interpretable neural network. Commun Earth Environ. 4(1):1–79. doi: 10.1038/s43247-023-00806-5.
- Zhang J, Ma X, Zhang J, Sun D, Zhou X, Mi C, Wen H. 2023. Insights into geospatial heterogeneity of landslide susceptibility based on the SHAP-XGBoost model. J Environ Manage. 332(August 2022):117357. doi: 10.1016/j.jenvman.2023.117357.
- Zhao Y, Jiang J, Ni F, Zhou L. 2019. Fatigue cracking resistance of engineered cementitious composites (ECC) under working condition of orthotropic steel bridge decks pavement. Appl Sci. 9(17):3577. doi: 10.3390/app9173577.
- Zhou X, Huang F, Wu W, Zhou C, Zeng S, Pan L. 2022. Regional landslide susceptibility prediction based on negative sample selected by coupling information value method. Adv Eng Sci. 54:25–35. doi: 10.15961/j.jsuese.202100808.
- Zhou X, Wen H, Li Z, Zhang H, Zhang W. 2022. An interpretable model for the susceptibility of rainfall-induced shallow landslides based on SHAP and XGBoost. Geocarto Int. 37(26):13419–13450. doi: 10.1080/10106049.2022.2076928.
- Zhuo L, Huang Y, Zheng J, Cao J, Guo D. 2023. Landslide susceptibility mapping in guangdong province, china, using random forest model and considering sample type and balance. Sustainability. 15(11):9024. doi: 10.3390/su15119024.