
 ?Mathematical formulae have been encoded as MathML and are displayed in this HTML version using MathJax in order to improve their display. Uncheck the box to turn MathJax off. This feature requires Javascript. Click on a formula to zoom.
Abstract
Land use / land cover (LULC) change profoundly impacts regional natural, economic, and ecological development; However, no study has been conducted to classify LULC changes in Ibb city using high-resolution satellite images. This study aims to evaluate and predict LULC changes and their driving forces in Ibb city, the tourist capital of Yemen. In this study, an integrated cellular automata and Markov chain (CA-Markov) model were implemented to analyze the spatio-temporal trends of Ibb city. Meanwhile, a socio-economic survey and key informant interviews were conducted to analyze the probable drivers of LULC change. Landsat (5, 7, and 8) data are used to analyze maps of LULC distributions for 1990, 2005, and 2020 at regular intervals. A CA–Markov model was employed to simulate long-term changes to the landscape at 15-year intervals from 2020 to 2050. Results indicate that the vegetation area decreased from 1760.4 km2 (33.2%) to 1371.7 km2 (27.8%). Meanwhile, barren land, grassland, and built-up areas increased from 3190.5 km2 (60.1%) to 3428.6 km2 (64.8%), from 336.0 km2 (6.3%) to 419.3 km2 (7.9%), and from 11.8 km2 (0.38%) to 76.2 km2 (1.42%), respectively. The CA-Markov model’s accuracy was validated by comparing simulated and actual LULC maps for 2020 using the land change modeler (LCM) of IDRISI-TerrSet software. The predicted LULC maps for 2035 and 2050 indicate that the vegetation area, grassland, and barren land showed decreasing trends, while the built-up area and waterbody showed increasing trends. These results provide valuable insights for tracking future LULC changes and are pivotal in guiding sustainable land use practices, striking a balance between conserving natural resources and advancing urban development projects in the future.
Driving factors on land-cover transitions tend to be spatiotemporal scale-dependent.
The study analyzed changes in LULC trends and their Proximate and Underlying drivers.
Significant changes were observed between 1990 and 2020, and changes are expected by 2035 and 2050.
The integration of the CA-Markov Model and GIS techniques successfully simulated spatiotemporal LULC changes.
Fine-tuned analysis of driving forces is essential for planning and managing sustainable land use.
HIGHLIGHTS
1. Introduction
The rapid growth of urbanization and its associated land use changes have become pivotal issues in contemporary urban planning and environmental management. The dynamics of Land use / land cover (LULC) are a result of a myriad of interconnected factors, ranging from demographic shifts and economic activities to natural phenomena and policy interventions (Yesuph and Dagnew Citation2019). Therefore, what LULC change exhibits are the results of the dual interaction between the natural environment and human activities (Zhang et al. Citation2023). Human activities significantly influence changes in land use, and ecological, social, and economic environments interact with these changes, such as (urbanization, population growth, agricultural expansion, deforestation, and industrialization), whereas, natural forces can also play a role in their development (Tuan Citation2022). These changes, which humans cause, can lead to the loss of biodiversity, soil degradation, water pollution, and increased greenhouse gas emissions, among other negative environmental impacts. It can also affect social and economic systems, such as through changes in land values, displacement of communities, and altered access to resources (Biswas et al. Citation2020).
In the process of rational planning and land use protection, it is important to understand the mechanisms of land use changes and the scientific simulation of their future trends to provide a scientific basis for the development of sustainable land use in the region (Zhang et al. Citation2022). Traditional data collection methods often struggled to provide a comprehensive view of these processes due to limitations in spatial coverage, temporal resolution, and data accuracy (Mohammadpour and Viegas Citation2022). Therefore, remote sensing (RS) and Geographic information systems (GIS) technologies have emerged as indispensable tools in monitoring and analyzing LULC dynamics and identifying spatial changes due to their ability to provide large-scale, accurate, and consistent spatial data over time (Tariq and Mumtaz Citation2023a).
The integration of remote sensing data with advanced modeling techniques represents a powerful approach to comprehending the spatiotemporal dynamics of LULC changes. This combined methodology not only allows for a detailed exploration of how LULC patterns evolve over time and space but also enables the identification of the underlying factors that drive these transformations (Gómez et al. Citation2016; Nath et al. Citation2018; Lu et al. Citation2021). The LULC prediction model analyzes existing data to evaluate and simulate land use status, providing guidance and data support for future land use decisions (MohanRajan et al. Citation2020; Tadese et al. Citation2021).
In current years, many scholars have designed a variety of models to predict future LULC change at different scales (Khwarahm Citation2021). For example, system dynamics (SD) (Dede et al. Citation2021), machine learning algorithms (Kafy et al. Citation2022), the Markov chain model (Dey et al. Citation2021), Conversion of Land Use and its Effects at Small region extent (CLUE-S) model (Lamichhane and Shakya Citation2021), and Markov chain and cellular automata models (Tariq et al. Citation2023; Tariq and Mumtaz Citation2023b), artificial neural networks (ANNs) (de Souza et al. Citation2022; Sajan et al. Citation2022), RapidEye images (Kafy et al. Citation2021), etc., all of them can help us recognize and explain the changing law of LULC change, and simulate and predict its future scenarios (Rigo et al. Citation2022). Each prediction model has its characteristics for simulating the future pattern of land use. The Markov chain model mainly has advantages in the prediction of the number of LULC classes (Khwarahm Citation2021), and the cellular automata model has advantages in the prediction of spatial simulation (Wang et al. Citation2022). Consequently, the combination of CA and a Markov model, referred to as CA-Markov, in a GIS environment provides a valuable approach for predicting future LULC that changes with spatiotemporal dimensions (Khwarahm Citation2021).
Previous studies have demonstrated the efficacy of the CA-Markov model in forecasting LULC change scenarios across diverse geographical regions (Koko et al. Citation2020; Khwarahm et al. Citation2021; Asif et al. Citation2023; Tariq and Mumtaz Citation2023b). LULC patterns in Peshawar, Pakistan, were mapped from 1998 to 2018 at 5-year intervals, and future changes in LULC were projected for the years 2018, 2028, and 2038 using the CA-Markov model (Tariq et al. Citation2022). In addition, seasonal land surface temperature (LST) and LULC change were predicted for Faisalabad using CA-Markov-Chain (Tariq and Shu Citation2020). (Koko et al. Citation2020), spatial modeling showed the transformation of arid lands into built-up areas and vegetation for the years 2035 and 2050 in Zaria, Nigeria. In Lahore, Pakistan, projections show built-up area growth from 830.22 to 955.53 km2, and the Urban Index predicts a decrease in temperature between 2032 and 2046 (Tariq et al. Citation2023).
Environmental growth is a problem of concern in developing countries, such as Yemen, where there is a lack of long-term credible data on land use and forecasting of future scenarios, which hinders the ability to plan and manage urban areas sustainably (Al-shalabi et al. Citation2013). For example, changes in land use occur in the cities as a result of population growth that leads to uncontrolled urban expansion and a lack of sustainable urban planning (Al-Darwish et al. Citation2018). Yemen has not made a smooth urban transition due to many factors and one of them is land disputes have become relatively common, as there is no system for recording land titles and documents, whether official, customary, or national (Republic of Yemen Citation2016). In addition, the return of immigrants after the Gulf War in the early 1990s led to the rapid spread of slums in the cities of Yemen (Arnous et al. Citation2020; Dammag et al. Citation2023).
One such urban center grappling with the complexities of urbanization is Ibb city due to socioeconomic and political importance. In recent years, the city has witnessed an influx of internally displaced persons (IDPs) and recent conflicts in Yemen, and the increasing demand in the urban sector and share scarce resources, although it continues to rise, has severely depleted natural resources and environmental degradation (Dammag et al. Citation2023). The vegetation lands, landscapes, and attractions surrounding the city have been greatly lost due to rapid urbanization on non-urban lands (Al-Darwish et al. Citation2018). The rapid urbanization of Ibb city, its effects on agricultural land, and the detection of abrupt changes make it imperative to conduct testing. No study previously investigated the spatiotemporal and future impacts of LULC change and analyzed the primary and proximal drivers of these changes in the study area to lay the foundations for sustainable land use management. Therefore, this study is considered crucial to reveal the detection of urban expansion over the past and next three decades and analyze the primary and proximal drivers of these changes in this region. This study aims to create a model of each LULC in our study area by combining Markov chain and cellular automata. To achieve this, (1) to explore the spatiotemporal dynamics of LULC changes in the last three decades; (2) to Investigate the primary drivers of LULC changes and their quantifiable impacts; (3) to simulate the city’s potential LULC change in the years 2035 and 2050 using the CA-Markov model. The overall growth behavior of a city can be extracted and urban planners can take influences on urban systems into making informed decisions for sustainable urban development and resource management as a result. It can assist in the development and implementation of many short and long-term development plans for Ibb city and its surrounding areas.
2. Materials and methods
2.1. Description of study area
The study area, Ibb city, is located in southwest Yemen, is one of the historical cities and it has 20 administrative districts. It is located in the highlands of central Yemen between 13°54′ and 14° 73′ N latitude and 43° 08′ and 45° 21′ E longitude, as depicted in . Its importance is due to its role as a commercial and distribution center of regional importance (Arnous et al. Citation2020). Ibb city has a total land area of 5300 km2. The population over the past three years has been estimated at 3,243,580, making it the second most populous city after Sana’a (the capital of Yemen), which is ∼193 km from Yemen’s capital (Dammag et al. Citation2023). Due to its location at an altitude of around 1900 m above sea level, the temperature in Ibb city experiences slight variations throughout the year.
Figure 1. Location map of the study area.
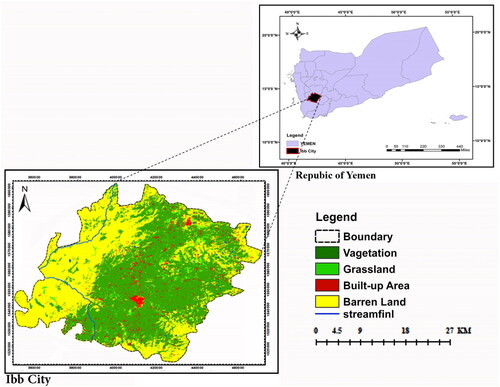
The lowest temperatures occur in December and February with an average monthly temperature of 18 °C (64 °F), while the highest temperatures are recorded in June and August with an average monthly temperature of 28 °C (82 °F) (https://weatherspark.com 2020). Agriculture is the primary economic activity in Ibb city, accounting for 5.6% of Yemen’s total production, due to the city’s volcanic soil, and heavy rainfall, which contribute to its agricultural productivity. The city cultivates various crops, including wheat, coffee, fruits, corn, barley, and vegetables, and is famous for its basic handicrafts (Robinson et al. Citation2018). The diversity of agricultural products is due to the heavy rainfall throughout the year, which makes the soil fertile. As a result, Ibb city serves as the main agricultural center and food source for the surrounding areas’ inhabitants (Al-Mashreki et al. Citation2010).
2.2. Data sources and methods of acquisition
This study involved using mixed methods to complement each other to generate primary and secondary data. One of the complementary methods employed was the use of RS and GIS techniques to collect data on spatiotemporal changes in LULC. Landsat image displays from the freely accessible USGS data portal. The Landsat images used in the study consisted of Landsat TM (5) from 1990, Landsat ETM+ (7) from 2005, and other images for 2020 from Landsat OLI_TIRS (8), with a spatial resolution of 30 × 30 m. Track numbers 128/47 and 128/48 were obtained, as indicated in . ERDAS's LULC change classification will use a 15-meter Google Earth connected to the software, allowing interpretation of the correct location of LULC for remote sensing blurry images.
Table 1. Detail of data sources used for analysis of LULC in the study.
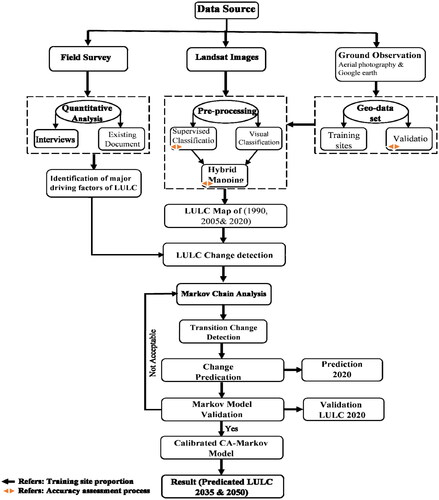
The path data system is a key force derived from OpenStreetMap, processed by QGIS, and used by the CA-Markov model in TerrSet as a LULC future prediction transformation format file (Faichia et al. Citation2020). In this study, a series of preprocessing operations were carried out using ENVI 5.3 and ArcGIS 10.7 image processing software. Various Landsat datasets were employed for the analysis. (2) socioeconomic survey methodology, which is the review of pertinent literature from both published and unpublished sources to gather secondary data. Furthermore, primary data on the drivers of LULC changes were generated through field observations and interviews with key informants. The data obtained from interviews underwent descriptive analysis using SPSS software. (3) Ground Truthing Points (GTPs) were gathered during the field investigation. High-resolution imagery from the Google Earth Engine served as a supplementary resource for visual verification and validation of specific features or land cover classes present at the GTPS locations. Key informants and stakeholders were used to capture GTPs by revealing the dynamics of LULC changes in and around their area. shows the flowchart of the LULC change mapping method used in this study.
Figure 2. The flow chart of the LULC change mapping methodology.
2.3. Data acquisition methods
The acquisition dates for each Landsat scene and further details are shown in .
2.4. LULC change assessment
2.4.1. Pre-processing of images
Satellite images are pre-processed to determine the relationship between the acquired data and various biophysical phenomena (Zhang et al. Citation2023). We used ENVI 5.3 software to pre-process satellite images for various processes, such as geometry correction, radiometric calibration, atmospheric correction, and image optimization. The pre-processing process involves referencing geographic imagery to remove geometric distortions in the acquired data and placing the satellite imagery into a geographic coordinate system (Darem et al. Citation2023). The analysis of land cover change detection using multi-date remote sensing images relies on precise radiometric and geometry corrections, such as multi-time Landsat images and radiometric correction (Som-Ard et al. Citation2021).
2.4.2. Image classification
Image classification automatically classifies all pixels in Landsat images into LULC types to extract useful objective information (Capolupo et al. Citation2020). Ground truth data and verification of satellite images were collected for image classification. The input bands used in the study to produce false-color composite maps included bands 4, 3, and 2 for Landsat 5 TM and bands 5, 4, and 3 for Landsat 8 OLI. As indicated in , the spectral features of each image pixel were matched with training samples for the study area and satellite images and classified into five LULC classes, namely, built-up areas, barren lands, vegetation land, grassland, and waterbody.
Table 2. Description of LULC classification types.
After pre-processing the satellite images, the supervised maximum likelihood classifier (MLC) algorithm was used to classify the acquired satellite images (Álvarez Citation2023). This method has a strong theoretical basis and adaptability to different data, LULC types, and satellite systems (Aljenaid et al. Citation2022). However, several types were misclassified into the supervised classification of LULC; the cultivated land type merged with the lowland type because they could not be separated due to similar spectral characteristics. Post-classification refinement has been used to improve classification accuracy because it is a simple and effective method (Ray et al. Citation2023). Additionally, because the urban surface is heterogeneous and composed of a complex combination of features (e.g. buildings, roads, trees, soil, and water), mixed pixels are a typical issue when utilizing medium spatial resolution data, such as Landsat (Mushore et al. Citation2022). The mixed-pixel issue has been addressed in several ways. For example, information and GIS data (e.g. DEM, water bodies, etc.) were used in the ERDAS spatial modeler to correct previously misclassified land cover types. This was done for the successful spectral classification of LULC spectral stratification. In addition, we created 50 verification forms using existing land use data from the city’s Office of Public Works and Google Earth maps, which can help provide statistical confidence in the accuracy of the image classification results.
2.4.3. Accuracy assessment
Classification accuracy assessment of the maps tells us the extent to which image classification maps contain some errors. Therefore, it is important to evaluate the accuracy of the results to ensure higher reliability of the resulting maps and to detect subsequent changes (Fonte et al. Citation2020). Accuracy assessment was performed using an error/confusion matrix, which is a common and most effective method to represent the classification accuracy of remote sensing data and is recommended by many researchers (Jamal et al. Citation2022). This procedure involves creating a confusion/error matrix where data gathered from reference points is juxtaposed with the categorized image in specific zones. To assess the precision of the LULC maps, reference points for 1990 and 2005 were acquired from the 1990 topographic map, visual interpretation of Landsat TM images from 1990 and 2005, along with interviews and group discussions pertaining to the study area. Furthermore, high-quality images from sources like Google Earth were also utilized. To establish reference points for the 2020 image, on-site observations were conducted using a 60CSx GPS map, covering an area of ∼100 × 100 m with typical LULC types in the research area (http://www.cso.gov.ye 2020). A total of 143 reference points were employed to construct a confusion/error matrix. Among these, 28 reference points were allocated for LULC types with extensive area coverage, whereas 17 reference points were designated for LULC types with limited area coverage, such as urban areas. The resulting confusion matrix was utilized to calculate overall accuracy, user accuracy, product accuracy, and the kappa coefficient. Overall accuracy can be used to describe the overall accuracy of a class map by specifying the proportion of pixels that are correctly labeled. The kappa (K) value shows the agreement between classification and ground truth pixels. While indicating the overall accuracy, the kappa factor considers errors of omission and assignment that the kappa value indicates from −1 to 1. K < 0 means that the LULC class is in greater depletion than the absolute value of K, and more intensive lands have been depleted. K ≥ 0 means just the opposite. Mathematically, the Kappa test measures the coefficient value in the raster EquationEquation (1)(1)
(1)
(1)
(1)
Where K is the kappa coefficient, S is the number of columns and land cover class in the error matrix. Aii is the number of pixels in the first i-row and first i-column of the error matrix. Ai+ and A+i are the total number of pixels in row i and column i, respectively. r is the number of rows in the matrix.
The findings revealed that in 1990, the overall accuracy and kappa coefficient were 87.4% and 0.84, respectively. In 2005, these figures were 86.4% and 0.82, while in 2020, they were 89.2% and 0.86. The overall classification demonstrated robust performance across all maps, attaining an overall accuracy of 87.6% and a resulting kappa coefficient of 0.84 ().
Table 3. Accuracy assessment of LULC classified for 1990, 2005, and 2020.
2.4.4. LULC change detection and analysis
In this study, the matrix has been generated using GIS techniques of superposition, automated spatial analysis, and a 30-year dynamic process. To estimate the direction of transition between future LULC change probabilities based on a certain year, Markov chains can calculate the likelihood of changes in direction from the first picture to the last image (Kumar and Arya Citation2021). LULC change detection is an important application in remote sensing technology because it can identify land cover changes in the same geographical area at different times with consistent image quality (Zhu Q et al. Citation2022). The initial processing of the Markov chain involves the construction of a transfer matrix and a probabilistic transfer matrix that predicts the future trajectory of LULC changes.
The quantity change of LULC may be represented by a single LULC dynamic index and overall dynamic degree, which is expressed by the area change rate (%) of single or all land classes in unit time; the extent and rate of change in LULC can be quantitatively compared by using EquationEquation (2)(2)
(2) and Equation(3)
(3)
(3)
(2)
(2)
(3)
(3)
Where Ds and Dg represent the single dynamic degree and comprehensive dynamic degree (%) respectively; Ak and Ak′ represent the area of type k at the beginning and end of the study period (km2); ΔAk represents the total area change of class k during the study period (km2), take a positive value; Ak is the land use area of type k (km2); n is the land type; T represents time, the above formula represents the annual change rate of a single or overall land type.
2.5. Detecting driving factors of LULC change
LULC changes are driven by various forces and may be classified into direct (proximate) and indirect (underlying) factors (Gebeyehu et al. Citation2023). The proximate drivers of LULC change involve human activities or instantaneous actions that come from intentional land use practices and directly affect LULC. The indirect factor describes the broader context and an underlying factor behind these local actions. As a result, indirect causes also tend to be complex and act more diffusely, frequently by changing one or more (Tilahun Citation2022). Some studies revealed that the relationship between LULC change and its driving forces is dynamic and complex, closely related to socioeconomic issues, and may occur at different spatial and temporal scales (Yesuph and Dagnew Citation2019). Furthermore, due to the complex interaction among various biophysical environmental factors and socioeconomic factors, LULC changes are constantly occurring in response to the dynamic interaction between direct and indirect causes (Guarderas et al. Citation2022).
In this study, primary data sources and field observations, such as socio-economic surveys, interviews, and discussions with stakeholders and local authorities were used to obtain information about historical land use changes, socio-economic status, and driving forces of LULC changes in the study area, as illustrated in . Interview questions are prepared and tested in advance and then revised to make some of the unclear questions more focused and clearer before they are presented to the respondents.
Figure 3. The five broad groups of proximal drivers and underlying causes of LULC change.
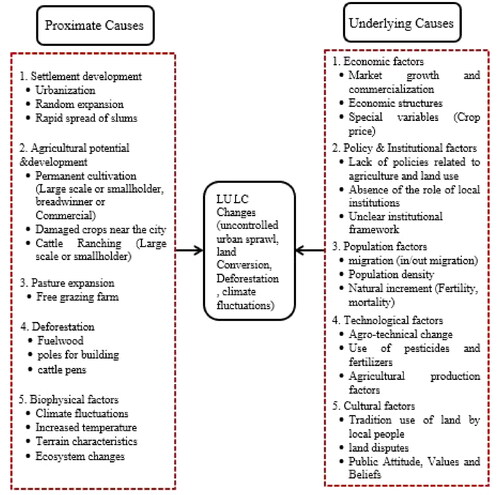
They also provided their future prospects on each of the underlying drivers based on multiple factors in the field of study. Key informants were also used to assess the effect of each underlying cause, such as (i) high effect, (ii) moderate effect, and (iii) low effect. Also, the future effects of different underlying causes were estimated as (i) increased effects, (ii) normal effects, and (iii) decreased effects. The quantitative data collected were coded and entered into the SPSS. The results have been compiled and presented in the form of percentages, numbers, and tables. This analysis helped identify and quantify drivers of land use changes based on historical trends of land use changes, socioeconomic status, and drivers of change in the study area.
2.6. Change analysis and modeling
2.6.1. Post-classification processing using the land change model
Post-classification change (PCC) is a method of detecting the nature, speed, and location of changes (Asokan and Anitha Citation2019). Post-classification processing involved change detection using automatic GIS spatial overlay and multi-time dataset analysis of LULC numerical change data. It involved the creation of LULC change matrices, frequency tables, and cross-tabulation for quantification. Finally, LULC detection was mapped by ArcGIS 10.7.
2.6.2. Simulation and prediction of LULC changes
2.6.2.1. Markov-chain model analysis
The Markov is a stochastic model which is used for randomly changing situations. It is a commonly used LULC change quantity prediction model. Its principle is to predict the probability of future events through the change law of initial probability and transition probability between states (Hamad et al. Citation2018; Nath et al. Citation2020). Use the Markov chain to calculate the transition probability matrix of each land use type, and determine the changing trend of each state at each moment in the future through the initial probability of different states in the system and the transition probability between states by using EquationEquation (4)(4)
(4)
(4)
(4)
Where St and St+1 represent the state of the land type at time t and t + 1; Pij is the transition probability of the land type i transforming into the land type j, and 0 ≤ Pij ≤ 1.
2.6.2.2. Cellular automata (CA)
The cellular automata (CA) model is a LULC change spatial prediction model. The principle is that through the current state of the cell and its neighbors, Predict the state transition of the next period with a specific transition rule, as presented in EquationEquations (5)(5)
(5)
(5)
(5)
Where St+1 is the state of a cell at the next moment; St is the state of the cell at the last moment; Nt is the state of the neighborhood of the cell at the last moment; f is the transformation rule function between the cell and the neighborhood.
In this study, the CA-Markov model within the IDRISI 20 software was employed to project future LULC changes for the upcoming three decades starting from 2020. The Al-Idrisi module, integrated into the Terr Set 2020 software, was utilized in conjunction with the CA-Markov model. This implementation incorporated transition probability tables derived from the map to simulate and forecast various scenarios of LULC change. The process of modeling future LULC changes through the combined CA-Markov model followed a specific set of steps. To begin with, raster-formatted classified LULC maps from the years 1990, 2005, and 2020 served as the foundation for generating transition matrices. These matrices captured the transitions between LULC types for three key time periods: the first (1990–2005), second (2005–2020), and third (1990–2020). Next, this was followed by the creation of transition fit maps, which were used as inputs to predict LULC and simulate the distribution in 2035 and 2050 based on the major transitions that occurred between LULC types from 1990 to 2020. Also, to define CA filters an adjacency filter was used Normal 5 × 5 as a definition of the neighborhood. That is, each cell center is surrounded by a matrix area of 5 × 5 cells to influence cellular changes significantly. After calibrating the model, the LULC for the year 2020 was built using the transition probabilities from 1990 to 2005 with the LULC base map of the year 2005. Then, the Kappa Index of Agreement (KIA) approach was applied to assess the accuracy of the predicted land cover map for 2020 to evaluate its consistency with the actual 2020 LULC map. The Kappa coefficient serves as a measure of similarity between the simulation results and the observed data as a whole, and its values range from 0 to 1. The calculation of the Kappa coefficient is performed using the CROSSTAB tool in GIS Analysis within the IDRISI software. It follows the formula denoted as EquationEquation (6)(6)
(6) . According to Edan et al. (Citation2021), the excellent agreement is that the index of the Kappa coefficient is ≥0.75 (if Kappa ≥ 0.75) between the simulated and actual maps. Finally, following the same process, LULC for the years 2035 and 2050 were simulated using the CA-Markov model in the IDRIS module integrated with the TerrSet 2020 software using transition probabilities from 1990 to 2020, the 2020 LULC rule.
(6)
(6)
Where is the quantitative error accuracy of the land type; Xp,i is the predicted area of the land type i; Xr,i is the actual area of land type i.
3. Results
3.1. Accuracy assessment
The accuracy of LULC change analysis has been assessed of the three classified maps from 1990, 2005, and 2020 by creating confusion/error matrices for each classified map, comparing what was mapped with what actually existed on the land. Several evaluation metrics were used, including overall accuracy, kappa statistics, product accuracy (PA), and user accuracy (UA). The results indicated that the overall accuracy and kappa coefficient for the year 1990 were 87.4% and 0.84, respectively. For 2005, the overall accuracy and kappa coefficient were 86.4% and 0.82, respectively. For 2020, the overall accuracy and kappa coefficient were 89.2% and 0.86, respectively. Good overall classification results with an overall accuracy of 87.6% for all maps and a resulting kappa coefficient of 0.84. Thus, the image processing method applied in this study has been effective in producing time-matched LULC data, which is summarized in .
3.2. Spatiotemporal variation in the trends of LULC
The change and statistics matrix has been generated for the years 1990, 2005, and 2020 to analyze the spatial distribution of different LULC types over the study period, depicted in . As presented in , the dynamics of change for the five LULC classes during the past three decades. The detailed results can be seen in , which highlights the amount and class of changes that occurred per LULC type. The findings indicate that the research area has undergone a relatively high degree of land use change. Built-up areas, barren land, and grasslands have witnessed continuous growth, while the area of vegetated land has decreased over the past three decades. Overall, vegetation land and barren land were the major LULC classes in the study area and contributed about 92% of the total land cover.
Figure 4. LULC maps of Ibb city in 1990, 2005, and 2020.
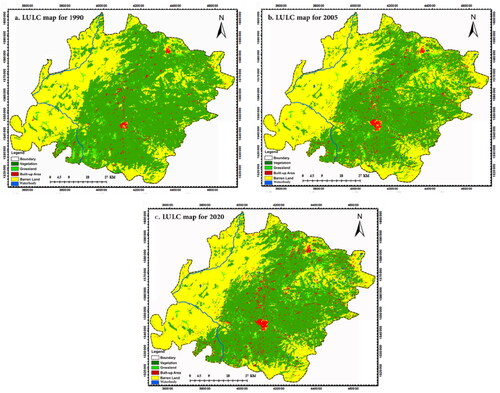
Table 4. The area statistics of LULC, percent, and annual change rate between 1990, 2005, and 2020.
Table 5. Markov probability matrix derived for LULC change from 1990 to 2005 and 2005 to 2020.
During the first (1990–2005), the analysis presented in indicates the built-up area expanded at a speed of 35.4 km2, increasing from 11.8 to 47.2 km2, with an annual change rate of 2.4 km2/year. Similarly, grassland witnessed an increase of 56 km2 (1.1%), expanding from 336.0 to 6.3 km2. At the same time, barren land exhibited continuous growth, increasing in area by 359.1 km2, from 3190.5 to 3549.6 km2, with an annual rate of change of 23.9 km2/year. On the other hand, there was a significant loss of vegetation land in the study area. Comparing 2005 to 1990, the vegetation land decreased by 451.7 km2 (8.5%) at a negative annual rate of 30.1 km2. In 1990, waterbody area was the least, representing only 0.02% of the total area. However, the water body area increased from 1.3 km2 in 1990 to 2.2 km2 in 2005, showing an increase of 0.9 km2 (0.04%) and an annual growth rate of 0.06 km2.
During the second (2005–2020), the results in offered that climate change over an area, especially since 2013, led to a decrease in the barren land by 121 km2, from 3549.6 km2 in 2005 to 3428.6 km2 in 2020, at an annual rate of change (8.1 km2). Although Barren land has continued to decline, they are still the largest LULC type in the study area, followed by vegetation land, built-up areas, grassland areas, and waterbody. The area of vegetated land increased during this period by 63 km2 (3.1%) compared to the previous period (1990–2005), with an annual change rate of 4.2 km2. Similarly, grassland increased by 27 km2 (0.5%), where the increase indicates an annual change rate of 1.8 km2 per year. The built-up area continued to increase from 47.2 km2 in 2005 to 76.2 km2 in 2020, representing an increase of 29 km2, with an annual change rate of 1.9 km2 per year. In the same period, the waterbody area increased from 2.2 km2 in 2005 to 3.8 km2 in 2020, indicating a change of 1.6 km2 at a rate of 0.1 km2 per year, as shown in .
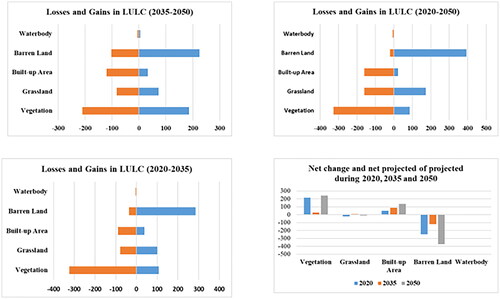
During the third (1990–2020), this period illustrates the total changes that materialized in the study area during the past three decades, as offered in . The results presented in , that the area of vegetation land decreased by 388.7 km2 (5.3%), and the annual rate of change was 13 km2/year, while the barren land area increased by 238.1 km2, for a total of 238.1 km2, or 2.7%. The grassland area expanded from 336.0 km2 in 1990 to 419.3 km2 in 2020 by 83.3 km2, with an annual change rate of 2.8 km2/year. Similarly, the built-up area expanded from 11.8 km2 in 1990 to 76.2 km2 in 2020, bringing the total built-up area to 64.4 km2, a growth of 1.04%. Furthermore, the waterbody increased by 2.5 km2, from 1.3 to 3.8 km2, at an annual rate of change of 0.08 km2/year.
Figure 5. Dynamics of LULC change in Ibb city in the years 1990, 2005, and 2020.
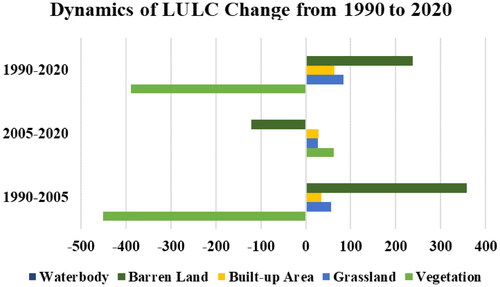
3.3. Transition probability matrix of LULC
As can be observed in that during (1990–2005), out of 2766.9 km2 of barren land, it remained unchanged. While in 2005, it was converted into vegetation land, grassland land, and built-up area with an area of 239.8, 180.1, and 2.9 km2, respectively. The vegetation area of 889.8 km2 from 1760.4 km2 remained unchanged in 1990, while the 870.6 km2 was altered in 2005, with a larger area converted to barren land (740.6 km2), 94.9 km2 to grassland, conversion the rest is the built-up area an area of up to 34.9 km2 and a water body with an area of 0.3 km2. Moreover, the grassland has been converted to barren land with an area of 40.0 km2 and a built-up area of 7.3 km2, while 221.0 km2 out of 336.0 km2 has been converted to other types in 2005, at the same time 114.9 km2 remained unchanging. The greatest change was in vegetation land with an area of 173.7 km2, followed by barren land with an area of 40.0 km2, built-up area (7.3 km2), and the least change was to a waterbody, recording 0.01 km2. During this time frame, only 1.2 km2 of the 1.3 km2 waterbody remained unchanged over the period 1990–2005; however, 0.3 km2 has been converted into a built-up area, as depicted in . This indicates the indiscriminate construction of water basins as a result of the government’s absence role in preventing it. The built-up area has increased, and its main source being vegetation and grassland. The main reason is that with the trend of population growth and urbanization, the demand for construction land has increased, and a large amount of vegetation land and grassland has been occupied.
The results in presented that during (2005–2020), barren land remained unchanged by 3376.2 km2 in 2005, while 173.0 km2 was converted in 2020 into vegetation land and covered an area of 144.5 km2, including 13.5 km2 into grassland, 12.9 km2 to the built-up area, and 2.1 km2 into the water body. In 2005, the vegetation land of 123.0 km2 was converted to grassland by 56.6 km2, the built-up area by 42.0 km2, and barren land by 23.8 km2, while 1185.7 km2 remained unchanged in 2020. Out of 392.3 km2 of grassland in 2005, only 336.4 km2 remained unchanged, while 55.9 km2 changed, of which 23.7 km2 was vegetation land, 18.9 km2 was barren land, and 13.1 km2 was built-up area.
As can be seen from , although the built-up area increased steadily during this period, 7.3 km2 remained unchanged in 2005, while 39.9 km2 has been changed to other classes, including vegetation land, barren land, and grassland, with an area of 17.8, 9.7, and 12.4 km2, respectively. The waterbody of 0.9 km2 remained unchanged in 2005, which is equivalent to the type being converted into a built-up area as a result of the main drivers, which include population growth, economic development, and policy drivers.
The results in showed during (1990–2020) that out of the total vegetation land of 1760.4 km2, 521.9 km2 (29.6%) underwent changes to other classes, while 1238.1 km2 (70.4%) remained unchanged. The most substantial conversion was the transformation of 338.6 km2 (19.2%) of vegetated land into barren land. Other changes included 136.7 km2 (7.8%) to grassland, 45.4 km2 (2.6%) to built-up areas, and 1.2 km2 (0.1%) to waterbody. Regarding the built-up areas, out of 11.8 km2 of built-up areas in 1990, 4.4 km2 remained unchanged, while 7.6 km2 was converted to other classes in 2020. In all, 3.4 km2 (28.8%) has been converted to vegetation land, while 2.3 km2 (19.5%) became grassland, and 1.7 km2 (14.4%) turned into barren land. In 1990, the barren land with an area of 3074.4 km2 remained unchanged. However, by 2020, out of a total area of 116.1 km2, 97.5 km2 (84.1%) had been converted to vegetation land, 9.5 km2 (8.2%) had become grassland, and 7.9 km2 (6.8%) transformed into built-up areas.
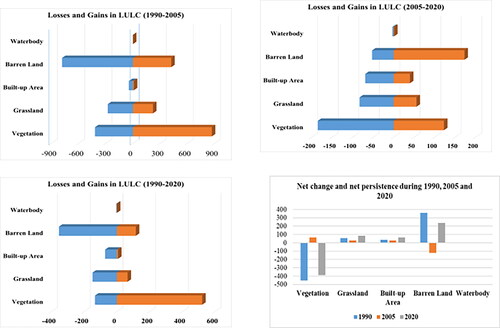
During this period, out of the 336.0 km2 in 1990, 270.6 km2 of grassland remained intact and 65.4 km2 became other land types. By 2020, 18.1 km2 had become a built-up area, 32.7 km2 had been converted into vegetation land, and 13.9 km2 was transitioned into barren land, as shown in . Meanwhile, 0.4 km2 of waterbody had been converted to built-up area and grassland by 0.2 km2, while only 0.7 km2 remained the same. and in this study demonstrate the gains, losses, and net changes for each type of LULC (km2) over the study periods.
Figure 6. Gains, losses, and net change area of LULC class between 1990 and 2020.
3.4. Drivers of LULC change and their impacts
Our results through the analysis of the past 30 years showed that the eco-environment had seriously deteriorated before 2005, which was mainly reflected in the continuous degradation of vegetation land and the rapid expansion of barren land. Since 2005, the eco-environment has improved due to some environmental restoration projects implemented by some organizations in the region. Referring to the natural features of the study area and the results of the field investigation, the main factors influencing LULC change include proximate and underlying drivers.
3.4.1. Proximate driver
Livestock grazing and animal husbandry on natural rangeland are activities practiced by the population in some areas. To increase income, farmers, and herdsmen continue to increase the number of livestock, resulting in serious degradation of the grassland. Consequently, desertification resulting from overgrazing is widespread in the areas of winter and spring grazing. Therefore, the study showed that the prohibition of overgrazing has a significant influence on LULC change in grassland ecosystems.
According to interviews with some of the respondents, it was revealed that ∼80% of the total participants realized that the intensification of human activities has a significant impact on changes in land uses in the region. There are other human activities that drive LULC, such as agricultural activity, which is the main activity of the population, as the city’s crop production constitutes (5.6%) of the total production in Yemen. In addition to traditional handicrafts and clay mineral extraction.
3.4.2. Underlying driver
3.4.2.1. Regional climate changes
According to data obtained from meteorological services, the microclimate in the region has been determined by the average value of climatic factors, which include precipitation and temperature as the most important climatic factors in the region. shows that the average annual temperature changed during 1990–2020. The average temperature has risen by 0.25 °C per decade, the highest average in the region, resulting in a decline in biodiversity and vegetation cover. Although annual precipitation did not show any significant changes in the early 1990s, during the 2000s it was close to the multi-year average, reaching the highest mean value in 2005, then again in 2020, and much lower in 2010. Secondly, the annual precipitation fluctuated significantly in different years; For example, the precipitation in 1990 was 700 mm, while the average rainfall in 2005 was more than 900 mm, and then gradually decreased until it reached more than 700 mm again in 2010. The decrease in rainfall led to a water deficit, which was one of the most important factors in the degradation of agricultural land and the increase of barren land during the period 1990–2000. Changes in climatic factors have a significant impact on regional food supply, material supply, climate regulation, water resource protection, soil composition, material circulation, biodiversity, landscape aesthetics, etc.
Figure 7. Total annual trends of rainfall and average annual maximum and minimum temperature.
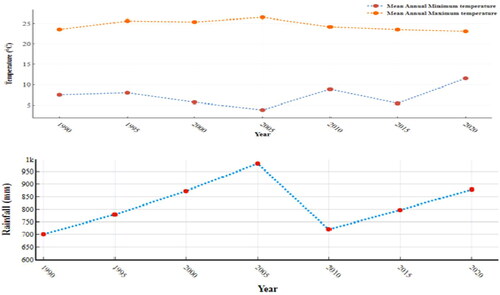
The factors driving LULC change are interconnected. Among these factors, the difference in high and low temperatures degrades soil and local vegetation and causes a series of ecological environmental problems.
3.4.2.2. Population growth and urbanization
The effect of population on LULC changes is mainly reflected in spatial differentiation and temporal changes in LULC (Cui et al. Citation2023). The results in show that during the periods 1990–2005 and 2005–2020, the population of the region showed an increasing trend due to an annual rate of 4.5 and 4.4%, respectively. However, since 2015, it has witnessed population overcrowding after the outbreak of war and the continuous influx of displaced people from other cities, which led to demographic changes and the phenomenon of urban encroachment on plant lands. The area built on vegetable land increased by 8% during the period 1990–2020. Urbanization is mainly manifested in the increase in non-agricultural urban population. As the urbanization process accelerated, rural residents migrated to urban areas for work. In addition to the return of migrants after the Gulf War, the non-agricultural population increased and fundamentally changed the country’s economic structure, social structure, mode of production, and way of life. The increase in the non-agricultural population led to a decrease in the proportion of agricultural GDP in the region, as it decreased by 7.4% in 2020 compared to 1990.
Table 6. Population of Ibb city (source: CSO).
3.4.2.3. National policies and institutions
Through information obtained from secondary data and interview data, this study revealed that 8% of all participants realize that lack of clarity on the role of government policies, agriculture sector policies, and land use initiatives has affected land and land use change in the region. In addition, there is no system for registering land titles and documents in some areas.
3.4.2.4. Agricultural technology advancement
Agricultural technology has recently played a major role in land use in the region. Most of the respondents’ results indicated that it has a positive and negative role, as its positive role includes the use of tillage machines and tractors, while the negative role includes the use of fertilizers that are harmful to the soil. It leads to soil degradation and the expansion of barren lands, but sometimes due to the topography, some rural areas cannot benefit from agricultural technology.
3.5. CA-Markov model reliability validation
The process of predicting the classes of future land uses is an indispensable condition for the use of transformation rules in the model. The simulated 2020 LULC image was validated by comparing the area of each land type in the simulation results to the actual area to assess their quantitative accuracy based on total products (omission errors), users (commission errors), and kappa statistics (). The Kappa Index measures the accuracy of the simulation between the model and the actual map. This is widely used to evaluate the ability of the model to simulate the spatio-temporal patterns of LULC change. We took the LULC data in 2005 as a base period, imported the LULC change probability matrix and the appropriate atlas during the period 1990–2005, and chose the number of cycles 15 years for our LULC map modeling for the year 2020. The results showed an overall accuracy of 85.5% and a Kappa coefficient index of 0.80 between the actual LULC and the simulated LULC maps of 2020, which is a good agreement according to Dey et al. (Citation2021).
Table 7. Validation of LULC change predictions.
This shows that the CA-Markov model has high accuracy to simulate future LULC changes in the study area based on pre-processed data and factors that have an impact on land use changes, such as natural, social, and economic policies. To reduce randomness in the simulation process, this study defines conversion rules for land use types along with influencing factors, such as natural conditions, planning policies, climate change, the eco-environment, and other influencing factors. The validation process also included evaluating the compatibility between two maps (simulated and actual) in terms of the quantity and location of pixels in each LULC type.
The result showed that the validation unit includes five statistical coefficients for kappa: kappa no (Kno) with a value of 0.9132, kappa no (Klocation) with a value of 0.8943, kappa location strata (Klocation Strat) with a value of 0.9304, and standard kappa (Kstandard) with a value of 0.8426, as indicated in . The analysis of the agreement and disagreement components between the simulated and actual LULC map for 2020 indicates that the model exhibits a high level of accuracy. Specifically, it correctly predicts the grid cell allocation with an accuracy of 48.35%, and accurately projects the amount of LULC change with an agreement rate of 23.62%. On the contrary, there are some instances of disagreement, with 7.78% of grid cells and 5.73% of the LULC change quantity falling into this category. With some similar kinds of agreement and disagreement results, Asif et al. Citation2023 indicated that the CA-Markov could be taken as a successful model in the prediction of LULC change. Moreover, we conducted a validation to ascertain the significance of the association between actual and simulated LULC values for each category in 2020, employing the Chi-Square (χ2) test. The observed LULC values for each category were considered as ‘A’, while the LULC values computed through the Markov model were taken as ‘B’. Subsequently, χ2 was calculated utilizing the formula as indicated in . The results yielded a χ2 value of 26.87 for a degree of freedom (df) equal to 7. This value was obtained from the chi-square distribution table. By utilizing an online calculator found at https://www.socscistatistics.com/pvalues/chidistribution.aspx, we computed the resulting p-value, which turned out to be 0.04. This was assessed at a significance level of 0.01. The obtained p-value suggests that there is no significant difference, indicating a statistical correlation between the actual LULC data for 2020 and the simulated LULC data for the same year for the respective LULC types. This indicates that the model was valid.
Table 8. The k-indicator values of LULC predicted map of 2020.
3.6. Prediction of LULC change
The future LULC change predictions for 2035 and 2050 were obtained, followed by the same method used to predict LULC change for 2020. The time surveyed of forecast accounted for 30 years starting from 2020 to 2050 at intervals of 15 years. As the final stage of the study, the simulated future LULC images were revealed in , and the area and proportion of land use types were counted each year, as displayed in .
Figure 8. Predicted distribution of the modeled LULC of 2035 and 2050.
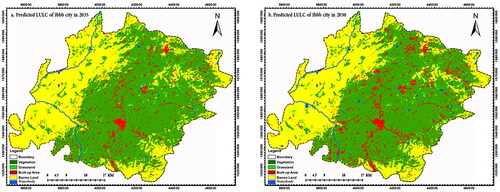
Table 9. Statistical distribution of LULC simulations under different modeled 2035 and 2050.
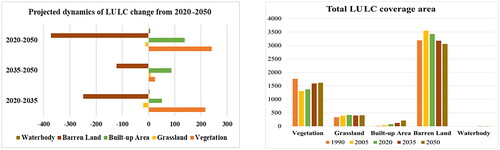
Compared with 2020, the prediction results in 2035 have noticeable local changes, indicating that various classes of land will tend to be saturated in 2035. The vegetation land, grassland, and barren lands are predicted to decrease by 36.8, 10.8, and 249.3 km2, a decrease of 2.6, 0.2, and 0.1%, respectively. In comparison, the built-up area is expected to increase by 50.2 km2, an increase of 1.0%. Due to the fast-growing population in Ibb city mainly caused by rural–urban migration and IDPs, the future scenarios need to take into account economic development and technologies as reasons for the rapid growth of built–up land.
The volume of water bodies In an area of 1.6 km2 increased by 0.1% as a result of the expansion of dams and water barriers, according to the future plan prepared by the Water Resources Office in the city. Over the period 2035–2050, the areas of vegetation, grasslands, and barren lands are predicted to continue to decline, reaching 1286.7, 397.6, and 3423.7 km2, respectively. While the built-up area is predicted to increase from 126.4 km2 in 2035 to 184.7 km2 in 2050, representing a rate of change of 58.3 km2 (1.7%), the waterbody increased by 1.9 km2, an increase of 0.04%. The increase in the built-up area still came mainly from vegetation land and grassland in the forecast years. The increase in water area is mainly due to the fact that the region needs to develop water conservation facilities. The LULC change prediction study by Rendana et al. (Citation2015) revealed that agricultural land in the tropical catchment of Cameron Highland, Malaysia will increase by 12.24%, which is in agreement with our study.
In the prediction year, cultivated and barren lands are still the main types of land use, and the sum of the two areas is 88.7% of the total area. The difference is that the development of cultivated land will be relatively unstable in the future. Compared with 2020, the area of cultivated land will decrease to 1286.7 km2 in 2050, accounting for a decrease of 3.6% in the total area. The main reason for this was the transformation of the barren lands and a built-up area. The development trend of the rest of the land types is consistent with the simulation trend of natural development scenarios. Built-up land and waterbody still show an increasing trend, and the growth trend of built-up land is more obvious. Compared to 2020, the simulation results in 2050 represented an increase in the percentage of built-up land from 1.4 to 2.7%. The built-up land showed a relatively upward trend compared to vegetation land and grassland, which decreased sharply under this scenario, until 2050, when it decreased to 24.2 or 7.5% of the total area. In general, the increase or decrease of LULC change is provided in .
Figure 9. Gain, loss, and net change of the projected LULC area (2020, 2035, and 2050).
Regarding the land distribution pattern, the two scenarios are basically the same, and the changes in the above land use types are more consistent with the future socio-economic development of the study area and the policy orientation towards strict protection of cultivated land. Illustration of the area covered by the five LULC classes over the past 30 years (1990, 2005, and 2020) and prediction years (2035 and 2050), as depicted in .
Figure 10. Historical and predicted LU/LC change area coverage.
4. Discussion
The main purpose of this study was to analyze and explore the spatiotemporal characteristics of LULC changes along with the mechanical driving force in Ibb city. The dynamics of LULC change in the study area were predicted using land use data, topography data, and socioeconomic data. The CA-Markov model has been used to predict the dynamics of land use in 2035 and 2050, and validate the model’s model to predict the future land use pattern (Abijith and Saravanan Citation2022). The CA-Markov simulation model is a mainstream analytical tool for the future pattern of LULC change (Edan et al. Citation2021). It integrates both the Cellular Automata filter and the Markov chain by enhancing spatial configuration results of Markov chain analysis prediction to effectively simulate future LULC changes (Kafy et al. Citation2021). In most of the recent studies, the application of the CA-Markov model to predict LULC variation has become popular. For example, Dey et al. (Citation2021) used it to simulate future LULC change in Rajshahi, Bangladesh, and Tariq and Shu (Citation2020) predict land-use pattern changes in Faisalabad District in Pakistan; Tariq and Mumtaz (Citation2023b) Simulating land use and cover change in Peshawar, Khyber Pakhtunkhwa Province, Pakistan; and Rendana et al. (Citation2015) simulation of LULC change in a tropical watershed in the Cameron Highlands, Malaysia. The applicability of this model is that it incorporates biophysical and socioeconomic factors that drive LULC changes during prediction and simulation. The CA-Markov model was tested for its validity and applicability in this study. The results showed an overall accuracy of 85.5% and a kappa index of 0.80 between the actual LULC maps and the 2020 simulated LULC maps. The results were in good agreement according to Khwarahm et al. (Citation2021), which indicates that there is high reliability and applicability of the CA-Markov model to simulate future LULC changes in Ibb city. Therefore, we believe that the CA-Markov model is valid and reliable for future LULC simulations, and the results of these simulations are useful to natural resource managers and policymakers as it provides insight implications from local and regional perspectives.
According to the current study’s findings, a substantial proportion of other land use classes have been transformed into urban land, indicating that the study area’s rapid social and economic development would increase rapid urbanization. The natural land cover would likely deteriorate due to the current tendency of changing LULC due to the built-up area, as a result, of the farmer’s desire to improve his financial position when comparing what he earns from the land with what he earns after building on it. Therefore, it led to the establishment of random settlements in large parts of the city with unacceptable housing standards, which caused the spread of some diseases and epidemics (Koko et al. Citation2020). Although the Yemeni government banned construction on agricultural land in the 1990s and placed directional signs in all places where construction has been prohibited, these laws faded in the early 2000s. Consequently, to achieve SDG 11 by balancing urbanization and protection of the natural environment in Ibb city, the land administration may need to strengthen land supervision, legislate laws to resolve land disputes, revitalize a land registration system, and supervise regional development as well as prevent the illegal transformation of farmland into construction land (Singh et al. Citation2022). The study indicates that the most prominent problem facing cultivation is the tendency of many farmers to plant the khat tree (a narcotic plant), as a result of the continuous increase in the number of users, which leads to the depletion of groundwater. Therefore, there may be a need to implement the integrated program previously prepared by the government to reduce the demand for khat, which includes raising public awareness and education about its harmful effects and expanding its replacement with other crops (Alukah et al. Citation2008).
The results In indicate that rapid population growth is one of the main drivers of LULC, which has been on a gradual increase from 1990 to 2020. In the next few years, we expect an increase of about 4.2–5%, and the increasing trend is not clear due to its geographic location and IDPs. Therefore, the pressure placed on the area will continue to increase, and it is anticipated that converted into built-up land to meet the population’s increasing need for housing (Arfasa et al. Citation2023). Certainly, economic development has ushered in shifts in societal perspectives and technological advancements. These changes are poised to influence land usage due to unforeseen investments, ultimately contributing to the exhaustion of natural resources in the area. Moreover, shifts in the technological aspects of industrial infrastructure have prompted alterations in how resources are employed, strategies adopted, efficiency levels, and resource priorities. These technological shifts are set to play a pivotal role in shaping land cover dynamics (Avtar et al. Citation2019). On the other hand, the findings of the change in GDP show that relatively significant and has clear time-stage characteristics. During 1990–2005, the study area’s GDP growth rate was relatively slow, but over the period 2005–2010, the GDP growth rate began to show a relatively large increase, reaching the highest value of 7.7% in 2010. Over 2011–2015, the GDP entered a rapid decline period of 28% due to the so-called Arab Spring revolution. Despite the collapse of the population economy in 2015 AD as a result of the ongoing sectarian conflicts, the real estate sector in Ibb city, in particular, is witnessing a significant recovery, as politicians, displaced persons, and businessmen compete to buy real estate, which prompted many residents to sell their lands, and vegetation land in the suburbs quickly converting into built-up land. Generally, the vegetation land and grassland would likely deteriorate due to the existing tendency of changing GDP and population, displaying a substantial negative correlation (Zhong et al. Citation2020). In addition, although the urbanization expansion taking place in the city and the conversion of cultivated and grassland into built-up lands in the recent period, cultivated lands are still the second largest in terms of area after barren lands. This is probably due to the effect of a recent policy implemented by the government which promoted local farmers to increase agricultural production.
One of the main long-term causes of LULC change is terrain have an effect as the southern and western part of the city is surrounded by mountains and hills, has few arable fields, and little food that cannot be self-sufficient; The villages are small in size, with low distribution density, limited potential, and medium to low economic development. In addition, other factors including, climatic factors (Msofe et al. Citation2019). As mentioned earlier, the area has recently experienced a notable shortage of rainfall. This could potentially have a substantial impact on various aspects, including the progression of local vegetation succession, soil development, the complexity of construction projects, and the overall suitability for habitation. Consequently, it is recommended to achieve SDG13 by continuing the construction of water barriers and implementing the plan prepared by the city’s water resources office to conserve rainwater, some of which organizations have begun to implement.
The natural land cover is likely to be degraded due to the current trend of changing LULC due to overgrazing. In addition, the increase in livestock occupies the habitats of wild animals, which leads to the deterioration of the ecological environment, the destruction of the living spaces of wild animals, and a decrease in biodiversity. Therefore, it is possible that an ecological resettlement project, which can alter environmental degradation and soil erosion caused by overgrazing, as well as improve the living conditions of low-income farmers, could be actively promoted (Gondwe et al. Citation2021). Policy factors are not easy to be quantitatively analyzed, but they are significantly affected by natural, socioeconomic, and other factors, and have a mandatory effect on regional LULC changes. The driving force of land use changes on a short time scale is mainly the location construction factor and the socioeconomic factor, while natural factors have a fundamental long-term impact. These factors are interdependent and have both direct and indirect effects on land cover change, and each factor is compensatory and irreplaceable (Zhu Z et al. Citation2022). Governments at all levels should increase their investment in funds, science, and technology in the area, improve infrastructure, and especially strengthen the professional training of technical personnel so that they can control relevant laws and policies. On the other hand, relevant government departments should speed up the promulgation and implementation of laws on sustainable land use management so that resource protection and management can be fundamentally guaranteed. Local administrative regions should also formulate effective management measures, build administrative institutions following the law, strictly enforce the law, and provide legal guarantees for the management of sustainable land use. These expectations are consistent with the previous studies in Iraq, which revealed the social, economic, and environmental factors that greatly affected the projected growth and development of the built-up areas (Al-Hameedi et al. Citation2021; Edan et al. Citation2021; Khwarahm Citation2021; Khwarahm et al. Citation2021), Ghana (Arfasa et al. Citation2023), Pakistan (Tariq and Shu Citation2020; Tariq et al. Citation2023; Tariq and Mumtaz Citation2023a, Citation2023b), and Bangladesh (Dey et al. Citation2021; Kafy et al. Citation2021, Citation2022). This study not only addresses the specific characteristics of the study area and the availability of relevant RS and auxiliary data but also incorporates an analysis of SDGs 11, 15, and 17, which could provide technical support to land-use planners, policy, and decision-makers to achieve sustainable land use planning.
Although the present study effectively predicted LULC for the years 2035 and 2050, it lacks an examination of LULC change and its effects in geospatial analysis as well as the relationship between land cover and ecosystem changes. Therefore, the focus of future research will be on the impact of LULC change on geospatial; As well as the relationship between vegetation cover and changes in the ecosystem to obtain a comprehensive understanding of the dynamics of change in land use and its area in the long term and its effects on achieving sustainable development.
5. Conclusion
This study used Landsat5,7 TM’s 1990–2005 Landsat8 OLI satellite images from 2020 to employed to derive LULC maps, which were further used in the CA-Markov process to successfully predict the future LULC change in Ibb city. The results revealed the five main types of land use are agricultural land, barren land, grassland, waterbody, and built-up land. Across the period 1990–2020, the types of land use in the study area were mainly cultivated and barren land, which together accounted for more than 80% of the total area. Despite this, the general trend of construction land area continues to increase, while cultivated land and grassland are relatively less. The area of vegetation land is relatively limited; thus, it is necessary to set a red line to protect cultivated land. This involved quantifying the changes and predicting the future spatial-temporal LULC change over 30 years using the CA-Markov model in the IDRIS module integrated into the TerrSet software 2020, making use of historical land use maps from 1990, 2005, and 2020. To validate the model, we compared the projected LULC Map for 2020 with the actual 2020 Map. After successful validation, we have generated LULC maps for the years 2035 and 2050. The model validation results showed that the LCM effectively predicted the future LULC state of the study area with an accuracy exceeding 85.2%, exceeding the minimum acceptable level of accuracy. The result of the prediction of LULC change indicates that built-up area and waterbody will continue to increase by 2.7 and 0.13%, respectively, over the period 2020–2050, while agricultural land, grassland, and barren land will decrease by 3.6, 0.4, and 0.2%, respectively. This study found natural factors have a fundamental and long-term impact on land changes, while locational construction factors and socioeconomic factors are the main driving forces affecting land changes on a short time scale. This study’s findings have a certain reference significance for the rational planning and management of land resources in the study area, which may help city planners and other local authorities efficiently manage land use and maintain complex dynamics to achieve sustainable land use planning.
Consent to publish
All authors of a manuscript have read and agreed to the published version before it is submitted for publication.
Author contributions
Abdulkarem Qasem Dammag: collected and analyzed data, performed the analysis and computations, prepared the figures and tables, reviewed the drafts, and approved the final version. Dai Jian: performed the analysis and computations, prepared the figures and tables, reviewed the drafts, and approved the final version. Guo Cong: reviewed and edited the drafts. Basema Qasim Derhem: prepared the figures and tables, reviewed the drafts, and approved the final version. Hafiza Zara Latif: reviewed and edited the drafts.
Disclosure statement
No potential conflict of interest was reported by the author(s).
Data availability statement
The data presented in this study are available from the corresponding author (B.Q.D.) upon request.
Additional information
Funding
References
- Abijith D, Saravanan S. 2022. Assessment of land use and land cover change detection and prediction using remote sensing and CA Markov in the northern coastal districts of Tamil Nadu, India. Environ Sci Pollut Res Int. 29(57):86055–86067. doi: 10.1007/s11356-021-15782-6.
- Al-Darwish Y, Ayad H, Taha D, Saadallah D. 2018. Predicting the future urban growth and it’s impacts on the surrounding environment using urban simulation models: case study of Ibb city – Yemen. Alexandr Eng J. 57(4):2887–2895. doi: 10.1016/j.aej.2017.10.009.
- Al-Hameedi WMM, Chen J, Faichia C, Al-Shaibah B, Nath B, Kafy AA, Hu G, Al-Aizari A. 2021. Remote sensing-based urban sprawl modeling using multilayer perceptron neural network Markov chain in Baghdad, Iraq. Rem Sens. 13(20):4034. doi: 10.3390/rs13204034.
- Aljenaid SS, Kadhem GR, AlKhuzaei MF, Alam JB. 2022. Detecting and assessing the spatio-temporal land use land cover changes of Bahrain Island During 1986–2020 using remote sensing and GIS. Earth Syst Environ. 6(4):787–802. doi: 10.1007/s41748-022-00315-z.
- Al-Mashreki MH, Akhir JBM, Rahim SA, Desa KM, Rahman ZA. 2010. Remote sensing and GIS application for assessment of land suitability potential for agriculture in the IBB governorate, the Republic of Yemen. Pak J Biol Sci. 13(23):1116–1128. doi: 10.3923/pjbs.2010.1116.1128.
- Al-Shalabi M, Billa L, Pradhan B, Mansor S, Al-Sharif AAAA. 2013. Modelling urban growth evolution and land-use changes using GIS based cellular automata and SLEUTH models: the case of Sana’a metropolitan city, Yemen. Environ Earth Sci. 70(1):425–437. doi: 10.1007/s12665-012-2137-6.
- Alukah S, Islamic T, Magazine F, Visits AH, Ghanem N, Committee E, Parliament Y, Parliament Y, Yemeni T, Council GC. 2008. A bill banning khat in Yemen. p. 22–23.
- Álvarez AC. 2023. Monitoring land cover changes using Landsat data and maximum likelihood classification: a case study of Hanoi, Vietnam.
- Arfasa GF, Owusu-Sekyere E, Doke DA. 2023. Predictions of land use/land cover change, drivers, and their implications on water availability for irrigation in the Vea catchment, Ghana. Geocarto Int. 38(1):1–24. doi: 10.1080/10106049.2023.2243093.
- Arnous MO, El-Rayes AE, Geriesh MH, Ghodeif KO, Al-Oshari FA. 2020. Groundwater potentiality mapping of tertiary volcanic aquifer in IBB basin, Yemen by using remote sensing and GIS tools. J Coast Conserv. 24(3):1–20. doi: 10.1007/s11852-020-00744-w.
- Asif M, Kazmi JH, Tariq A, Zhao N, Guluzade R, Soufan W, Almutairi KF, Sabagh AE, Aslam M. 2023. Modelling of land use and land cover changes and prediction using CA-Markov and Random Forest. Geocarto Int. 38(1):1–18. doi: 10.1080/10106049.2023.2210532.
- Asokan A, Anitha J. 2019. Change detection techniques for remote sensing applications: a survey. Earth Sci Inform. 12(2):143–160. doi: 10.1007/s12145-019-00380-5.
- Avtar R, Tripathi S, Aggarwal AK. 2019. Population – urbanization – energy nexus: a review. p. 1–21.
- Berndes G. 2011. Bioenergy, land use change and climate change mitigation – background technical report. Report for Policy Advisors and Policy Makers IEA Bioenergy: ExCo. 3:1–62.
- Biswas M, Banerji S, Mitra D. 2020. Land-use–land-cover change detection and application of Markov model: a case study of eastern part of Kolkata. Environ Dev Sustain. 22(5):4341–4360. doi: 10.1007/s10668-019-00387-4.
- Capolupo A, Monterisi C, Tarantino E. 2020. Landsat Images Classification Algorithm (LICA) to automatically extract land cover information in Google Earth Engine environment. Rem Sens. 12(7):1201. doi: 10.3390/rs12071201.
- Cui J, Ji W, Wang P, Zhu M, Liu Y. 2023. Spatial–temporal changes in land use and their driving forces in the circum-Bohai coastal zone of China from 2000 to 2020. Rem Sens. 15(9):2372. doi: 10.3390/rs15092372.
- Dammag AQ, Dai J, Cao S, Alabsi AA, Derhem BQ, Latif HZ. 2023. Sustainable planning strategies for rural land use using a hybridized technique and GIS: application to an Nijād Village in Ibb City, Yemen. J Urban Plann Dev. 149(1):5022052. doi: 10.1061/(ASCE)UP.1943-5444.0000893.
- Darem AA, Alhashmi AA, Almadani AM, Alanazi AK, Sutantra GA. 2023. Development of a map for land use and land cover classification of the Northern Border Region using remote sensing and GIS. Egypt J Rem Sens Space Sci. 26(2):341–350. doi: 10.1016/j.ejrs.2023.04.005.
- de Souza JM, Morgado P, da Costa EM, de Novaes Vianna LF. 2022. Modeling of LAND USE AND LAND COVER (LULC) change based on artificial neural networks for the Chapecó River Ecological Corridor, Santa Catarina/Brazil. Sustainability. 14(7):4038. doi: 10.3390/su14074038.
- Dede M, Asdak C, Setiawan I. 2021. Spatial dynamics model of land use and land cover changes: a comparison of CA, ANN, and ANN-CA. Regist J Ilm Teknol Sist Inf. 8(1):38–49. doi: 10.26594/register.v8i1.2339.
- Dey NN, Al Rakib A, Kafy AA, Raikwar V. 2021. Geospatial modelling of changes in land use/land cover dynamics using multi-layer perception Markov chain model in Rajshahi City, Bangladesh. Environ Chall. 4(May):100148. doi: 10.1016/j.envc.2021.100148.
- Edan MH, Maarouf RM, Hasson J. 2021. Predicting the impacts of land use/land cover change on land surface temperature using remote sensing approach in Al Kut, Iraq. Phys Chem Earth. 123(April):103012. doi: 10.1016/j.pce.2021.103012.
- Faichia C, Tong Z, Zhang J, Liu X, Kazuva E, Ullah K, Al-Shaibah B. 2020. Using RS data-based CA–Markov model for dynamic simulation of historical and future luck in Vientiane, Laos. Sustainability. 12(20):8410. doi: 10.3390/su12208410.
- Fonte CC, See L, Laso-Bayas JC, Lesiv M, Fritz S. 2020. Assessing the accuracy of land use land cover (LULC) maps using class proportions in the reference data. ISPRS Ann Photogramm Rem Sens Spatial Inf Sci. 3(3):669–674. doi: 10.5194/isprs-annals-V-3-2020-669-2020.
- Gebeyehu AK, Snelder D, Sonneveld B. 2023. Land use-land cover dynamics, and local perceptions of change drivers among Nyangatom agro-pastoralists, Southwest Ethiopia. Land Use Policy. 131(May):106745. doi: 10.1016/j.landusepol.2023.106745.
- Gómez C, White JC, Wulder MA. 2016. Optical remotely sensed time series data for land cover classification: a review. ISPRS J Photogramm Rem Sens. 116:55–72. doi: 10.1016/j.isprsjprs.2016.03.008.
- Gondwe JF, Lin S, Munthali RM. 2021. Analysis of land use and land cover changes in urban areas using remote sensing: case of Blantyre City. Discrete Dyn Nat Soc. 2021:1–17. doi: 10.1155/2021/8011565.
- Guarderas P, Smith F, Dufrene M. 2022. Land use and land cover change in a tropical mountain landscape of northern Ecuador: altitudinal patterns and driving forces. PLOS One. 17(7):e0260191. doi: 10.1371/journal.pone.0260191.
- Hamad R, Balzter H, Kolo K. 2018. Predicting land use/land cover changes using a CA-Markov model under two different scenarios. Sustainability. 10(10):3421. doi: 10.3390/su10103421.
- http://www.cso.gov.ye. 2020. No title.
- https://weatherspark.com. 2020. Average-weather-in-Ibb-Yemen-year-round.
- Jamal J, Zaki NAM, Talib N, Saad NM, Mokhtar ES, Omar H, Latif ZA, Suratman MN. 2022. Dominant tree species classification using remote sensing data and object-based image analysis. IOP Conf Ser Earth Environ Sci. 1019(1):012018. doi: 10.1088/1755-1315/1019/1/012018.
- Kafy AA, Naim MNH, Subramanyam G, Faisal AA, Ahmed NU, Rakib AA, Kona MA, Sattar GS. 2021. Cellular automata approach in dynamic modelling of land cover changes using RapidEye images in Dhaka, Bangladesh. Environ Chall. 4(January):100084. doi: 10.1016/j.envc.2021.100084.
- Kafy AA, Saha M, Faisal AA, Rahaman ZA, Rahman MT, Liu D, Fattah MA, Al Rakib A, AlDousari AE, Rahaman SN, et al. 2022. Predicting the impacts of land use/land cover changes on seasonal urban thermal characteristics using machine learning algorithms. Build Environ. 217(March):109066. doi: 10.1016/j.buildenv.2022.109066.
- Khwarahm NR, Najmaddin PM, Ararat K, Qader S. 2021. Past and future prediction of land cover land use change based on earth observation data by the CA–Markov model: a case study from Duhok governorate, Iraq. Arab J Geosci. 14(15):1–14. doi: 10.1007/s12517-021-07984-6.
- Khwarahm NR. 2021. Spatial modeling of land use and land cover change in Sulaimani, Iraq, using multitemporal satellite data. Environ Monit Assess. 193(3):148. doi: 10.1007/s10661-021-08959-6.
- Koko AF, Yue W, Abubakar GA, Hamed R, Alabsi AAN. 2020. Monitoring and predicting spatio-temporal land use/land cover changes in Zaria City, Nigeria, through an integrated cellular automata and Markov chain model (CA-Markov). Sustainability. 12(24):10452. doi: 10.3390/su122410452.
- Kumar KS, Bhaskar PU, Padmakumari K. 2012. Estimation of land surface temperature to study urban heat island effect using Landsat Etm + Image. Int J Eng Sci Technol. 4(02):771–778.
- Kumar S, Arya S. 2021. Change detection techniques for land cover change analysis using spatial datasets: a review. Rem Sens Earth Syst Sci. 4(3):172–185. doi: 10.1007/s41976-021-00056-z.
- Lamichhane S, Shakya NM. 2021. Land use land cover (LULC) change projection in Kathmandu Valley using the CLUE-S model. J Adv Coll Engin Mgt. 6:221–233. doi: 10.3126/jacem.v6i0.38361.
- Lu X, Zhang Y, Lin C, Wu F. 2021. Analysis and comprehensive evaluation of sustainable land use in China: based on sustainable development goals framework. J Clean Prod. 310(April):127205. doi: 10.1016/j.jclepro.2021.127205.
- Mohammadpour P, Viegas C. 2022. Applications of multi‐source and multi‐sensor data fusion of remote sensing for forest species mapping. Advances in Remote Sensing for Forest Monitoring; p. 255–287.
- MohanRajan SN, Loganathan A, Manoharan P. 2020. Survey on land use/land cover (LU/LC) change analysis in remote sensing and GIS environment: techniques and challenges. Environ Sci Pollut Res Int. 27(24):29900–29926. doi: 10.1007/s11356-020-09091-7.
- Msofe NK, Sheng L, Lyimo J. 2019. Land use change trends and their driving forces in the Kilombero Valley Floodplain, Southeastern Tanzania. Sustainability. 11(2):505. doi: 10.3390/su11020505.
- Mushore TD, Mutanga O, Odindi J, Sadza V, Dube T. 2022. Pansharpened Landsat 8 thermal-infrared data for improved land surface temperature characterization in a heterogeneous urban landscape. Rem Sens Appl Soc Environ. 26(March):100728. doi: 10.1016/j.rsase.2022.100728.
- Nath B, Niu Z, Singh RP. 2018. Land use and land cover changes, and environment and risk evaluation of Dujiangyan city (SW China) using remote sensing and GIS techniques. Sustainability. 10(12):4631. doi: 10.3390/su10124631.
- Nath B, Wang Z, Ge Y, Islam K, Singh RP, Niu Z. 2020. Land use and land cover change modeling and future potential landscape risk assessment using Markov-CA model and analytical hierarchy process. ISPRS Int J Geo-Inform. 9(2):134. doi: 10.3390/ijgi9020134.
- Ray R, Das A, Hasan MSU, Aldrees A, Islam S, Khan MA, Lama GFC. 2023. Quantitative analysis of land use and land cover dynamics using geoinformatics techniques: a case study on Kolkata Metropolitan Development Authority (KMDA) in West Bengal, India. Rem Sens. 15(4):959. doi: 10.3390/rs15040959.
- Rendana M, Rahim SA, Idris WMR, Lihan T, Rahman ZA.,. 2015. CA-Markov for predicting land use changes in tropical catchment area: a case study in Cameron Highland, Malaysia. J Appl Sci. 15(4):689–695. doi: 10.3923/jas.2015.689.695.
- Republic of Yemen. 2016. National Report Habitat III. Third United Nations Conference on Housing and Sustainable Urban Development – HABITAT III; p. 1–67.
- Rigo R, Martin P, Verburg PH, Houet T. 2022. Contributions of local LUCC spatially explicit scenarios for water management: lessons learned from an ex-post evaluation. Futures. 139(November 2021):102937. doi: 10.1016/j.futures.2022.102937.
- Robinson P, Hestler A, As J. 2018. Yemen. Cavendish Square Publishing, LLC. books.google.com
- Sajan B, Mishra VN, Kanga S, Meraj G, Singh SK, Kumar P. 2022. Cellular automata-based artificial neural network model for assessing past, present, and future land use/land cover dynamics. Agronomy. 12(11):2772. doi: 10.3390/agronomy12112772.
- Singh B, Venkatramanan V, Deshmukh B. 2022. Monitoring of land use land cover dynamics and prediction of urban growth using land change modeler in Delhi and its environs, India. Environ Sci Pollut Res Int. 29(47):71534–71554. doi: 10.1007/s11356-022-20900-z.
- Som-Ard J, Atzberger C, Izquierdo-Verdiguier E, Vuolo F, Immitzer M. 2021. Remote sensing applications in sugarcane cultivation: a review. Rem Sens. 13(20):4040. doi: 10.3390/rs13204040.
- Tadese S, Soromessa T, Bekele T. 2021. Analysis of the current and future prediction. Sci World J. 2021:1–18. doi: 10.1155/2021/6685045.
- Tariq A, Mumtaz F, Majeed M, Zeng X. 2023. Spatio-temporal assessment of land use land cover based on trajectories and cellular automata Markov modelling and its impact on land surface temperature of Lahore district Pakistan. Environ Monit Assess. 195(1):114. doi: 10.1007/s10661-022-10738-w.
- Tariq A, Mumtaz F. 2023a. Modeling spatio-temporal assessment of land use land cover of Lahore and its impact on land surface temperature using multi-spectral remote sensing data. Environ Sci Pollut Res Int. 30(9):23908–23924. doi: 10.1007/s11356-022-23928-3.
- Tariq A, Mumtaz F. 2023b. A series of spatio-temporal analyses and predicting modeling of land use and land cover changes using an integrated Markov chain and cellular automata models. Environ Sci Pollut Res Int. 30(16):47470–47484. doi: 10.1007/s11356-023-25722-1.
- Tariq A, Shu H. 2020. CA-Markov chain analysis of seasonal land surface temperature and land use landcover change using optical multi-temporal satellite data of Faisalabad, Pakistan. Rem Sens. 12(20):3402. doi: 10.3390/rs12203402.
- Tariq A, Yan J, Mumtaz F. 2022. Land change modeler and CA-Markov chain analysis for land use land cover change using satellite data of Peshawar, Pakistan. Phys Chem Earth. 128(March):103286. doi: 10.1016/j.pce.2022.103286.
- Tilahun F. 2022. Impact of land use land cover change on soil erosion, watershed prioritization and farmer erception: The case of Mitka Watershed in Ethiopia [doctoral dissertation].
- Tuan NT. 2022. Urbanization and land use change: a study in Vietnam. Environ Socio-Econ Stud. 10(2):19–29. doi: 10.2478/environ-2022-0008.
- Wang Q, Wang H, Chang R, Zeng H, Bai X. 2022. Dynamic simulation patterns and spatiotemporal analysis of land-use/land-cover changes in the Wuhan metropolitan area, China. Ecol Modell. 464(November 2021):109850. doi: 10.1016/j.ecolmodel.2021.109850.
- Yesuph AY, Dagnew AB. 2019. Land use/cover spatiotemporal dynamics, driving forces and implications at the Beshillo catchment of the Blue Nile Basin, North Eastern Highlands of Ethiopia. Environ Syst Res. 8(1):1–30. doi: 10.1186/s40068-019-0148-y.
- Zhang K, Feng R, Han J, Zhang Z, Zhang H, Liu K. 2023. Temporal and spatial differentiation characteristics of ecosystem service values based on the ecogeographical division of China: a case study in the Yellow River Basin, China. Environ Sci Pollut Res. 30(3):8317–8337.
- Zhang L, Zhang X, Shao Z, Jiang W, Gao H. 2023. Integrating Sentinel-1 and 2 with LiDAR data to estimate aboveground biomass of subtropical forests in northeast Guangdong, China. Int J Digit Earth. 16(1):158–182. doi: 10.1080/17538947.2023.2165180.
- Zhang S, Yang P, Xia J, Wang W, Cai W, Chen N, Hu S, Luo X, Li J, Zhan C. 2022. Land use/land cover prediction and analysis of the middle reaches of the Yangtze River under different scenarios. Sci Total Environ. 833(April):155238. doi: 10.1016/j.scitotenv.2022.155238.
- Zhong X, Jiang X, Li L, Xu J, Xu H. 2020. The impact of socio-economic factors on sediment load: a case study of the Yanhe river watershed. Sustainability. 12(6):2457. doi: 10.3390/su12062457.
- Zhu Q, Guo X, Deng W, Shi S, Guan Q, Zhong Y, Zhang L, Li D. 2022. Land-use/land-cover change detection based on a Siamese global learning framework for high spatial resolution remote sensing imagery. ISPRS J Photogramm Rem Sens. 184(June 2021):63–78. doi: 10.1016/j.isprsjprs.2021.12.005.
- Zhu Z, Mei Z, Xu X, Feng Y, Ren G. 2022. Landscape ecological risk assessment based on land use change in the Yellow River Basin of Shaanxi, China. Int J Environ Res Public Health. 19(15):9547. doi: 10.3390/ijerph19159547.